
全球经济体对外开放度的空间非均衡性及其分布动态演进
|
谢晶(1987—),男,博士,讲师,研究方向为现代管理理论与方法、绿色可持续发展、口岸通关管理。E-mail:xiejing1226@126.com |
收稿日期: 2023-06-02
修回日期: 2023-10-11
网络出版日期: 2024-09-12
基金资助
国家社会科学基金项目(20BJL018)
海关总署科研项目(2022HK102)
海关总署科研项目(2023HK139)
国家重点研发计划项目(2022YFC2602400)
Spatial Disequilibrium and Dynamic Evolution of Global Economics’ External Openness
Received date: 2023-06-02
Revised date: 2023-10-11
Online published: 2024-09-12
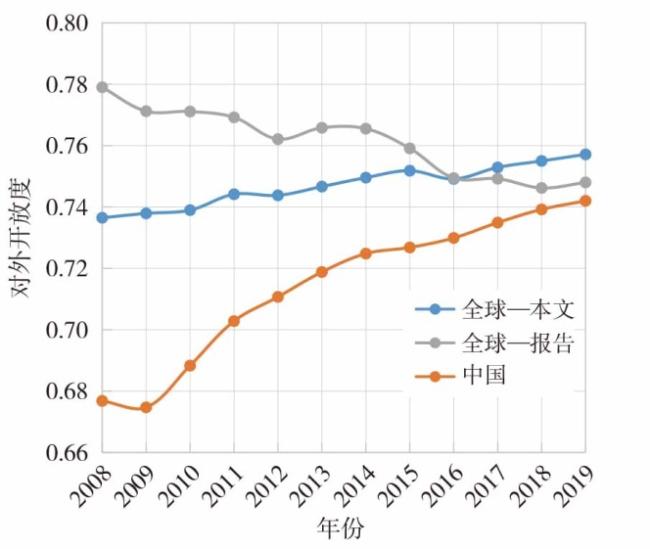
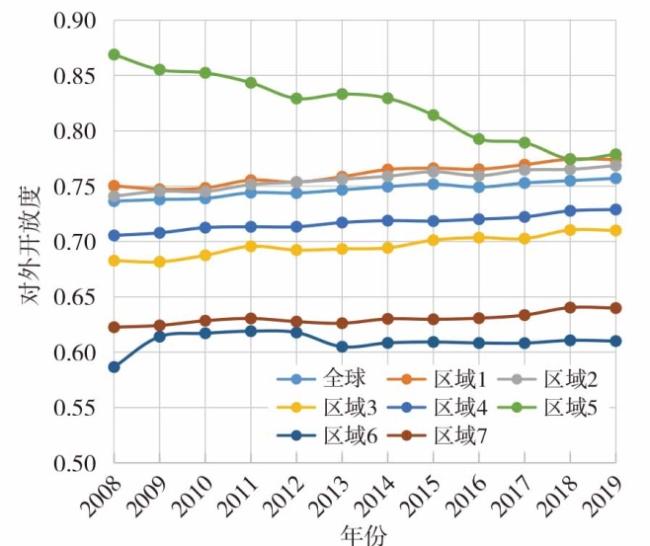
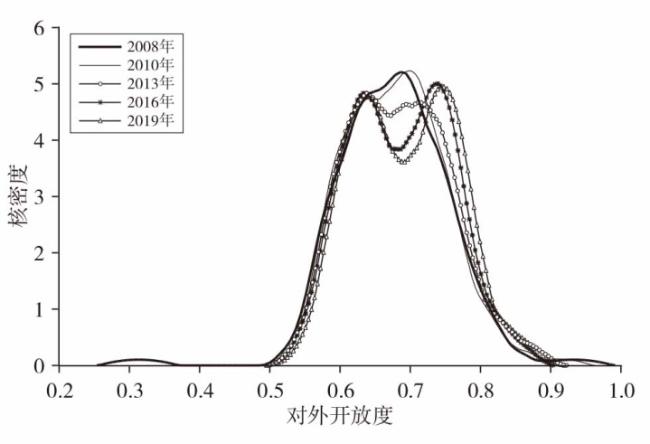
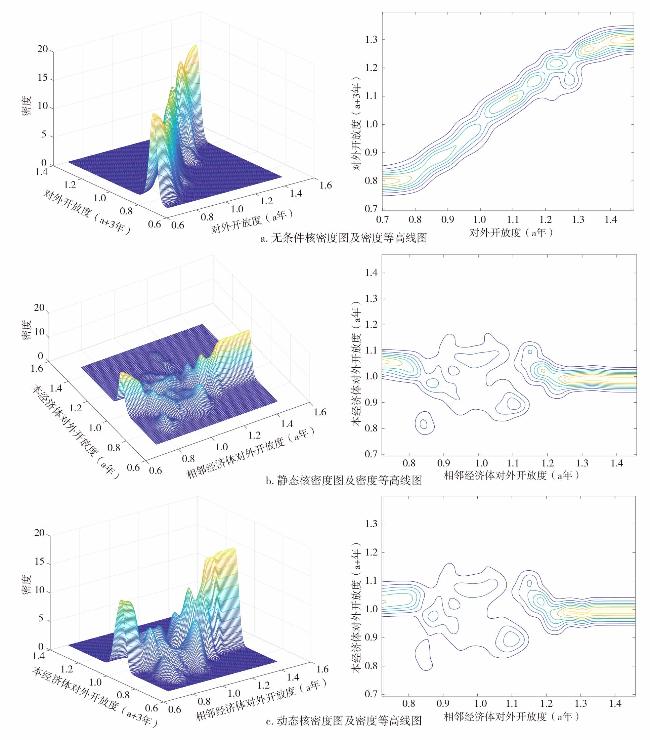
文章选取2008—2019年全球129个主要经济体对外开放指数,从“全球—区域—经济体”三层视角全面刻画全球主要经济体对外开放度的空间分布特征,并借助Dagum基尼系数考察全球主要经济体对外开放度的空间非均衡性及其来源结构分解,在此基础上,基于扩展的分布动态学模型进一步揭示全球主要经济体对外开放度的动态演进趋势,最后依据系统观从自然、经济、政治及文化4个方面对其演进机制进行分析。研究发现:①全球整体开放度水平呈现缓慢上升趋势,北美地区对外开放度水平位于全球七大区域之首,主要经济体对外开放度空间差异明显;②全球主要经济体对外开放度差距有所缩小,区域之间的对外开放度差距在全球开放度差距的贡献中处于主导地位;③在考虑时间跨度和地理空间位置的基础上,全球主要经济体对外开放度具有较为明显的空间效应,且内部流动性随时间逐渐增强。
谢晶 , 李迪 . 全球经济体对外开放度的空间非均衡性及其分布动态演进[J]. 经济地理, 2024 , 44(3) : 33 -44 . DOI: 10.15957/j.cnki.jjdl.2024.03.004
This paper selects the index for opening-up to the outside world of 129 major economies in 2008-2019,comprehensively describes the spatial distribution of opening-up to the outside world from the perspective of "globality-region-economy",and analyzes the spatial disequilibrium of the degree of opening-up to the outside world of major economics and its source structural decomposition with the help of Dagum Gini coefficient. Based on the above,it further reveals the dynamic evolution of the degree of opening-up to the outside world of major economies by means of the extended distribution dynamic model,and analyzes its evolution mechanism from the aspects of nature,economy,politics and culture based on the systematic perspective. The results of the study show that: 1) The overall level of opening-up to the outside world shows a slow upward trend,the level of opening-up to the outside world of North America ranks first among the seven regions in the world,the spatial difference of the degree of opening-up to the outside world of major economies is obvious. 2) The gap between the world's major economies has narrowed in terms of the degree of opening-up to the outside world of major economies,and the regional gap of the degree of opening-up to the outside world is dominant in the contribution of the global openness gap. 3) On the basis of considering the time span and geospatial location,the degree of opening-up to the outside world of major economies has obvious spatial effects,and the internal mobility gradually increases over time. The research results can provide a scientific basis for the formulation of China's high-quality opening-up policy.
表1 2008和2019年全球主要经济体对外开放度排名前十位和后十位情况Tab.1 Top 10 and bottom 10 of major economies in terms of the degree of opening-up to the outside world in 2008 and 2019 |
| 序号 | 2008年前十位 | 2008年后十位 | 2019年前十位 | 2019年后十位 |
|---|---|---|---|---|
| 1 | 美国(0.9328) | 刚果(0.5848) | 新加坡(0.8646) | 斯里兰卡(0.5983) |
| 2 | 新加坡(0.8438) | 科特迪瓦(0.5823) | 德国(0.8552) | 刚果(0.5961) |
| 3 | 德国(0.8243) | 埃塞俄比亚(0.5822) | 中国香港(0.8503) | 马拉维(0.5909) |
| 4 | 中国香港(0.8221) | 马拉维(0.5777) | 爱尔兰(0.8371) | 埃塞俄比亚(0.5885) |
| 5 | 英国(0.7998) | 布隆迪(0.5671) | 英国(0.8171) | 坦桑尼亚(0.5867) |
| 6 | 马耳他(0.7921) | 苏丹(0.5629) | 瑞士(0.8133) | 科特迪瓦(0.5843) |
| 7 | 加拿大(0.7874) | 弗得角(0.5564) | 荷兰(0.7997) | 尼泊尔(0.5785) |
| 8 | 荷兰(0.7856) | 加蓬(0.5555) | 法国(0.7986) | 布隆迪(0.5723) |
| 9 | 法国(0.7848) | 中非共和国(0.5470) | 加拿大(0.7953) | 加蓬(0.5709) |
| 10 | 瑞士(0.7814) | 尼泊尔(0.3132) | 马耳他(0.7838) | 中非共和国(0.5508) |
表2 2008—2019年全球七大区域内部对外开放度的基尼系数Tab.2 Gini coefficient of the degree of opening-up to the outside world in seven global regions in 2008—2019 |
| 年份 | 区域1 | 区域2 | 区域3 | 区域4 | 区域5 | 区域6 | 区域7 |
|---|---|---|---|---|---|---|---|
| 2008 | 0.0564 | 0.0470 | 0.0272 | 0.0433 | 0.0423 | 0.0936 | 0.0383 |
| 2009 | 0.0558 | 0.0491 | 0.0283 | 0.0422 | 0.0400 | 0.0176 | 0.0402 |
| 2010 | 0.0551 | 0.0478 | 0.0279 | 0.0418 | 0.0378 | 0.0188 | 0.0406 |
| 2011 | 0.0559 | 0.0471 | 0.0296 | 0.0418 | 0.0298 | 0.0212 | 0.0408 |
| 2012 | 0.0536 | 0.0474 | 0.0304 | 0.0429 | 0.0232 | 0.0200 | 0.0391 |
| 2013 | 0.0552 | 0.0489 | 0.0303 | 0.0449 | 0.0239 | 0.0247 | 0.0364 |
| 2014 | 0.0550 | 0.0494 | 0.0294 | 0.0464 | 0.0215 | 0.0203 | 0.0378 |
| 2015 | 0.0543 | 0.0507 | 0.0315 | 0.0460 | 0.0162 | 0.0198 | 0.0379 |
| 2016 | 0.0546 | 0.0465 | 0.0309 | 0.0467 | 0.0043 | 0.0189 | 0.0371 |
| 2017 | 0.0558 | 0.0468 | 0.0317 | 0.0449 | 0.0008 | 0.0194 | 0.0356 |
| 2018 | 0.0545 | 0.0461 | 0.0321 | 0.0464 | 0.0069 | 0.0214 | 0.0353 |
| 2019 | 0.0551 | 0.0477 | 0.0327 | 0.0472 | 0.0092 | 0.0216 | 0.0348 |
| 均值 | 0.0551 | 0.0479 | 0.0302 | 0.0445 | 0.0213 | 0.0264 | 0.0378 |
| 年均增长率 | -0.0022 | 0.0013 | 0.0167 | 0.0078 | -0.1295 | -0.1246 | -0.0086 |
| 趋势 | 下降 | 上升 | 上升 | 上升 | 下降 | 下降 | 下降 |
表3 2008—2019年全球七大区域之间对外开放度的基尼系数Tab.3 Gini coefficient of the degree of opening-up to the outside world among seven global regions in 2008-2019 |
| 区域 区域 | 均值 | 年均增长率 | 区域 区域 | 均值 | 年均增长率 | |
|---|---|---|---|---|---|---|
| 1 2 | 0.0541 | -0.0020 | 3 4 | 0.0391 | 0.0121 | |
| 1 3 | 0.0457 | 0.0014 | 3 5 | 0.0847 | -0.0656 | |
| 1 4 | 0.0515 | 0.0037 | 3 6 | 0.0665 | -0.0360 | |
| 1 5 | 0.0816 | -0.0626 | 3 7 | 0.0634 | 0.0028 | |
| 1 6 | 0.0770 | -0.0294 | 4 5 | 0.0856 | -0.0520 | |
| 1 7 | 0.0747 | 0.0059 | 4 6 | 0.0674 | -0.0442 | |
| 2 3 | 0.0451 | 0.0075 | 4 7 | 0.0655 | -0.0071 | |
| 2 4 | 0.0506 | 0.0108 | 5 6 | 0.1496 | -0.0497 | |
| 2 5 | 0.0674 | -0.0767 | 5 7 | 0.1427 | -0.0357 | |
| 2 6 | 0.0879 | -0.0263 | 6 7 | 0.0349 | -0.0820 | |
| 2 7 | 0.0838 |
表4 2008—2019年全球主要经济体对外开放度的基尼系数及其分解Tab.4 Gini coefficient and its decomposition of the degree of opening-up to the outside world of major global economies in 2008-2019 |
| 年份 | 总体 | 区域 内部 | 贡献率(%) | 区域 之间 | 贡献率(%) | 超变 密度 | 贡献率(%) |
|---|---|---|---|---|---|---|---|
| 2008 | 0.0604 | 0.0094 | 15.5546 | 0.0346 | 57.2023 | 0.0165 | 27.2430 |
| 2009 | 0.0575 | 0.0096 | 16.6725 | 0.0313 | 54.4816 | 0.0166 | 28.8459 |
| 2010 | 0.0567 | 0.0094 | 16.6412 | 0.0308 | 54.3885 | 0.0164 | 28.9703 |
| 2011 | 0.0573 | 0.0094 | 16.4793 | 0.0318 | 55.4806 | 0.0161 | 28.0402 |
| 2012 | 0.0567 | 0.0094 | 16.5992 | 0.0320 | 56.3896 | 0.0153 | 27.0111 |
| 2013 | 0.0580 | 0.0096 | 16.4790 | 0.0330 | 56.9806 | 0.0154 | 26.5404 |
| 2014 | 0.0582 | 0.0096 | 16.5417 | 0.0330 | 56.6712 | 0.0156 | 26.7871 |
| 2015 | 0.0589 | 0.0098 | 16.6940 | 0.0331 | 56.2931 | 0.0159 | 27.0129 |
| 2016 | 0.0576 | 0.0093 | 16.1804 | 0.0332 | 57.7196 | 0.0150 | 26.1000 |
| 2017 | 0.0577 | 0.0093 | 16.1826 | 0.0336 | 58.2704 | 0.0147 | 25.5470 |
| 2018 | 0.0569 | 0.0092 | 16.2513 | 0.0327 | 57.4407 | 0.0150 | 26.3080 |
| 2019 | 0.0580 | 0.0095 | 16.3352 | 0.0334 | 57.5775 | 0.0151 | 26.0873 |
| 均值 | 0.0578 | 0.0095 | 16.3843 | 0.0327 | 56.5746 | 0.0156 | 27.0411 |
| 年均增长率 | -0.0037 | 0.0010 | 0.0045 | -0.0032 | 0.0006 | -0.0080 | -0.0039 |
| 趋势 | 下降 | 上升 | 上升 | 下降 | 平稳 | 下降 | 下降 |
表5 全球主要经济体对外开放度的传统马尔科夫链转移概率矩阵Tab.5 Traditional Markov chain transition probability matrix for the degree of opening-up to the outside world of major global economies |
| 时间跨度(年) | 类别 | 低 | 中低 | 中高 | 高 |
|---|---|---|---|---|---|
| 1 | 低 | 0.9574 | 0.0426 | 0.0000 | 0.0000 |
| 中低 | 0.0568 | 0.9091 | 0.0341 | 0.0000 | |
| 中高 | 0.0000 | 0.0597 | 0.9063 | 0.0341 | |
| 高 | 0.0000 | 0.0000 | 0.0771 | 0.9229 | |
| 2 | 低 | 0.9563 | 0.0406 | 0.0031 | 0.0000 |
| 中低 | 0.0813 | 0.8719 | 0.0469 | 0.0000 | |
| 中高 | 0.0031 | 0.0938 | 0.8750 | 0.0281 | |
| 高 | 0.0000 | 0.0000 | 0.1273 | 0.8727 | |
| 3 | 低 | 0.9444 | 0.0486 | 0.0069 | 0.0000 |
| 中低 | 0.1146 | 0.8438 | 0.0417 | 0.0000 | |
| 中高 | 0.0069 | 0.1181 | 0.8576 | 0.0174 | |
| 高 | 0.0000 | 0.0000 | 0.1616 | 0.8384 | |
| 4 | 低 | 0.9297 | 0.0586 | 0.0117 | 0.0000 |
| 中低 | 0.1328 | 0.8086 | 0.0586 | 0.0000 | |
| 中高 | 0.0078 | 0.1523 | 0.8164 | 0.0234 | |
| 高 | 0.0000 | 0.0000 | 0.1970 | 0.8030 | |
| 5 | 低 | 0.9196 | 0.0625 | 0.0179 | 0.0000 |
| 中低 | 0.1563 | 0.7857 | 0.0580 | 0.0000 | |
| 中高 | 0.0134 | 0.1830 | 0.7813 | 0.0223 | |
| 高 | 0.0000 | 0.0000 | 0.2381 | 0.7619 |
表6 全球主要经济体对外开放度的空间马尔科夫链转移概率矩阵Tab.6 Spatial Markov chain transition probability matrix for the degree of opening-up to the outside world of major global economies |
| 邻居 | 低 | 中低 | 中高 | 高 | ||
|---|---|---|---|---|---|---|
| T=1 | 低 | 低 | 0.8409 | 0.1364 | 0.0227 | 0.0000 |
| 中低 | 0.0149 | 0.9403 | 0.0448 | 0.0000 | ||
| 中高 | 0.0000 | 0.0000 | 0.9388 | 0.0612 | ||
| 高 | 0.0000 | 0.0000 | 0.0263 | 0.9737 | ||
| 中低 | 低 | 0.8857 | 0.1143 | 0.0000 | 0.0000 | |
| 中低 | 0.0426 | 0.8723 | 0.0851 | 0.0000 | ||
| 中高 | 0.0000 | 0.0175 | 0.8421 | 0.1404 | ||
| 高 | 0.0000 | 0.0000 | 0.0339 | 0.9661 | ||
| 中高 | 低 | 0.9423 | 0.0577 | 0.0000 | 0.0000 | |
| 中低 | 0.0313 | 0.8438 | 0.1250 | 0.0000 | ||
| 中高 | 0.0000 | 0.0444 | 0.7778 | 0.1778 | ||
| 高 | 0.0000 | 0.0000 | 0.0000 | 1.0000 | ||
| 高 | 低 | 0.9254 | 0.0746 | 0.0000 | 0.0000 | |
| 中低 | 0.0192 | 0.8077 | 0.1731 | 0.0000 | ||
| 中高 | 0.0000 | 0.0426 | 0.8723 | 0.0851 | ||
| 高 | 0.0000 | 0.0000 | 0.0000 | 1.0000 | ||
| T=5 | 低 | 低 | 0.6667 | 0.3000 | 0.0333 | 0.0000 |
| 中低 | 0.0000 | 0.8049 | 0.1951 | 0.0000 | ||
| 中高 | 0.0000 | 0.0690 | 0.3793 | 0.5517 | ||
| 高 | 0.0000 | 0.0000 | 0.0385 | 0.9615 | ||
| 中低 | 低 | 0.6250 | 0.3333 | 0.0417 | 0.0000 | |
| 中低 | 0.0370 | 0.6667 | 0.2963 | 0.0000 | ||
| 中高 | 0.0278 | 0.1111 | 0.3333 | 0.5278 | ||
| 高 | 0.0000 | 0.0000 | 0.0256 | 0.9744 | ||
| 中高 | 低 | 0.8519 | 0.1481 | 0.0000 | 0.0000 | |
| 中低 | 0.0000 | 0.6818 | 0.3182 | 0.0000 | ||
| 中高 | 0.0323 | 0.1290 | 0.3871 | 0.4516 | ||
| 高 | 0.0000 | 0.0000 | 0.0000 | 1.0000 | ||
| 高 | 低 | 0.8667 | 0.1333 | 0.0000 | 0.0000 | |
| 中低 | 0.0556 | 0.5833 | 0.3333 | 0.0278 | ||
| 中高 | 0.0000 | 0.0667 | 0.5000 | 0.4333 | ||
| 高 | 0.0000 | 0.0000 | 0.0000 | 1.0000 |
| [1] |
简新华. 社会主义市场经济对外开放理论的创新和发展[J]. 社会科学战线, 2022(10):58-65.
|
| [2] |
全毅. 改革开放40年中国对外开放理论创新与发展[J]. 经济学家, 2018(11):5-12.
|
| [3] |
欧阳海琴, 凌爱凡. 人民币国际化、汇率波动、跨境结算与中国进出口贸易——基于两国开放经济的均衡模型与“一带一路”沿线国家的实证分析[J]. 系统工程理论与实践, 2022, 42(12):3165-3183.
|
| [4] |
莫里斯·奥布斯特菲尔德. 全球非均衡复苏下:美联储政策转向对新兴市场和发展中经济体的影响与应对[J]. 王宇,译. 金融发展研究, 2021(12):41-44.
|
| [5] |
江小涓. 新中国对外开放70年:赋能增长与改革[J]. 管理世界, 2019, 35(12):1-16,103,214.
|
| [6] |
张辉, 闫强明, 李宁静. “一带一路”倡议推动国际贸易的共享效应分析[J]. 经济研究, 2023, 58(5):4-22.
|
| [7] |
付国梅, 唐加福. 美国再工业化祸兮福兮:双向FDI能否促进中国经济高质量发展?——基于产业结构和技术创新的中介作用[J]. 系统管理学报, 2022, 31(6):1137-1149.
|
| [8] |
黎峰. 逆全球化浪潮:内在逻辑、发展前景与中国方略[J]. 经济学家, 2022(11):52-61.
|
| [9] |
葛浩洋. 全球化和逆全球化何以交替并行?:一个马克思主义的分析[J]. 世界经济研究, 2023(6):3-13,134.
|
| [10] |
黄漓江, 李长英. 对外开放是否缩小了中美制造业的技术差距[J]. 国际贸易问题, 2020(1):110-126.
|
| [11] |
胡智, 刘志雄. 中国经济开放度的测算与国际比较[J]. 世界经济研究, 2005(7):10-17,25.
|
| [12] |
杨少文, 熊启泉. 1994—2011年的中国经济开放度——基于GDP份额法的测算[J]. 国际贸易问题, 2014(3):13-24.
|
| [13] |
孙丽冬, 陈耀辉. 经济对外开放度指数的测算模型[J]. 统计与决策, 2008(14):35-36.
|
| [14] |
刘镇, 邱志萍, 朱丽萌. 海上丝绸之路沿线国家投资贸易便利化时空特征及对贸易的影响[J]. 经济地理, 2018, 38(3):11-20.
|
| [15] |
戴翔. 要素分工、制度型开放和出口贸易高质量发展[J]. 天津社会科学, 2021(3):93-98.
|
| [16] |
李光勤, 曹建华, 邵帅. 语言多样性与中国对外开放的地区差异[J]. 世界经济, 2017, 40(3):144-168.
|
| [17] |
Ezcurra, Rodriguez-Pose. Trade openness and spatial inequality in emerging countries[J]. Spatial Economic Analysis, 2014(2):162-182.
|
| [18] |
斯丽娟. “一带一路”倡议与区域对外开放度时空演化[J]. 西北师大学报:社会科学版, 2019, 56(3):118-126.
|
| [19] |
杨少文, 熊启泉. 中国农业对外开放度测算及国际比较:1991—2011年[J]. 农村经济, 2015(3):13-17.
|
| [20] |
王孝松, 周钰丁, 肖尧. 地缘经济因素的贸易效应——来自“一带一路”沿线国家的证据[J]. 经济研究, 2022(9):174-191.
|
| [21] |
杨文龙, 杜德斌, 刘承良, 等. 中国地缘经济联系的时空演化特征及其内部机制[J]. 地理学报, 2016, 71(6):956-969.
|
| [22] |
庄德林, 李嘉豪, 陈紫若, 等. 全球稀土贸易网络的动态演变与影响机制——基于产业链的视角[J]. 地理科学, 2022, 42(11):1900-1911.
|
| [23] |
许和连, 孙天阳, 成丽红. “一带一路”高端制造业贸易格局及影响因素研究——基于复杂网络的指数随机图分析[J]. 财贸经济, 2015, 36(12):74-88.
|
| [24] |
|
| [25] |
|
| [26] |
沈丽, 鲍建慧. 中国金融发展的分布动态演进:1978—2008年——基于非参数估计方法的实证研究[J]. 数量经济技术经济研究, 2013, 30(5):33-47.
|
| [27] |
|
| [28] |
中国行政体制改革研究会课题组. 经济全球化与世界开放大势[J]. 中国金融, 2021(23):15-18.
|
| [29] |
马卫, 曹小曙, 李涛, 等. 开放度水平提高是否促进了区域经济增长?——基于“一带一路”沿线国家面板数据的实证分析[J]. 经济经纬, 2019, 36(5):64-71.
|
| [30] |
刘仕国, 宋泓, 高凌云, 等. 世界开放大变局:基于对外开放指数的测度[J]. 国际经济评论, 2021(1):28-55,4.
|
| [31] |
国务院发展研究中心课题组. 未来15年国际经济格局变化和中国战略选择[J]. 管理世界, 2018, 34(12):1-12.
|
| [32] |
谭丹, 马顺甜. 大豆国际贸易格局演化与中国对策[J]. 经济地理, 2022, 42(9):110-119.
|
| [33] |
聂常乐, 姜海宁, 段健. 21世纪以来全球粮食贸易网络空间格局演化[J]. 经济地理, 2021, 41(7):119-127.
|
| [34] |
宋周莺, 刘卫东. 新时期高水平对外开放与“一带一路”建设[J]. 经济地理, 2023, 43(3):15-22.
|
| [35] |
孙久文, 蒋治. 沿边地区对外开放70年的回顾与展望[J]. 经济地理, 2019, 39(11):1-8.
|
/
| 〈 |
|
〉 |