
双重边界视角下乡镇人口收缩的精准识别与特征分析——以黄河流域为例
|
张学良(1978—),男,博士,教授,博士生导师,研究方向为城市与区域科学。E-mail:zhang.xueliang@mail.shufe.edu.cn |
收稿日期: 2024-01-13
修回日期: 2024-02-27
网络出版日期: 2024-09-12
基金资助
国家社会科学基金重大项目(2023&ZD067)
上海市教育委员会2023年度科研创新计划重大项目(2023SKZD14)
上海财经大学研究生创新基金项目(CXJJ-2022-428)
Accurate Identification and Characteristic Analysis of Township Population Shrinkage from the Perspective of Dual Boundary:A Case Study of the Yellow River Basin
Received date: 2024-01-13
Revised date: 2024-02-27
Online published: 2024-09-12
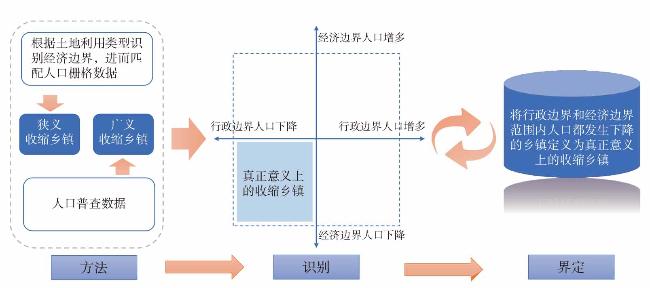
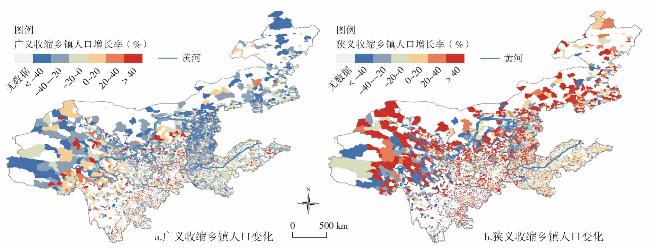
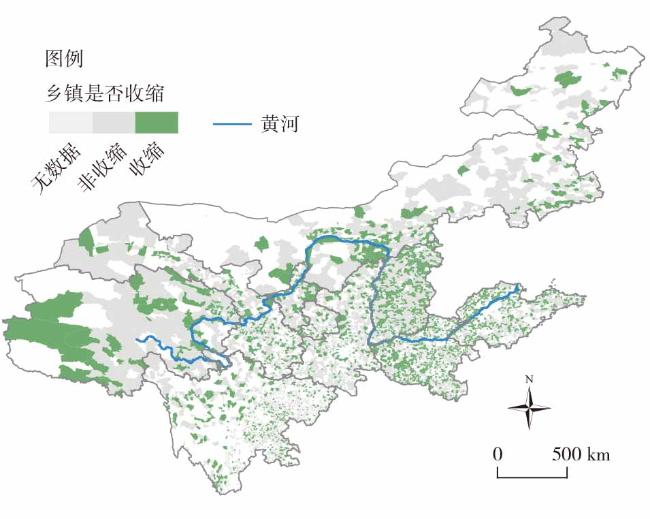
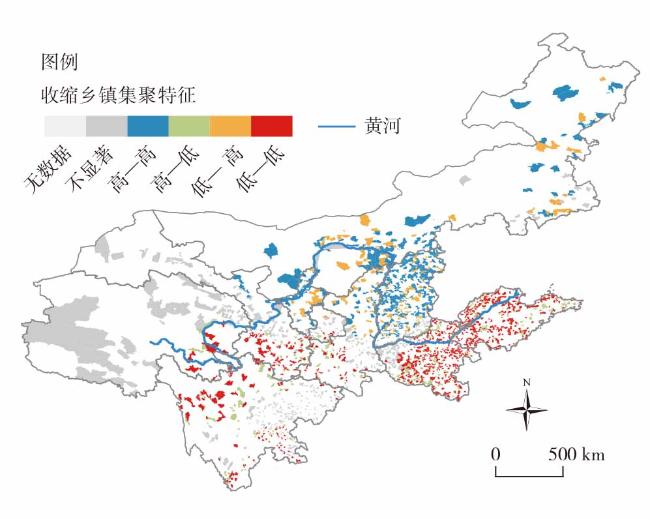
文章以黄河流域乡镇为研究对象,以“六普”“七普”、空间遥感和相关经济社会统计数据为支撑,提出一种在行政边界(广义)和经济边界(狭义)双重视角下的收缩识别方法,对黄河流域乡镇人口收缩进行精准界定,进而分析人口收缩的空间格局和特征。研究发现:①2010—2020年黄河流域发生了严重的乡镇收缩现象,76.82%的乡镇发生广义收缩,45.65%的乡镇发生狭义收缩,其中2629个乡镇同时发生广义收缩和狭义收缩,即真正意义上的收缩,占比36.42%。②收缩乡镇的分布呈现出不均衡性,以黄河“几字湾”的西北侧和东侧为主,基本形成了集中连片的分布态势,其中河南省收缩乡镇占比最高。③从空间自相关性看,黄河流域收缩乡镇具有显著的空间集聚特征,低—低集聚区和高—高集聚区的乡镇数量占比分别为37.58%和19.25%。④相比于非收缩乡镇,收缩乡镇劳动年龄人口减少更快,老龄化程度更严重、抚养压力更大、人口红利更少。⑤收缩乡镇在工业企业、规模以上工业企业和综合商店或超市数量的高值区间内远远低于非收缩乡镇,呈现出发展分异。⑥收缩更容易发生在人口规模较小的乡镇;资源型城市内的乡镇比非资源型城市内的乡镇人口收缩程度严重;城市群内的乡镇比城市群外的乡镇人口流失更严重。
张学良 , 潘婷 . 双重边界视角下乡镇人口收缩的精准识别与特征分析——以黄河流域为例[J]. 经济地理, 2024 , 44(3) : 1 -10 . DOI: 10.15957/j.cnki.jjdl.2024.03.001
Taking the townships in the Yellow River basin as the research object and based on the data of the Sixth National Census,the Seventh National Census,spatial remote sensing and relevant economic and social statistical data,this paper proposes a shrinkage identification method from the dual perspectives of administrative boundary (broad sense) and economic boundary (narrow sense),so as to accurately define the population shrinkage of townships in the Yellow River basin,and then analyze the spatial pattern and characteristics of population shrinkage. The results show that: 1) From 2010 to 2020,a serious shrinkage phenomenon occurred in the Yellow River basin,with 76.82% of the townships experiencing administrative boundary shrinkage and 45.65% experiencing economic boundary shrinkage. 2629 townships experienced simultaneously two types of boundary shrinkage,which accounts for 36.42%. 2) Shrinking townships show the uneven distribution characteristic,are mainly distributed in the northwest and east sides of the middle and upper reaches of the Yellow River,and basically form a concentrated and contiguous distribution trend,Henan Province accounts for the highest proportion of shrinking townships. 3) From the perspective of spatial autocorrelation,shrinking townships have significant spatial agglomeration characteristics,and the number of townships in low-low agglomeration areas and high-high agglomeration areas accounts for 37.58% and 19.25%,respectively. 4) Compared with non-shrinking townships,shrinking townships have a faster decrease in working-age population. The aging degree is more serious,the pressure for supporting the elderly is greater and the demographic dividend is smaller. 5) The number of industrial enterprises,industrial enterprises above designated size,general stores and supermarkets in shrinking townships is much lower than that in non-shrinking townships,showing a difference in development. 6) Shrinkage is more likely to occur in townships with smaller populations,the population shrinkage of townships in resource-based cities is more serious than that in non-resource-based cities. The population loss of townships within urban agglomerations is more serious than that of townships outside urban agglomerations.
表1 黄河流域乡镇2010—2020年广义收缩数据处理结果Tab.1 Processing results of generalized shrinkage data of townships in the Yellow River basin from 2010 to 2020 |
| 指标 | 乡镇 总数 | 删除数 | 有效乡镇 | 收缩乡镇 | ||||
|---|---|---|---|---|---|---|---|---|
| 总计 | 乡 | 镇 | 总计 | 乡 | 镇 | |||
| 数量(个) | 10436 | 2370 | 8066 | 2684 | 5382 | 6196 | 2293 | 3903 |
| 比例(%) | 100.00 | 22.71 | 77.29 | 33.28 | 66.72 | 76.82 | 85.43 | 72.52 |
注:乡镇总数是以2020年为准,不包含街道数量。收缩乡(镇)的比例是收缩乡(镇)的数量与有效乡(镇)数量的比值,表示乡(镇)发生收缩的概率。 |
表2 黄河流域乡镇2010—2020年狭义收缩数据处理结果Tab.2 Processing results of narrow shrinkage data of townships in the Yellow River basin from 2010 to 2020 |
| 指标 | 乡镇 总数 | 删除数 | 有效乡镇 | 收缩乡镇 | ||||
|---|---|---|---|---|---|---|---|---|
| 总计 | 乡 | 镇 | 总计 | 乡 | 镇 | |||
| 数量(个) | 8066 | 848 | 7218 | 2120 | 5098 | 3521 | 995 | 2526 |
| 比例(%) | 100.00 | 10.51 | 89.49 | 26.28 | 63.20 | 43.65 | 12.34 | 31.32 |
表3 黄河流域乡镇人口结构Tab.3 Population structure of townships in the Yellow River basin |
| 类型 | 人口规模(万人) | 人口增长率 (%) | 0~14岁人口比重(%) | 15~64岁人口比重(%) | 65岁及以上人口比重(%) | 人口抚养比(%) | ||||||||||
|---|---|---|---|---|---|---|---|---|---|---|---|---|---|---|---|---|
| 2020 | 2010 | 2020 | 2010 | 2020 | 2010 | 2020 | 2010 | 2020 | 2010 | |||||||
| 收缩 | 5595.81 | 7268.71 | -29.90 | 19.44 | 18.80 | 62.40 | 71.70 | 18.16 | 9.49 | 60.25 | 39.46 | |||||
| 非收缩 | 12167.77 | 12214.41 | -0.38 | 19.42 | 18.64 | 64.32 | 72.02 | 16.27 | 9.34 | 55.48 | 38.84 | |||||
表4 黄河流域乡镇主要社会发展指标Tab.4 Main social development indicators of townships in the Yellow River basin |
| 指标 | 区间 | 平均个数 (个) | ||
|---|---|---|---|---|
| 工业企业个数(个) | >1000 | >500 | >100 | |
| 非收缩乡镇占比(%) | 0.52 | 1.39 | 19.64 | 50 |
| 收缩乡镇占比(%) | 0.15 | 0.61 | 11.30 | 50 |
| 规模以上工业企业个数(个) | >100 | >20 | 0~20 | |
| 非收缩乡镇占比(%) | 0.13 | 7.87 | 92.00 | 8 |
| 收缩乡镇占比(%) | 0.00 | 5.02 | 94.98 | 7 |
| 营业面积50 m2以上的综合商店或超市个数(个) | >200 | >50 | 0~50 | |
| 非收缩乡镇占比(%) | 3.38 | 48.12 | 48.51 | 46 |
| 收缩乡镇占比(%) | 1.98 | 31.08 | 66.95 | 44 |
表5 不同人口规模的乡镇收缩情况Tab.5 Shrinkage of townships by population size |
| 人口规模(万人) | 收缩数(个) | 占比(%) | 乡镇数(个) | 收缩概率(%) |
|---|---|---|---|---|
| ≥10 | 4 | 0.15 | 120 | 3.33 |
| 5~10 | 118 | 4.49 | 572 | 20.63 |
表6 不同类型的乡镇收缩情况Tab.6 Shrinkage of townships by different types |
| 类型 | 乡镇数(个) | 收缩个数(个) | 占比(%) | 收缩程度占比(%) | ||||
|---|---|---|---|---|---|---|---|---|
| ≤10 | (10,20] | (20,40] | (40,60] | >60 | ||||
| 资源型 | 3889 | 1439 | 37.00 | 13.61 | 22.15 | 44.03 | 16.11 | 4.10 |
| 非资源型 | 3329 | 1189 | 35.72 | 22.96 | 29.35 | 37.59 | 7.74 | 2.35 |
| 全样本 | 7218 | 2629 | 36.42 | 2.78 | 10.40 | 32.97 | 19.05 | 31.31 |
表7 不同类型的收缩乡镇情况Tab.7 Shrinkage of townships by different resource types |
| 类型 | 乡镇数(个) | 收缩数(个) | 占比(%) |
|---|---|---|---|
| 成熟型 | 2166 | 801 | 36.98 |
| 成长型 | 816 | 254 | 31.13 |
| 衰退型 | 330 | 133 | 40.30 |
| 再生型 | 577 | 251 | 43.50 |
表8 不同城市群的乡镇收缩情况Tab.8 Shrinkage of townships in different urban agglomerations |
| 类型 | 整体人口增长率(%) | 各乡镇平均人口增长率(%) | 乡镇数(个) | 收缩数(个) | 占比(%) |
|---|---|---|---|---|---|
| 山东半岛城市群 | -10.95 | -12.15 | 800 | 410 | 51.25 |
| 中原城市群 | -11.13 | -13.63 | 1649 | 717 | 43.48 |
| 关中平原城市群 | -5.57 | -9.46 | 526 | 165 | 31.37 |
| 兰州—西宁城市群 | -0.99 | -14.27 | 271 | 96 | 35.42 |
注:由于本文研究范围是黄河流域,因此中原城市群中不包含安徽和河北的城市。 |
| [1] |
苏红键, 魏后凯. 改革开放40年中国城镇化历程、启示与展望[J]. 改革, 2018(11):49-59.
|
| [2] |
张学良, 刘玉博, 吕存超. 中国城市收缩的背景、识别与特征分析[J]. 东南大学学报:哲学社会科学版, 2016, 18(4):132-139,148.
|
| [3] |
张学良, 潘婷. 中国式现代化背景下的中国乡镇实践与发展路径探析[J]. 重庆大学学报:社会科学版, 2024, 30(1):1-17.
|
| [4] |
|
| [5] |
|
| [6] |
|
| [7] |
|
| [8] |
|
| [9] |
|
| [10] |
|
| [11] |
|
| [12] |
|
| [13] |
|
| [14] |
柏中强, 王卷乐, 杨雅萍, 等. 基于乡镇尺度的中国25省区人口分布特征及影响因素[J]. 地理学报, 2015, 70(8):1229-1242.
|
| [15] |
尹旭, 王婧, 李裕瑞, 等. 中国乡镇人口分布时空变化及其影响因素[J]. 地理研究, 2022, 41(5):1245-1261.
|
| [16] |
张梦梦, 张丽君, 秦耀辰, 等. 黄河流域乡镇人口——经济增长与收缩格局及影响因素[J]. 地理科学进展, 2022, 41(6):999-1011.
|
| [17] |
|
| [18] |
|
| [19] |
|
| [20] |
|
| [21] |
魏守华, 杨阳, 陈珑隆. 城市等级、人口增长差异与城镇体系演变[J]. 中国工业经济, 2020(7):5-23.
|
| [22] |
刘玉博, 张学良. 长江经济带局部城市收缩、发展分异与空间作用机理探讨[J]. 华东师范大学学报:哲学社会科学版, 2023, 55(4):129-143,179.
|
/
| 〈 |
|
〉 |