×
模态框(Modal)标题
在这里添加一些文本
Close
Close
Submit
Cancel
Confirm
×
模态框(Modal)标题
×
Journal
Article
Figure
Search
EN
中文
Home
About Journal
About Journal
Indexed in
Awards
Editorial Board
Guide for Authors
Browse
Current Issue
Online First
Archive
Highlights
Topic
Archive by Subject
Most Viewed
Most Download
Most Cited
E-mail Alert
RSS
Subscribe
Advertisement
Contact us
EN
中文
Figure/Table detail
Evolution Characteristics and Influencing Factors of Green Low-Carbon Transition at the Municipal Level in the Yangtze River Economic Belt
DENG Qizhong, WANG Zhenyu
Economic geograph
, 2025, 45(
11
): 223-233. DOI:
10.15957/j.cnki.jjdl.2025.11.022
Fig.5
LISA time path of green low-carbon transition index in the Yangtze River Economic Belt
Other figure/table from this article
Tab.1
Evaluation index system and description for regional green low-carbon transition
Fig.1
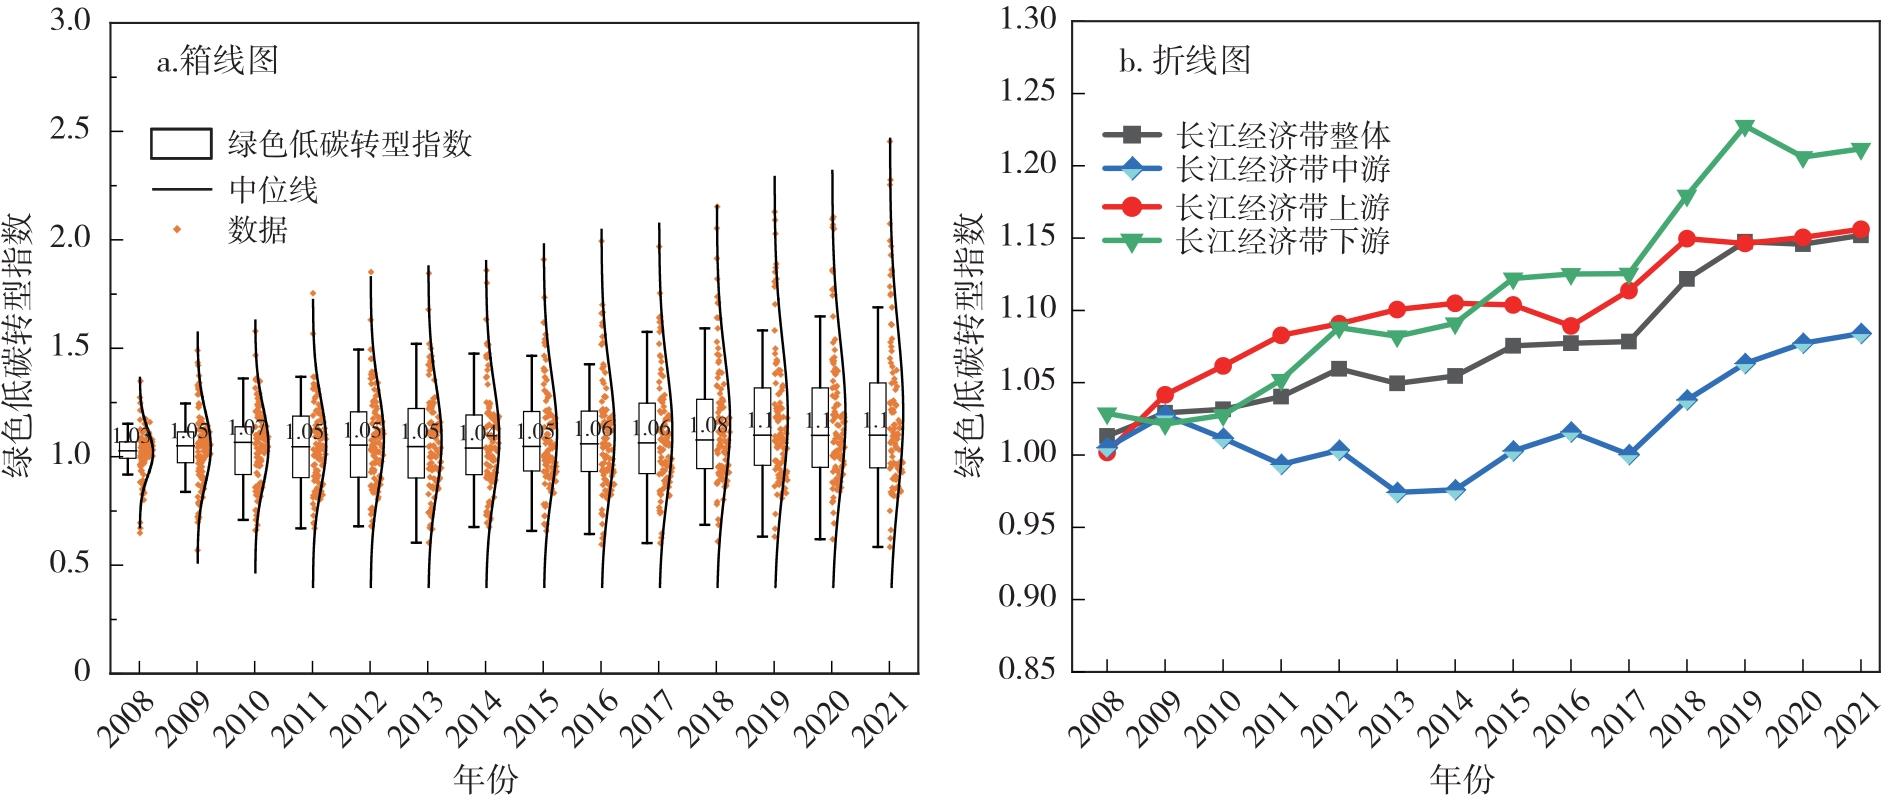
Evolution of the green low-carbon transition index in the Yangtze River Economic Belt from 2008 to 2021
Fig.2
Core density curve of green low-carbon transition index in the Yangtze River Economic Belt
Fig.3
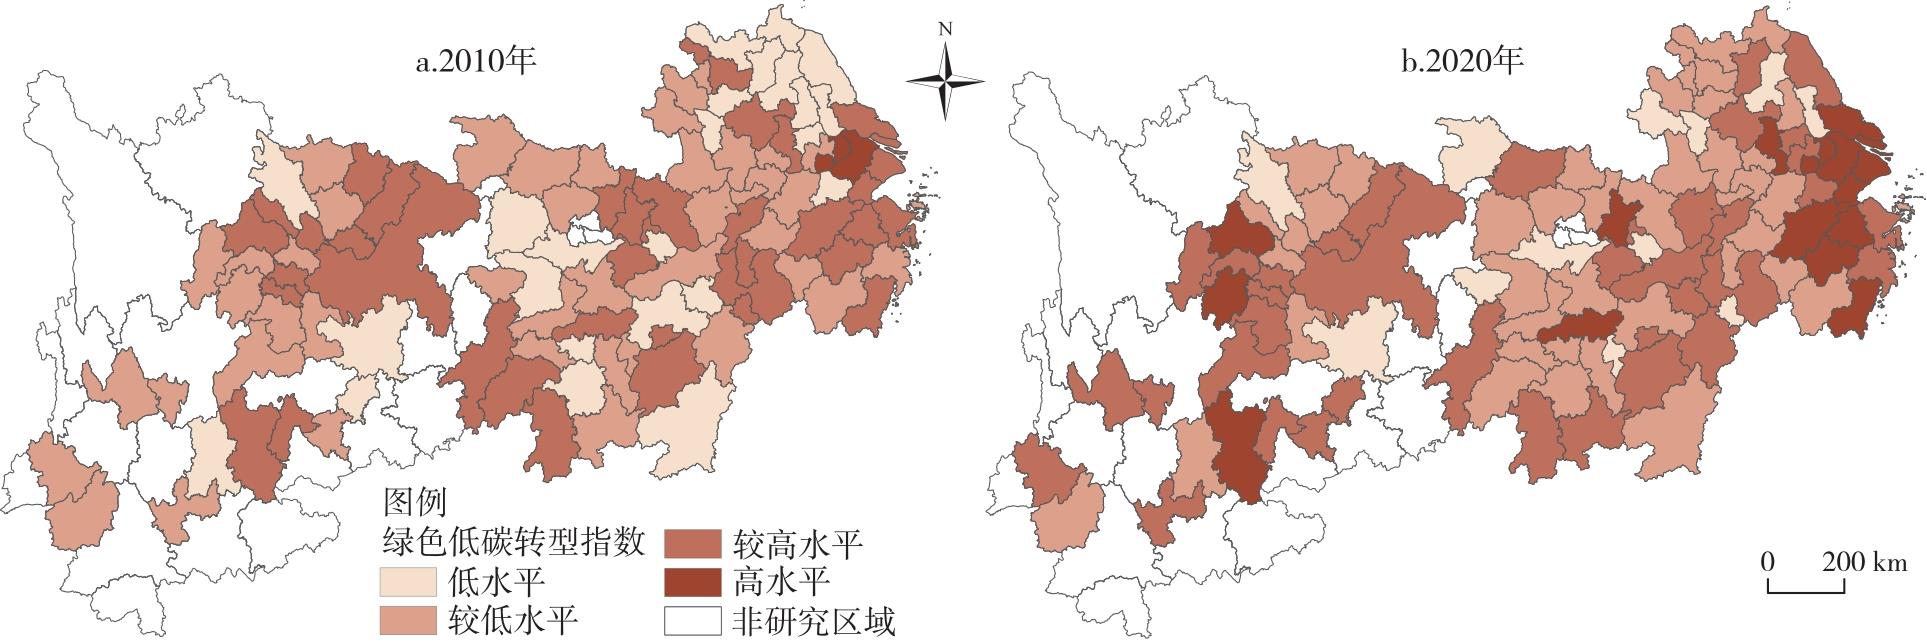
Evolution in classification of the green low-carbon transition index at the municipal level in the Yangtze River Economic Belt
Fig.4
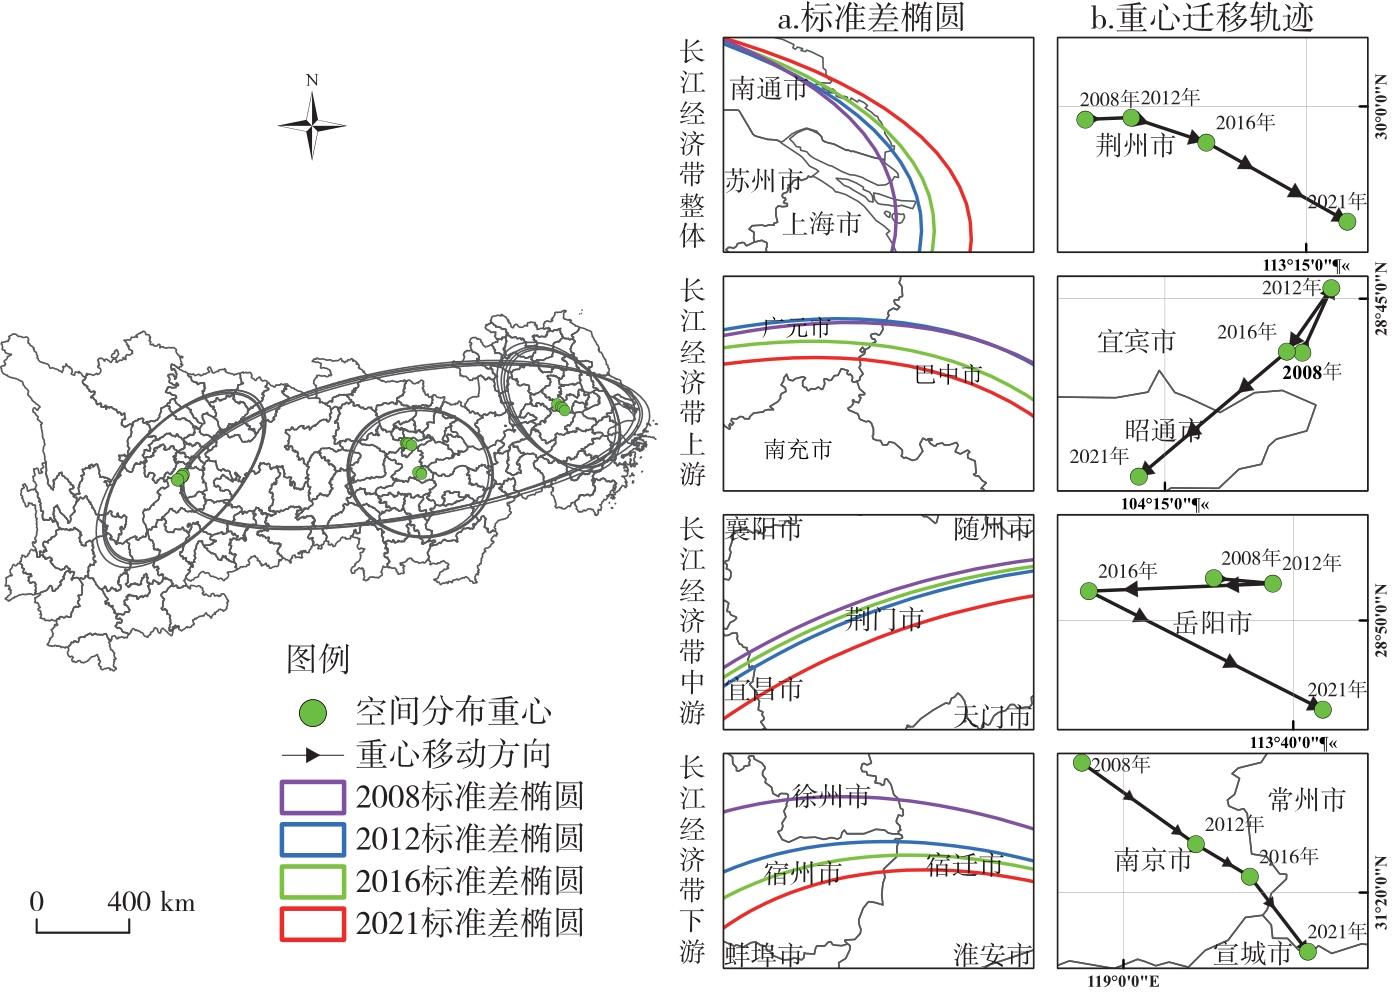
Ellipse of standard deviation and center of gravity migration trajectory of green low-carbon transition index in the Yangtze River Economic Belt
Tab.2
Spatiotemporal transition matrix of Moran scatter plot for green low-carbon transition index in the Yangtze River Economic Belt
Tab.3
Influencing factors and variable description of green low-carbon transition in the Yangtze River Economic Belt
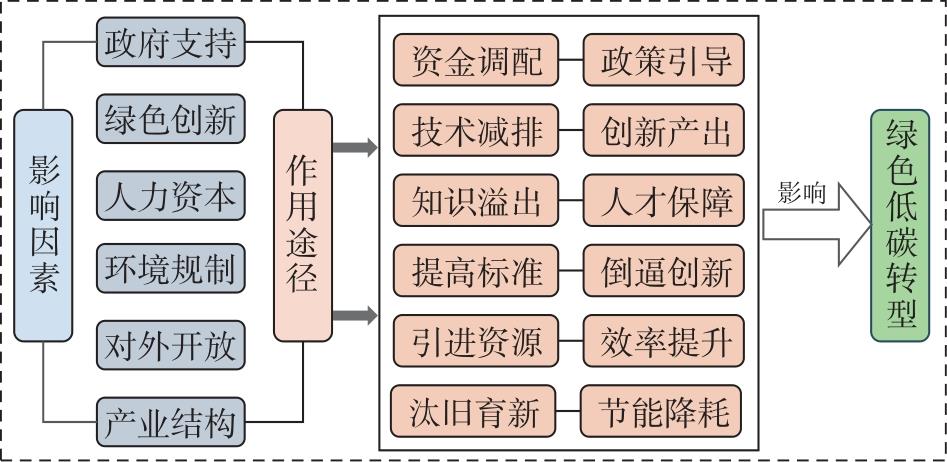
Fig.6
Influence mechanism of the green low-carbon transition in the Yangtze River Economic Belt
Tab.4
Baseline regression and robustness test results
Tab.5
Regression results of heterogeneity
Tab.6
Panel quantile regression results