×
模态框(Modal)标题
在这里添加一些文本
Close
Close
Submit
Cancel
Confirm
×
模态框(Modal)标题
×
Journal
Article
Figure
Search
EN
中文
Home
About Journal
About Journal
Indexed in
Awards
Editorial Board
Guide for Authors
Browse
Current Issue
Online First
Archive
Highlights
Topic
Archive by Subject
Most Viewed
Most Download
Most Cited
E-mail Alert
RSS
Subscribe
Advertisement
Contact us
EN
中文
Figure/Table detail
The Carbon Emission Effect of the Belt and Road Initiative on Cities along the Domestic Route
CHEN Liang, GAO Haoyu, HUANG Rongrong
Economic geograph
, 2024, 44(
10
): 185-193. DOI:
10.15957/j.cnki.jjdl.2024.10.019
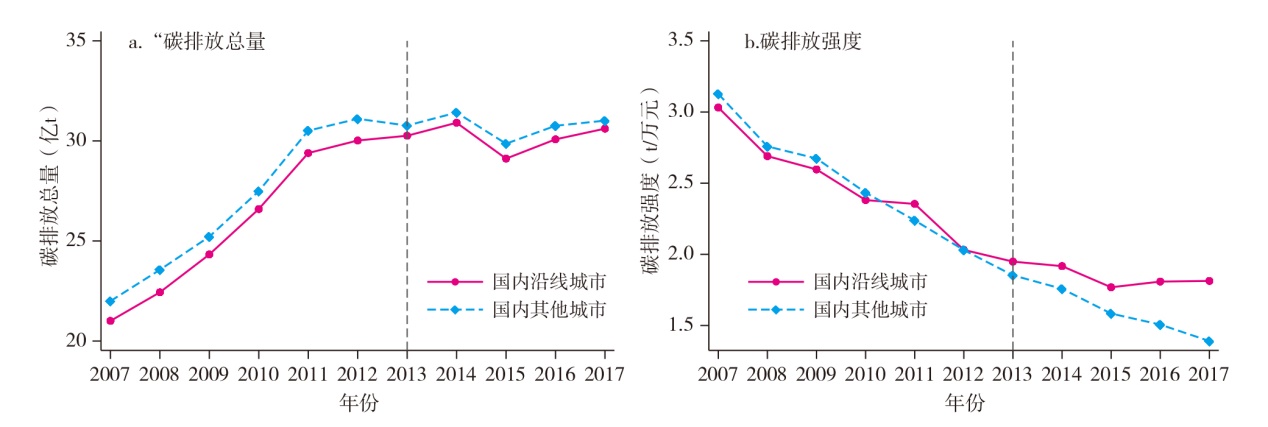
Fig.2
China’s total carbon emissions and carbon emission intensity before and after the Belt and Road Initiative
Other figure/table from this article
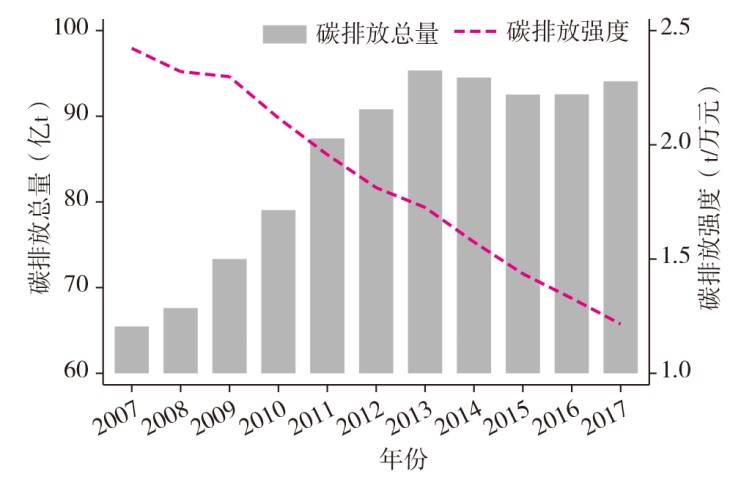
Fig.1
China's total carbon emissions and carbon emission intensity from 2007 to 2017
Tab.1
Baseline regression results of the difference-in-differences model
Tab.2
Robustness tests (excluding the effect of other policies)
Tab.3
Mechanism tests (promoting carbon-intensive exports)
Tab.4
Mechanism tests (the distortion of industrial structure)
Tab.5
Heterogeneity test results