
黄河流域城市群碳排放效率空间关联网络结构及其影响因素
|
孙燕芳(1977—),女,博士,教授,研究方向为项目投融资决策、宏观经济管理与可持续发展。E-mail:sunyanfang@upc.edu.cn |
收稿日期: 2023-12-14
修回日期: 2024-09-21
网络出版日期: 2025-08-28
基金资助
山西省高质量发展研究课题(SXGZL2025081)
山东省社会科学规划研究项目(23CGLJ52)
Spatial Correlation Network Structure of Carbon Emission Efficiency in Urban Agglomerations of the Yellow River Basin and Its Influencing Factors
Received date: 2023-12-14
Revised date: 2024-09-21
Online published: 2025-08-28
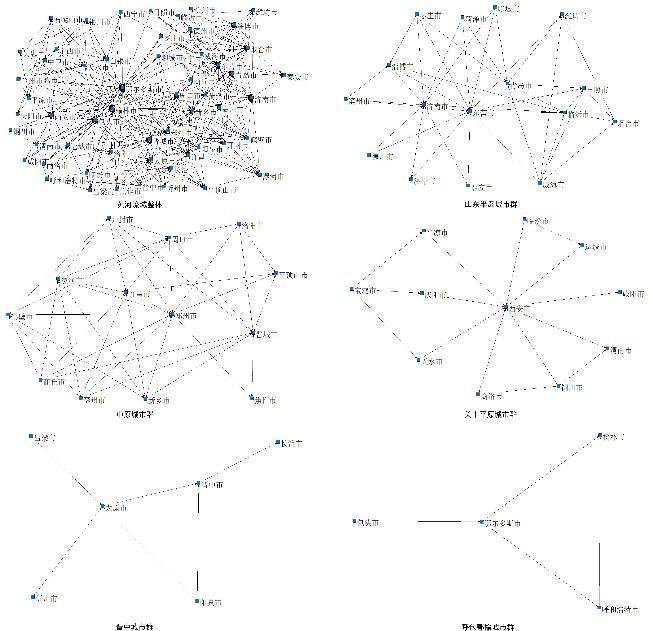
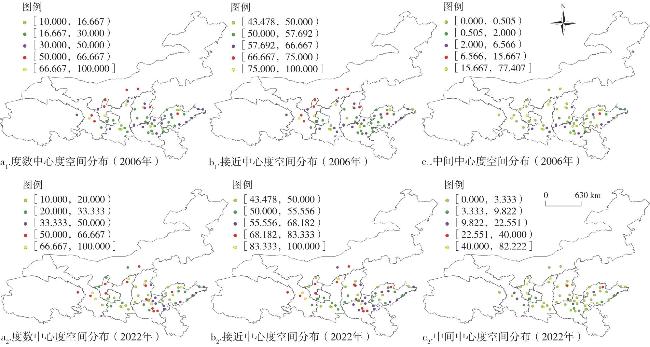
准确把握碳排放效率空间关联网络结构及其影响因素对于黄河流域城市群低碳发展具有重要意义。文章在采用三阶段超效率SBM模型测度2006—2022年黄河流域城市群碳排放效率的基础上,借助修正的引力模型构建空间关联网络,进而探究其碳排放效率的网络结构特征及其影响因素。 结果表明:①观测期内,黄河流域整体碳排放效率呈现“先上升、后下降、再上升”的变化趋势;各城市群碳排放效率存在差异,其中中原城市群碳排放效率均值最高,晋中城市群最低。②黄河流域城市群碳排放效率形成了复杂的空间关联网络,且网络可达性较强,但流域整体及各城市群网络关联关系的紧密程度有待增强。③随着时间的演进,各驱动因素对黄河流域城市群碳排放效率空间关联网络的影响方向较为稳定。地理距离差异和人口密度差异对空间关联网络的形成具有显著负向影响,经济发展差异和技术创新差异则产生显著正向影响。此外,影响黄河流域各城市群碳排放效率空间关联网络形成的因素呈现出明显的异质性。
孙燕芳 , 张园园 , 赵怡 . 黄河流域城市群碳排放效率空间关联网络结构及其影响因素[J]. 经济地理, 2025 , 45(7) : 77 -84 . DOI: 10.15957/j.cnki.jjdl.2025.07.008
It is significant to accurately grasp the spatial correlation network structure of carbon emission efficiency and its influencing factors for the low-carbon development of urban agglomerations in the Yellow River Basin. Based on the three-stage super-efficiency SBM model, this study measures carbon emission efficiency of urban agglomerations in the Yellow River Basin from 2006 to 2022. And the spatial correlation network is constructed with the modified gravity model to explore the network structure characteristics and influencing factors of carbon emission efficiency. The results show that:1) During the observation period, the overall carbon emission efficiency in the Yellow River Basin shows a trend of "rising first, then declining, and rising again". There are differences in carbon emission efficiency among urban agglomerations, with the Central Plains urban agglomeration having the highest average carbon emission efficiency, and the Jinzhong urban agglomeration having the lowest. 2) Carbon emission efficiency in the Yellow River Basin has formed a complex spatial correlation network with strong network accessibility. However, the tightness of the network correlation relationship of the whole basin and urban agglomerations needs to be enhanced. 3) Over time, the influence of various driving factors on the spatial correlation network of carbon emission efficiency in the Yellow River Basin remains relatively stable in direction. Differences in geographical distance and population density have a significant negative impact on the formation of the spatial correlation network, while differences in economic development level and technological innovation exert a significant positive impact. Additionally, the factors influencing the formation of the spatial correlation network of carbon emission efficiency among urban agglomerations in the Yellow River Basin exhibit noticeable heterogeneity.
表1 黄河流域及各城市群碳排放效率Tab.1 Carbon emission efficiency in the Yellow River Basin and urban agglomerations |
| 地区 | 2006 | 2010 | 2014 | 2018 | 2022 | 均值 |
|---|---|---|---|---|---|---|
| 黄河流域 | 0.704 | 0.733 | 0.749 | 0.711 | 0.737 | 0.732 |
| 山东半岛城市群 | 0.648 | 0.724 | 0.773 | 0.755 | 0.832 | 0.751 |
| 中原城市群 | 0.701 | 0.748 | 0.796 | 0.758 | 0.782 | 0.765 |
| 关中平原城市群 | 0.745 | 0.749 | 0.760 | 0.707 | 0.717 | 0.739 |
| 晋中城市群 | 0.656 | 0.665 | 0.665 | 0.596 | 0.604 | 0.642 |
| 呼包鄂榆城市群 | 0.665 | 0.697 | 0.705 | 0.627 | 0.618 | 0.687 |
| 宁夏沿黄城市群 | 0.902 | 0.781 | 0.678 | 0.657 | 0.626 | 0.727 |
| 兰西城市群 | 0.737 | 0.759 | 0.714 | 0.696 | 0.694 | 0.719 |
表2 空间关联网络整体结构特征Tab.2 Overall structure characteristics of spatial correlation network |
| 地区 | 2006 | 2014 | 2022 | |||||
|---|---|---|---|---|---|---|---|---|
| 网络 密度 | 网络 关联度 | 网络 密度 | 网络 关联度 | 网络 密度 | 网络 关联度 | |||
| 黄河流域 | 0.1760 | 1.0000 | 0.1715 | 1.0000 | 0.1697 | 1.0000 | ||
| 山东半岛城市群 | 0.2333 | 1.0000 | 0.2375 | 1.0000 | 0.2167 | 1.0000 | ||
| 中原城市群 | 0.2179 | 1.0000 | 0.2692 | 1.0000 | 0.3462 | 1.0000 | ||
| 关中平原城市群 | 0.2455 | 1.0000 | 0.6727 | 1.0000 | 0.2182 | 1.0000 | ||
| 晋中城市群 | 0.3000 | 1.0000 | 0.3333 | 1.0000 | 0.3000 | 1.0000 | ||
| 呼包鄂榆城市群 | 0.4167 | 1.0000 | 0.5833 | 1.0000 | 0.5833 | 1.0000 | ||
| 宁夏沿黄城市群 | 0.5833 | 1.0000 | 0.5000 | 1.0000 | 0.5000 | 1.0000 | ||
| 兰西城市群 | 0.5833 | 1.0000 | 0.5833 | 1.0000 | 0.5833 | 1.0000 | ||
表3 黄河流域QAP回归分析结果Tab.3 Results of QAP regression analysis in the Yellow River Basin |
| 变量 | 标准化回归系数 | ||
|---|---|---|---|
| 2006 | 2014 | 2022 | |
| 地理距离差异 | -0.4016*** | -0.4004*** | -0.3960*** |
| 经济发展差异 | 0.4548*** | 0.4322*** | 0.4234*** |
| 人口密度差异 | -0.0813*** | -0.0624*** | -0.0627*** |
| 对外贸易差异 | -0.0292 | -0.0019 | -0.0267 |
| 技术创新差异 | 0.0566** | 0.0760** | 0.0618** |
注:***、**和*分别表示在1%、5%、10%的统计水平上显著。表4同。 |
表4 城市群QAP回归分析结果Tab.4 Results of QAP regression analysis in urban agglomerations |
| 变量 | 标准化回归系数 | ||||||
|---|---|---|---|---|---|---|---|
| 山东半岛城市群 | 中原城市群 | 关中平原城市群 | 晋中城市群 | 呼包鄂榆城市群 | 宁夏沿黄城市群 | 兰西城市群 | |
| 地理距离差异 | -0.4057** | -0.4780*** | -0.4162*** | -0.2742** | -1.7122** | -0.1634 | -0.4170** |
| 经济发展差异 | 0.6351*** | 0.6396*** | 0.3036*** | 0.5562** | 2.3721** | -1.6270 | 0.2990** |
| 人口密度差异 | -0.0762 | -0.1139** | -0.4243** | -0.4675 | -0.4556 | 4.9573 | 0.4104* |
| 对外贸易差异 | -0.0348** | 0.0189 | 0.0119 | -0.0240 | 0.0001 | 0.0024 | -0.0001 |
| 技术创新差异 | 0.0131 | -0.0068 | 0.6577 | 0.4908 | 0.5989** | -4.3826 | 0.0871** |
| [1] |
马海涛, 徐楦钫. 黄河流域城市群高质量发展评估与空间格局分异[J]. 经济地理, 2020, 40(4):11-18.
|
| [2] |
陆大道, 孙东琪. 黄河流域的综合治理与可持续发展[J]. 地理学报, 2019, 74(12):2431-2436.
|
| [3] |
刘传明, 马青山. 黄河流域高质量发展的空间关联网络及驱动因素[J]. 经济地理, 2020, 40(10):91-99.
|
| [4] |
邵海琴, 王兆峰. 中国交通碳排放效率的空间关联网络结构及其影响因素[J]. 中国人口·资源与环境, 2021, 31(4):32-41.
|
| [5] |
李治国, 孔维嘉, 张硕, 等. 中心集聚还是边缘扩散:数字经济对黄河流域城市群生产要素布局的影响[J]. 中国石油大学学报(社会科学版), 2025, 41(2):94-104.
|
| [6] |
|
| [7] |
|
| [8] |
|
| [9] |
李根忠, 朱洪亮. 基于三阶段SM-DEA-Malmquist指数的长江经济带碳排放效率研究[J]. 运筹与管理, 2022, 31(6):161-167.
|
| [10] |
王少剑, 高爽, 黄永源, 等. 基于超效率SBM模型的中国城市碳排放绩效时空演变格局及预测[J]. 地理学报, 2020, 75(6):1316-1330.
|
| [11] |
蔺雪芹, 边宇, 王岱. 京津冀地区工业碳排放效率时空演化特征及影响因素[J]. 经济地理, 2021, 41(6):187-195.
|
| [12] |
|
| [13] |
|
| [14] |
|
| [15] |
王凯, 何静, 甘畅, 等. 中国旅游产业结构变迁对旅游业碳排放效率的空间溢出效应研究[J]. 中国软科学, 2022(12):50-60.
|
| [16] |
王香艳, 李金叶. 数字经济是否有效促进了节能和碳减排?[J]. 中国人口·资源与环境, 2022, 32(11):83-95.
|
| [17] |
苏振, 郑应宏, 郭峦. 数字经济对旅游业碳排放效率的影响及门槛效应[J]. 中国人口·资源与环境, 2023, 33(8):69-79.
|
| [18] |
|
| [19] |
张明志, 王新培, 郇馥莹. 生产性服务业集聚与黄河流域减碳增效:基于碳排放效率的核算分析视角[J]. 软科学, 2023, 37(12):65-72.
|
| [20] |
宋敏, 邹素娟. 黄河流域碳排放效率的区域差异、收敛性及影响因素[J]. 人民黄河, 2022, 44(8):6-12,56.
|
| [21] |
王兆峰, 黄冬春. 长江经济带与黄河流域交通碳排放效率的比较及其影响因素[J/OL]. 经济地理:1-15[2023-10-13]. http://kns.cnki.net/kcms/detail/43.1126.K.20230831.1703.002.html.
|
| [22] |
蒋培培, 王远, 罗进, 等. 长江与黄河流域碳排放效率时空演变特征及路径识别探究[J]. 环境科学研究, 2022, 35(7):1743-1751.
|
| [23] |
王新平, 沈颖双, 苏畅. 黄河流域城市碳排放效率时空分异及其溢出效应研究[J]. 生态经济, 2023, 39(4):26-34.
|
| [24] |
彭文斌, 曹笑天, 苏昌贵, 等. 长江中游城市群碳效率时空演化特征——基于三阶段SBM-DEA模型[J]. 生态学报, 2023, 43(9):3532-3545.
|
| [25] |
李爱, 王雅楠, 李梦, 等. 碳排放的空间关联网络结构特征与影响因素研究:以中国三大城市群为例[J]. 环境科学与技术, 2021, 44(6):186-193.
|
| [26] |
尚杰, 吉雪强, 石锐, 等. 中国农业碳排放效率空间关联网络结构及驱动因素研究[J]. 中国生态农业学报(中英文), 2022, 30(4):543-557.
|
| [27] |
王凯, 张淑文, 甘畅, 等. 中国旅游业碳排放效率的空间网络结构及其效应研究[J]. 地理科学, 2020, 40(3):344-353.
|
| [28] |
李金铠, 马静静, 魏伟. 中国八大综合经济区能源碳排放效率的区域差异研究[J]. 数量经济技术经济研究, 2020, 37(6):109-129.
|
| [29] |
陈晓红, 易国栋, 刘翔. 基于三阶段SBM-DEA模型的中国区域碳排放效率研究[J]. 运筹与管理, 2017, 26(3):115-122.
|
| [30] |
田野, 罗静, 孙建伟, 等. 武汉城市圈内部空间联系及其轴—辐网络结构演化[J]. 地理科学进展, 2019, 38(7):1093-1102.
|
| [31] |
李梦程, 王成新, 刘海猛, 等. 黄河流域城市发展质量评价与空间联系网络特征[J]. 经济地理, 2021, 41(12):84-93.
|
| [32] |
海小辉, 湛星星, 王许. “双碳”目标背景下省域碳排放空间关联网络特征研究[J]. 统计与决策, 2024, 40(17):85-89.
|
| [33] |
吉雪强, 刘慧敏, 张跃松. 中国省际土地利用碳排放空间关联网络结构演化及驱动因素[J]. 经济地理, 2023, 43(2):190-200.
|
| [34] |
郑航, 叶阿忠. 城市群碳排放空间关联网络结构及其影响因素[J]. 中国环境科学, 2022, 42(5):2413-2422.
|
/
| 〈 |
|
〉 |