
中国绿色经济发展对工业产能利用率的提升效用
|
肖青竹(1991—),女,博士,研究方向为绿色经济发展与产业经济。E-mail:A414319@126.com |
收稿日期: 2024-05-14
修回日期: 2025-01-18
网络出版日期: 2025-08-28
基金资助
国家社会科学基金重大项目(19ZDA099)
Enhancing Industrial Capacity Utilization through Green Economic Development in China: Evidence from a Spatial Panel Model
Received date: 2024-05-14
Revised date: 2025-01-18
Online published: 2025-08-28
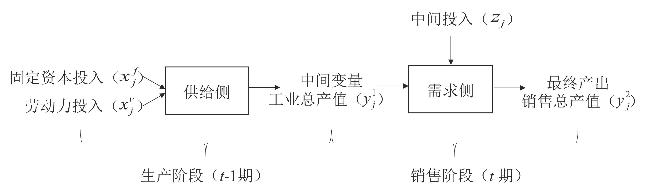
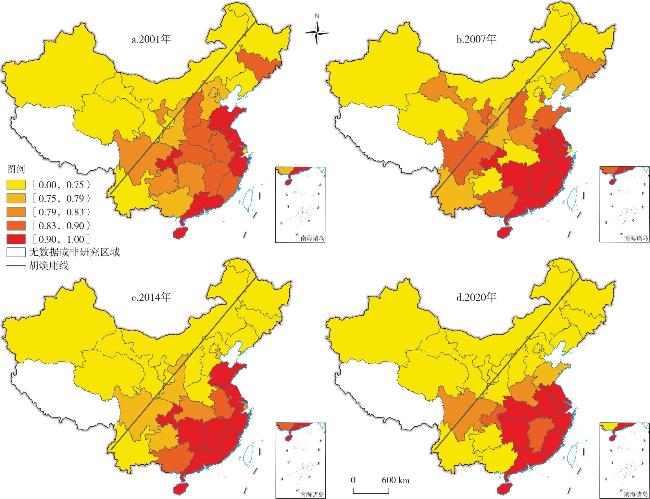
文章在明晰发展绿色经济必要性的基础上,首先运用非期望产出的SBM模型衡量绿色经济发展,采用复合网络DEA模型衡量工业产能利用率并进行供给侧与需求侧的分解;然后,运用基于邻接矩阵、逆距离矩阵与经济地理嵌套矩阵的空间面板模型评价绿色经济发展对工业产能利用率的空间效应,并通过供给侧与需求侧进行机制分析;最后,分东部、中部和西部地区进行了区域异质性讨论。研究发现:①绿色经济发展能够通过集聚效应提升本地区工业产能利用率,通过扩散效应提升邻近地区工业产能利用率,有利于突破“胡焕庸线”对经济地理格局的束缚。②绿色经济发展对工业产能利用率的促进作用在供给侧主要表现为直接效应,在需求侧主要表现为溢出效应。③区域经济发展呈现显著的非均衡态势,而绿色经济有助于促进区域协调发展。
肖青竹 , 王立国 . 中国绿色经济发展对工业产能利用率的提升效用[J]. 经济地理, 2025 , 45(7) : 23 -34 . DOI: 10.15957/j.cnki.jjdl.2025.07.003
Establishing the imperative for green economic development, this study first quantifies green economic performance using a non-radial SBM model incorporating undesirable outputs. Concurrently,industrial capacity utilization is measured via a composite network DEA model, with decomposition into supply-side and demand-side components. Thereafter, employing spatial panel methodologies grounded in adjacency, inverse distance, and nested economic-geographic weight matrices, evaluated are the spatial spillover effects of green economic advancement upon industrial capacity utilization. Mechanism analysis is conducted through both supply-side and demand-side channels. Finally, regional heterogeneity is examined through separate analyses of eastern, central, and western China. The empirical results indicate: 1) Green economic development not only elevates local industrial capacity utilization via agglomeration effects, but also enhances utilization in neighboring regions through diffusion effects, thereby mitigating the constraining influence of the "Hu Huanyong Line" on economic geography. 2) The promotion effect of green economy development on industrial capacity utilization is mainly manifested as direct effects on the supply-side and spillover effects on the demand-side. 3) Despite significant regional economic disparities, green economic development contributes to fostering greater regional coordination.
表1 不同化石能源的CO2排放系数Tab.1 CO₂ emission factors by fossil fuel type |
| 能源类别 | 系数 | 能源类别 | 系数 | |
|---|---|---|---|---|
| 煤炭 | 2.0189 | 煤油 | 3.1505 | |
| 焦炭 | 3.0193 | 柴油 | 3.1849 | |
| 原油 | 3.1020 | 燃料油 | 3.1256 | |
| 汽油 | 3.0862 | 天然气 | 2.1004 |
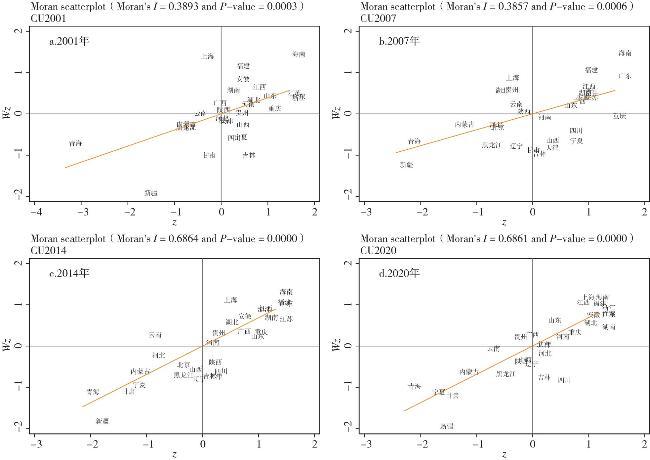
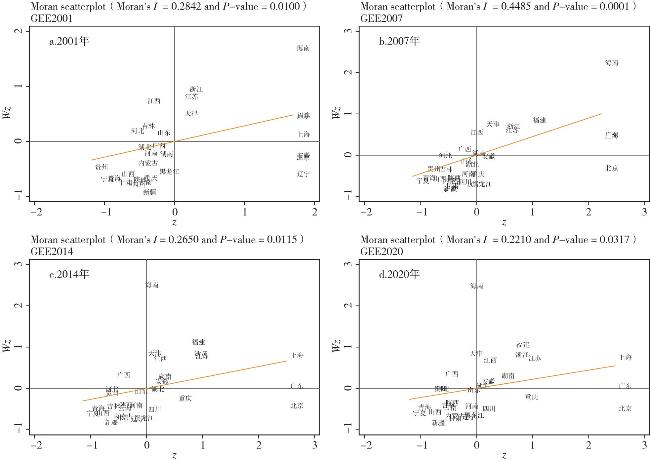
表2 2001—2020年中国工业产能利用率与绿色经济效率的全局Moran's I指数Tab.2 Global Moran's I index of industrial capacity utilization and green economic efficiency, 2001-2020 |
| 年份 | CU | GEE |
|---|---|---|
| 2001 | 0.389***(3.655) | 0.284***(2.575) |
| 2002 | 0.524***(4.719) | 0.454***(4.026) |
| 2003 | 0.553***(4.970) | 0.462***(4.116) |
| 2004 | 0.472***(4.243) | 0.470***(4.176) |
| 2005 | 0.512***(4.561) | 0.458***(4.091) |
| 2006 | 0.426***(3.829) | 0.458***(4.088) |
| 2007 | 0.386***(3.444) | 0.449***(4.018) |
| 2008 | 0.395***(3.559) | 0.346***(3.213) |
| 2009 | 0.403***(3.546) | 0.321***(3.009) |
| 2010 | 0.539***(4.648) | 0.305***(2.876) |
| 2011 | 0.622***(5.387) | 0.251***(2.439) |
| 2012 | 0.637***(5.474) | 0.279***(2.656) |
| 2013 | 0.658***(5.611) | 0.254***(2.434) |
| 2014 | 0.686***(5.826) | 0.265***(2.526) |
| 2015 | 0.685***(5.783) | 0.269***(2.544) |
| 2016 | 0.670***(5.670) | 0.285***(2.661) |
| 2017 | 0.705***(6.001) | 0.273***(2.561) |
| 2018 | 0.687***(5.895) | 0.249***(2.376) |
| 2019 | 0.658***(5.633) | 0.246***(2.348) |
| 2020 | 0.686***(5.846) | 0.221**(2.148) |
注:括号内为z值;*、**、***分别表示在10%、5%、1%水平上显著。表3同。 |
图3 不同年份中国各省份工业产能利用率的局部Moran's I散点图Fig.3 Local Moran's I scatter plots of industrial capacity utilization across Chinese provinces in selected years |
表3 空间面板模型的估计结果Tab.3 The estimation results of the spatial panel model |
| 解释变量 | (1) CU(SDM)基于W1 | (2) CU(SAR)基于W1 | (3) CU(SDM)基于W2 | (4) CU(SAR)基于W2 | (5) CU(SDM)基于W3 | (6) CU(SAR)基于W3 |
|---|---|---|---|---|---|---|
| GEE | 0.230***(0.040) | 0.248***(0.039) | 0.375***(0.042) | 0.429***(0.042) | 0.368***(0.042) | 0.433***(0.043) |
| Ind | 0.658***(0.052) | 0.474***(0.051) | 0.461***(0.058) | 0.435***(0.059) | 0.498***(0.057) | 0.475***(0.060) |
| Open | -0.112***(0.021) | -0.064***(0.022) | -0.155***(0.026) | -0.090***(0.025) | -0.146***(0.026) | -0.089***(0.026) |
| Mar | -0.047(0.042) | -0.087***(0.044) | -0.084*(0.048) | -0.092*(0.051) | -0.069(0.047) | -0.079(0.052) |
| Con | 0.288***(0.085) | 0.310***(0.096) | 0.341***(0.104) | 0.449***(0.110) | 0.352***(0.103) | 0.454***(0.113) |
| Rd | 2.790***(0.434) | 0.372(0.410) | 1.031**(0.499) | -1.003**(0.460) | 1.585***(0.500) | -0.993**(0.474) |
| W·GEE | 0.976***(0.071) | 1.158***(0.103) | 1.228***(0.103) | |||
| W·Ind | 0.524***(0.110) | 0.263*(0.153) | 0.541***(0.164) | |||
| W·Open | -0.367***(0.041) | -0.226***(0.058) | -0.285***(0.052) | |||
| W·Mar | -0.204***(0.075) | -0.318***(0.112) | -0.239**(0.099) | |||
| W·Con | 0.285*(0.156) | 0.168(0.233) | 0.157(0.264) | |||
| W·Rd | 1.938**(0.843) | -2.119*(1.134) | -1.875*(0.985) | |||
| 0.283***(0.047) | 0.645***(0.034) | 0.275***(0.064) | 0.559***(0.051) | 0.199***(0.068) | 0.536***(0.054) |
表4 空间杜宾模型的直接效应、间接效应和总效应Tab.4 The direct effect, indirect effect, and total effect of the spatial durbin model |
| 效应变量 | (7) 直接效应 | (8) 间接效应 | (9) 总效应 | (10) 直接效应 | (11) 间接效应 | (12) 总效应 | (13) 直接效应 | (14) 间接效应 | (15) 总效应 |
|---|---|---|---|---|---|---|---|---|---|
| GEE | 0.308*** (0.039) | 1.372*** (0.086) | 1.680*** (0.098) | 0.440*** (0.042) | 1.672*** (0.166) | 2.112*** (0.176) | 0.413*** (0.041) | 1.578*** (0.151) | 1.991*** (0.160) |
| Ind | 0.708*** (0.050) | 0.934*** (0.142) | 1.642*** (0.160) | 0.478*** (0.056) | 0.514*** (0.198) | 0.992*** (0.214) | 0.517*** (0.057) | 0.771*** (0.198) | 1.287*** (0.216) |
| Open | -0.140*** (0.021) | -0.524*** (0.055) | -0.664*** (0.062) | -0.166*** (0.026) | -0.354*** (0.079) | -0.521*** (0.084) | -0.155*** (0.025) | -0.379*** (0.066) | -0.533*** (0.072) |
| Mar | -0.065 (0.040) | -0.286*** (0.098) | -0.352*** (0.107) | -0.104** (0.047) | -0.453*** (0.161) | -0.557*** (0.176) | -0.081* (0.045) | -0.306** (0.127) | -0.387*** (0.137) |
| Con | 0.316*** (0.084) | 0.476** (0.192) | 0.793*** (0.222) | 0.356*** (0.103) | 0.337 (0.302) | 0.692** (0.338) | 0.361*** (0.101) | 0.261 (0.307) | 0.623* (0.335) |
| Rd | 2.987*** (0.417) | 3.623*** (1.161) | 6.610*** (1.239) | 0.938** (0.474) | -2.414* (1.419) | -1.477 (1.435) | 1.531*** (0.480) | -1.895* (1.126) | -0.364 (1.138) |
| 权重矩阵 | 邻接矩阵 | 逆距离矩阵 | 经济地理嵌套矩阵 | ||||||
| 0.283***(0.047) | 0.275***(0.064) | 0.199***(0.068) | |||||||
表5 稳健性检验结果Tab.5 The results of robustness tests |
| 模型 | 缩尾处理 | 剔除直辖市 | 2001—2007年 | 2008—2020年 | |||||||||||
|---|---|---|---|---|---|---|---|---|---|---|---|---|---|---|---|
| (1) | (2) | (3) | (4) | (5) | (6) | (7) | (8) | (9) | (10) | (11) | (12) | ||||
| 直接效应 | 0.300*** (0.039) | 0.433*** (0.042) | 0.407*** (0.041) | 0.270*** (0.049) | 0.283*** (0.048) | 0.243*** (0.047) | 0.143* (0.076) | 0.310*** (0.066) | 0.254*** (0.068) | 0.314*** (0.051) | 0.567*** (0.063) | 0.522*** (0.061) | |||
| 间接效应 | 1.361*** (0.087) | 1.623*** (0.162) | 1.545*** (0.149) | 1.136*** (0.108) | 1.210*** (0.151) | 1.218*** (0.127) | 0.976*** (0.160) | 0.659*** (0.137) | 0.619*** (0.135) | 1.560*** (0.105) | 2.637*** (0.308) | 2.348*** (0.246) | |||
| 总效应 | 1.662*** (0.099) | 2.056*** (0.173) | 1.952*** (0.158) | 1.406*** (0.132) | 1.493*** (0.168) | 1.461*** (0.143) | 1.120*** (0.193) | 0.969*** (0.145) | 0.872*** (0.143) | 1.874*** (0.107) | 3.203*** (0.325) | 2.870*** (0.257) | |||
表6 供给侧与需求侧产能利用率的机制检验结果Tab.6 Results of the mechanism test on supply-side and demand-side capacity utilization |
| 模型 | (1)CUs | (2)CUs | (3)CUs | (4)CUd | (5)CUd | (6)CUd |
|---|---|---|---|---|---|---|
| 空间回归 | 0.241***(0.085) | 0.221***(0.085) | 0.222***(0.085) | 0.366***(0.109) | 0.337***(0.110) | 0.342***(0.109) |
| 直接效应 | 0.246***(0.088) | 0.224**(0.087) | 0.226***(0.087) | 0.374***(0.113) | 0.343***(0.113) | 0.349***(0.113) |
| 间接效应 | 0.033(0.023) | 0.004(0.017) | 0.009(0.019) | 0.094**(0.044) | 0.070*(0.040) | 0.089*(0.046) |
| 总效应 | 0.279***(0.104) | 0.228**(0.091) | 0.234***(0.094) | 0.469***(0.148) | 0.413***(0.141) | 0.438***(0.148) |
表7 东部、中部和西部地区的空间面板模型估计结果Tab.7 Estimation results of the spatial panel model for eastern, central, and western regions |
| 模型 | 东部地区 | 中部地区 | 西部地区 | ||||||||
|---|---|---|---|---|---|---|---|---|---|---|---|
| (1) | (2) | (3) | (4) | (5) | (6) | (7) | (8) | (9) | |||
| 直接效应 | 0.250*** (0.045) | 0.326*** (0.046) | 0.328*** (0.045) | 0.399*** (0.092) | 0.580*** (0.094) | 0.600*** (0.097) | 0.509*** (0.155) | 0.382** (0.162) | 0.379** (0.162) | ||
| 间接效应 | 0.079*** (0.024) | 0.007 (0.033) | 0.005 (0.032) | 0.213*** (0.056) | 0.114* (0.064) | 0.077 (0.061) | 0.371** (0.152) | 0.246** (0.124) | 0.240** (0.121) | ||
| 总效应 | 0.329*** (0.055) | 0.334*** (0.045) | 0.333*** (0.045) | 0.613*** (0.130) | 0.695*** (0.106) | 0.677*** (0.099) | 0.880*** (0.288) | 0.627** (0.269) | 0.619** (0.268) | ||
| [1] |
刘帅, 杨丹辉, 金殿臣. 环境规制对产能利用率的影响——基于技术创新中介调节效应的分析[J]. 改革, 2021, 37(8):77-89.
|
| [2] |
韦朕韬, 张腾, 陶善信. 绿色信贷、地方官员特征与我国工业产能过剩[J]. 财经论丛, 2023, 36(2):102-112.
|
| [3] |
|
| [4] |
|
| [5] |
马红旗, 申广军. 规模扩张、“创造性破坏”与产能过剩——基于钢铁企业微观数据的实证分析[J]. 经济学(季刊), 2021, 21(1):71-92.
|
| [6] |
刘满凤, 刘熙, 徐野, 等. 资源错配、政府干预与新兴产业产能过剩[J]. 经济地理, 2019, 39(8):126-136.
|
| [7] |
涂正革, 邓辉, 谌仁俊, 等. 中央环保督察的环境经济效益:来自河北省试点的证据[J]. 经济评论, 2020, 31(1):3-16.
|
| [8] |
林毅夫, 巫和懋, 邢亦青. “潮涌现象”与产能过剩的形成机制[J]. 经济研究, 2010, 45(10):4-19.
|
| [9] |
邵帅. 环境规制的区域产能调节效应——基于空间计量和门槛回归的双检验[J]. 现代经济探讨, 2019, 26(1):86-95.
|
| [10] |
|
| [11] |
|
| [12] |
孙博文, 尹俊. 损己不利人:僵尸企业对绿色全要素生产率的负面影响[J]. 中国人口·资源与环境, 2023, 33(2):38-50.
|
| [13] |
|
| [14] |
|
| [15] |
|
| [16] |
|
| [17] |
|
| [18] |
宋培, 陈喆, 宋典. 绿色技术创新能否推动中国制造业GVC攀升?——基于WIOD数据的实证检验[J]. 财经论丛, 2021, 34(5):3-13.
|
| [19] |
|
| [20] |
|
| [21] |
杨振兵, 张诚. 产能过剩与环境治理双赢的动力机制研究——基于生产侧与消费侧的产能利用率分解[J]. 当代经济科学, 2015, 37(6):42-52,123-124.
|
| [22] |
曹秋菊, 唐新明. 我国工业产能过剩的区域差异及成因分析[J]. 经济地理, 2021, 41(12):132-141.
|
| [23] |
|
| [24] |
|
| [25] |
|
| [26] |
张军, 吴桂英, 张吉鹏. 中国省际物质资本存量估算:1952—2000[J]. 经济研究, 2004, 39(10):35-44.
|
| [27] |
单豪杰. 中国资本存量K的再估算:1952-2006年[J]. 数量经济技术经济研究, 2008, 25(10):17-31.
|
| [28] |
赵领娣, 张磊, 徐乐, 等. 人力资本、产业结构调整与绿色发展效率的作用机制[J]. 中国人口·资源与环境, 2016, 26(11):106-114.
|
| [29] |
|
| [30] |
IPCC. 2006 IPCC guidelines for national greenhouse gas inventories[M/OL]. Japan:IGES, 2006.
|
| [31] |
|
| [32] |
于斌斌, 陈露. 新型城镇化能化解产能过剩吗?[J]. 数量经济技术经济研究, 2019, 36(1):22-41.
|
| [33] |
李稻葵, 厉克奥博, 陈大鹏, 等. 走出疫情稳字当头——2021年中国宏观经济形势分析与2022年发展预测[J]. 改革, 2022, 38(1):28-42.
|
| [34] |
|
/
| 〈 |
|
〉 |