
中国市域工业绿色发展的测度、区域差异及其影响因素
|
安琪(1999—),女,博士研究生,研究方向为区域经济、资源环境经济。E-mail:aq199919@qq.com |
收稿日期: 2024-12-25
修回日期: 2025-03-21
网络出版日期: 2025-08-28
基金资助
国家自然科学基金面上项目(72373136)
国家自然科学基金面上项目(71773118)
深地国家科技重大专项课题(2024ZD1002001)
国家自然科学基金重点项目(71733003)
中国地质大学(北京)研究生创新实践项目(CX2025YC002)
Measurement, Regional Differences and Influencing Factors of Industrial Green Development in Chinese Cities
Received date: 2024-12-25
Revised date: 2025-03-21
Online published: 2025-08-28
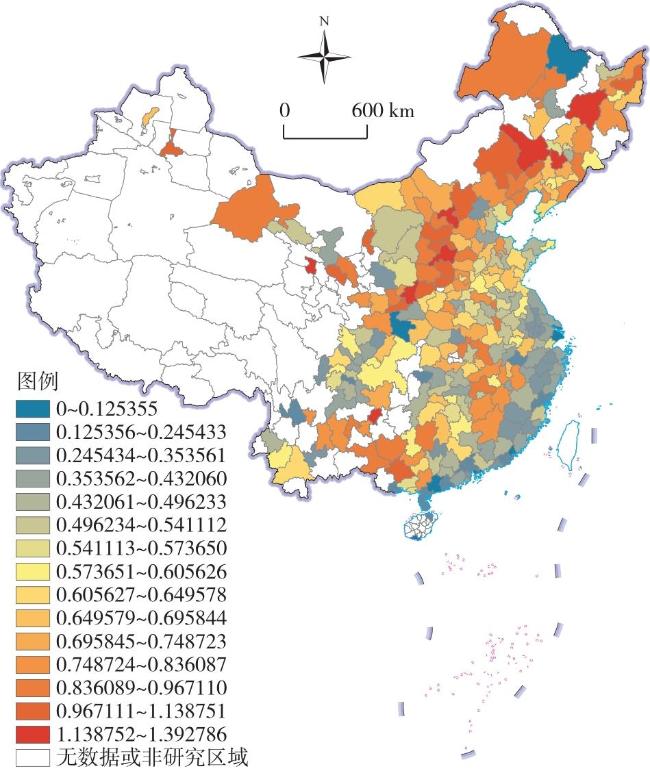
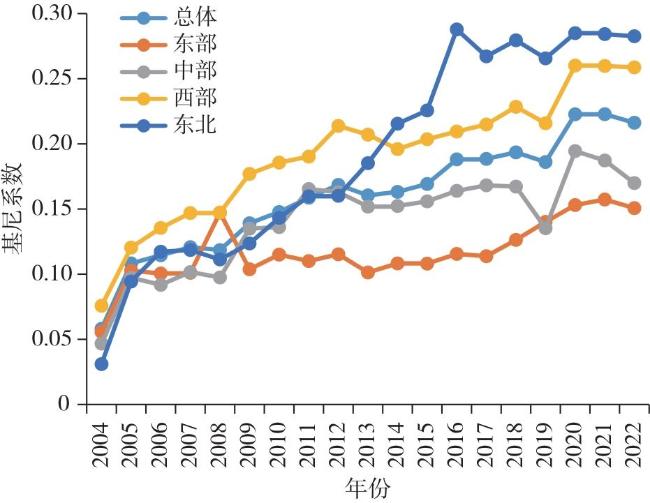
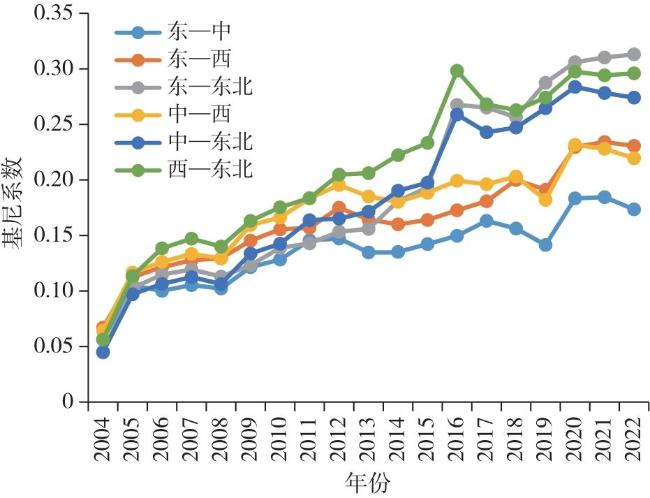
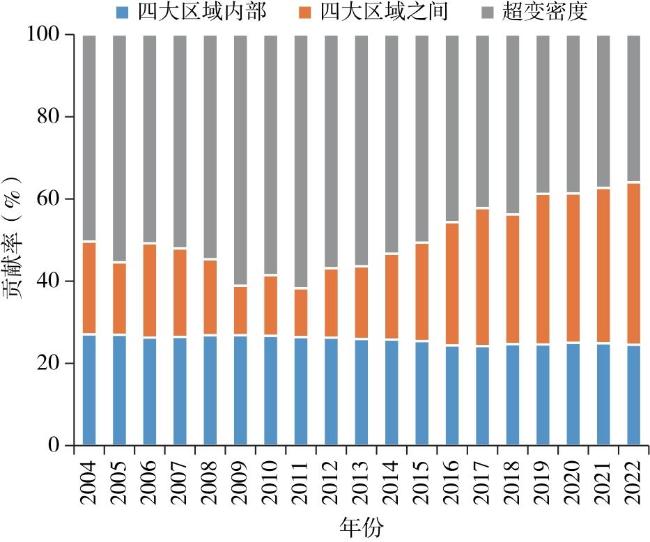
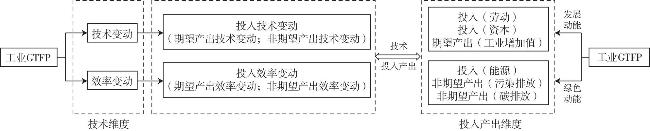
文章以中国272个市域为研究对象,使用两期非径向方向距离函数及卢恩伯格生产率指数测度了市域工业绿色全要素生产率水平,并在此基础上探讨了其区域差异及影响因素。 结果表明:①中国市域工业绿色效率总体呈现“东高西低、南高北低”的格局,非均衡特征显著。②中国市域工业绿色全要素生产率总体差异的主要来源是超变密度,其次是地区内差异,地区间差异的贡献率较低但逐步加强。③技术进步、绿色动能促进工业绿色全要素生产率增长,而效率恶化、发展动能阻碍中西部和东北地区工业绿色全要素生产率增长。从技术和投入产出维度结合来看,技术进步既源于发展技术进步也源于绿色技术进步,效率恶化主要由发展效率恶化导致,且工业绿色全要素生产率区域差异更多来源于发展效率差距。据此,应重视工业绿色发展长期存在的空间非均衡特征,因地制宜实施差别化的工业绿色发展策略,以缩小发展效率差距为重点协同提升市域工业绿色发展水平。
安琪 , 吴三忙 . 中国市域工业绿色发展的测度、区域差异及其影响因素[J]. 经济地理, 2025 , 45(7) : 13 -22 . DOI: 10.15957/j.cnki.jjdl.2025.07.002
Taking 272 prefecture-level and above cities in China as the research unit, we use two-period non-radial directional distance function and Luenberger index to measure urban industrial green total factor productivity(GTFP), so as to measure the level of urban industrial green development and to further explore the regional differences and influencing factors. We find that the industrial green efficiency at the municipal level in China generally shows a pattern of "high in the east, low in the west, high in the south and low in the north", with significant imbalance characteristics. The main source of overall differences in industrial GTFP at the municipal level in China is hypervariable density, followed by the intra-regional difference, with a lower but gradually increasing contribution from the inter-regional difference. Technological progress and green momentum promote industrial GTFP growth, while efficiency deterioration and development momentum hinder industrial GTFP growth in the central, western and northeastern regions. From the combined perspective of technology and input-output dimensions, technological progress stems from both developmental and green technology progress, and efficiency deterioration is mainly caused by developmental efficiency deterioration. Regional differences in industrial GTFP stem more from the developmental efficiency difference. Accordingly, the government should pay attention to the long-term spatial imbalance in industrial green development, implement differentiated industrial green development strategies according to local conditions, and narrow the development efficiency gap in order to synergistically enhance the level of industrial green development at the municipal level.
表1 2003—2022年中国工业绿色无效率均值最高和最低的20位市域Tab.1 Cities ranked top 20 and bottom 20 in industrial green inefficiency from 2003 to 2022 |
| 类型 | 市域名称 |
|---|---|
| 最低20位市域 | 三亚、茂名、深圳、上海、潮州、黑河、安康、揭阳、佛山、海口、阳江、东莞、自贡、张家界、宁德、黄山、丽江、广州、防城港、汕头 |
| 最高20位市域 | 大同、哈尔滨、贵阳、通辽、西宁、铁岭、渭南、晋中、运城、忻州、石嘴山、银川、阳泉、西安、双鸭山、长治、南宁、乌鲁木齐、兰州、张家口 |
表2 2004—2022年中国市域总体及四大区域工业GTFP变动Tab.2 Changes in industrial GTFP at the municipal level in China and each region from 2004 to 2022 |
| 年份 | 全国 | 东部 | 中部 | 西部 | 东北 |
|---|---|---|---|---|---|
| 2004 | -0.0420 | -0.0138 | -0.0664 | -0.0593 | -0.0158 |
| 2006 | 0.0211 | 0.0055 | 0.0244 | 0.0509 | -0.0160 |
| 2008 | 0.0345 | 0.0178 | 0.0460 | 0.0323 | 0.0562 |
| 2010 | 0.0039 | 0.0231 | -0.0157 | 0.0032 | 0.0028 |
| 2012 | 0.0202 | 0.0322 | 0.0168 | 0.0301 | -0.0285 |
| 2014 | -0.0010 | -0.0138 | 0.0086 | 0.0380 | -0.0844 |
| 2016 | 0.0140 | 0.0223 | 0.0162 | 0.0503 | -0.1025 |
| 2018 | 0.0187 | 0.0033 | 0.0656 | -0.0386 | 0.0787 |
| 2019 | 0.0441 | 0.0134 | 0.0784 | 0.0652 | -0.0104 |
| 2020 | -0.1649 | -0.1238 | -0.1938 | -0.1933 | -0.1356 |
| 2021 | 0.0098 | 0.0213 | 0.0038 | -0.0035 | 0.0255 |
| 2022 | 0.0795 | 0.0803 | 0.0857 | 0.0733 | 0.0763 |
| 年均增长率 | -0.0003 | 0.0061 | -0.0004 | -0.0024 | -0.0122 |
注:表中每个年份的值均代表与上一年相比工业GTFP的变动,结果均保留4位小数。表3同。 |
表3 2004—2022年中国及四大区域工业GTFP来源分解Tab.3 Decomposition of sources of industrial GTFP at the national level and across China's four major regions from 2004 to 2022 |
| 区域 | 技术维度 | 投入产出维度 | 双重维度 | |||||||
|---|---|---|---|---|---|---|---|---|---|---|
| EC | TC | DC | GC | DEC | GEC | DTC | GTC | |||
| 全国 | -0.0039 | 0.0037 | -0.0044 | 0.0041 | -0.0056 | 0.0016 | 0.0012 | 0.0025 | ||
| 东部 | 0.0015 | 0.0045 | 0.0031 | 0.0029 | 0.0020 | -0.0005 | 0.0011 | 0.0034 | ||
| 中部 | -0.0037 | 0.0032 | -0.0065 | 0.0061 | -0.0077 | 0.0041 | 0.0013 | 0.0020 | ||
| 西部 | -0.0058 | 0.0034 | -0.0058 | 0.0034 | -0.0074 | 0.0016 | 0.0016 | 0.0019 | ||
| 东北 | -0.0152 | 0.0030 | -0.0163 | 0.0041 | -0.0167 | 0.0015 | 0.0004 | 0.0026 | ||
| [1] |
刘强, 李绍荣. 提升城市工业绿色全要素生产率的碳交易试点政策探索[J]. 北京社会科学, 2025(2):91-104.
|
| [2] |
郭克莎, 田潇潇. 加快我国工业发展方式绿色转型:成效、挑战与路径[J]. 经济纵横, 2023(1):8-16.
|
| [3] |
杨仁发, 李娜娜. 环境规制与中国工业绿色发展:理论分析与经验证据[J]. 中国地质大学学报(社会科学版), 2019, 19(5):79-91.
|
| [4] |
苏利阳, 郑红霞, 王毅. 中国省际工业绿色发展评估[J]. 中国人口·资源与环境, 2013, 23(8):116-122.
|
| [5] |
李旭辉, 王经伟, 吴权, 等. “双碳”目标下中国五大重点区域工业绿色发展水平差异及成因识别[J]. 经济地理, 2023, 43(8):103-112.
|
| [6] |
李鹏, 史丹. 中国工业绿色低碳发展质量的演进、区域差异及政策建议[J]. 北京师范大学学报(社会科学版), 2024(3):136-147.
|
| [7] |
袁润松, 丰超, 王苗, 等. 技术创新、技术差距与中国区域绿色发展[J]. 科学学研究, 2016, 34(10):1593-1600.
|
| [8] |
陈超凡. 中国工业绿色增长:理论研究与实证分析[M]. 北京: 经济日报出版社, 2019.
|
| [9] |
原毅军, 谢荣辉. FDI、环境规制与中国工业绿色全要素生产率增长——基于Luenberger指数的实证研究[J]. 国际贸易问题, 2015(8):84-93.
|
| [10] |
肖滢, 卢丽文. 资源型城市工业绿色转型发展测度——基于全国108个资源型城市的面板数据分析[J]. 财经科学, 2019(9):86-98.
|
| [11] |
刘晶, 张尧. 金融科技、强环境规制与区域工业绿色发展[J]. 财经理论与实践, 2022, 43(2):123-131.
|
| [12] |
韩晶, 蓝庆新. 中国工业绿化度测算及影响因素研究[J]. 中国人口·资源与环境, 2012, 22(5):101-107.
|
| [13] |
周五七. 低碳约束下中国工业绿色TFP增长的地区差异——基于共同前沿生产函数的非参数分析[J]. 经济管理, 2014, 36(3):1-10.
|
| [14] |
张波, 温旭新. 我国工业绿色低碳发展水平的省际测度及比较[J]. 经济问题, 2018(5):68-74.
|
| [15] |
李科, 袁玮鸿, 罗晶, 等. 中国工业绿色增长效率的测算及其变化特征[J]. 经济地理, 2022, 42(4):44-53.
|
| [16] |
全良, 张敏, 赵凤. 中国工业绿色全要素生产率及其影响因素研究——基于全局SBM方向性距离函数及SYS-GMM模型[J]. 生态经济, 2019, 35(4):39-46.
|
| [17] |
周小亮, 宋立. 中国工业低碳转型:现实分析与政策思考[J]. 数量经济技术经济研究, 2022, 39(8):22-41.
|
| [18] |
王喜平, 李艳梅. 可持续发展视角下工业绿色发展测度及其差异演化[J]. 工业技术经济, 2020, 39(7):83-91.
|
| [19] |
谭卫华, 舒银燕. 新金融发展与工业绿色转型——基于系统GMM模型的实证分析[J]. 经济地理, 2020, 40(11):149-157.
|
| [20] |
陈超凡. 中国工业绿色全要素生产率及其影响因素——基于ML生产率指数及动态面板模型的实证研究[J]. 统计研究, 2016, 33(3):53-62.
|
| [21] |
陈超凡, 韩晶, 毛渊龙. 环境规制、行业异质性与中国工业绿色增长——基于全要素生产率视角的非线性检验[J]. 山西财经大学学报, 2018, 40(3):65-80.
|
| [22] |
申晨, 辛雅儒, 贾妮莎, 等. OFDI对工业绿色全要素生产率的影响机制——基于两阶段Super-SBM-Malmquist指数模型的分析[J]. 中国管理科学, 2024, 32(5):229-240.
|
| [23] |
高建刚. 中国工业的绿色发展:绩效、机制与路径[M]. 北京: 经济管理出版社, 2021.
|
| [24] |
王兵, 刘光天. 节能减排与中国绿色经济增长——基于全要素生产率的视角[J]. 中国工业经济, 2015(5):57-69.
|
| [25] |
|
| [26] |
葛鹏飞, 王颂吉, 黄秀路. 中国农业绿色全要素生产率测算[J]. 中国人口·资源与环境, 2018, 28(5):66-74.
|
| [27] |
张宁. 碳全要素生产率、低碳技术创新和节能减排效率追赶——来自中国火力发电企业的证据[J]. 经济研究, 2022, 57(2):158-174.
|
| [28] |
吴戈, 张月池, 苗壮. 我国工业减污降碳的绿色偏向技术进步:要素贡献、偏向识别与影响因素[J]. 统计研究, 2024, 41(5):3-14.
|
| [29] |
张军, 吴桂英, 张吉鹏. 中国省际物质资本存量估算:1952—2000[J]. 经济研究, 2004(10):35-44.
|
| [30] |
黄磊, 吴传清. 长江经济带城市工业绿色发展效率及其空间驱动机制研究[J]. 中国人口·资源与环境, 2019, 29(8):40-49.
|
| [31] |
戴魁早, 王思曼, 温晓华. 基础研究与工业绿色全要素生产率[J]. 南方经济, 2023(8):93-114.
|
| [32] |
史丹, 李鹏. 中国工业70年发展质量演进及其现状评价[J]. 中国工业经济, 2019(9):5-23.
|
| [33] |
李斌, 彭星, 欧阳铭珂. 环境规制、绿色全要素生产率与中国工业发展方式转变——基于36个工业行业数据的实证研究[J]. 中国工业经济, 2013(4):56-68.
|
| [34] |
邓荣荣, 肖湘涛. 工业智能化对城市绿色生态效率的影响——基于工业机器人数据的实证研究[J]. 当代经济研究, 2023(10):98-113.
|
| [35] |
涂正革, 王昆, 甘天琦. 中国工业生产率增长的绿色新动能[J]. 东南学术, 2021(5):148-158,248.
|
| [36] |
安树伟, 肖金成, 高国力, 等. 区域发展新空间[M]. 北京: 商务印书馆, 2024.
|
| [37] |
邵帅, 范美婷, 杨莉莉. 经济结构调整、绿色技术进步与中国低碳转型发展——基于总体技术前沿和空间溢出效应视角的经验考察[J]. 管理世界, 2022, 38(2):46-69,4-10.
|
| [38] |
史丹. 绿色发展与全球工业化的新阶段:中国的进展与比较[J]. 中国工业经济, 2018(10):5-18.
|
/
| 〈 |
|
〉 |