
沿海地区物流服务数智化水平格局变化及其影响因素
|
王泽宇(1981—),女,博士,教授,研究方向为海洋经济地理。E-mail:wangzeyu2008@163.com |
收稿日期: 2024-11-13
修回日期: 2025-03-01
网络出版日期: 2025-07-07
基金资助
国家自然科学基金项目(42471209)
教育部基地重大项目(22JJD790030)
辽宁省社会科学规划基金重大委托项目(L24ZD025)
辽宁省研究生教育教学改革研究项目(LNYJG2023269)
辽宁省委组织部兴辽英才计划四个一批人才项目(XLYC2410002)
Evolution and Influencing Factors of Logistics Service Intellectualization Level in China's Coastal Areas
Received date: 2024-11-13
Revised date: 2025-03-01
Online published: 2025-07-07
王泽宇 , 倪梦笛 , 宋洹 , 赵莉 . 沿海地区物流服务数智化水平格局变化及其影响因素[J]. 经济地理, 2025 , 45(5) : 93 -102 . DOI: 10.15957/j.cnki.jjdl.2025.05.010
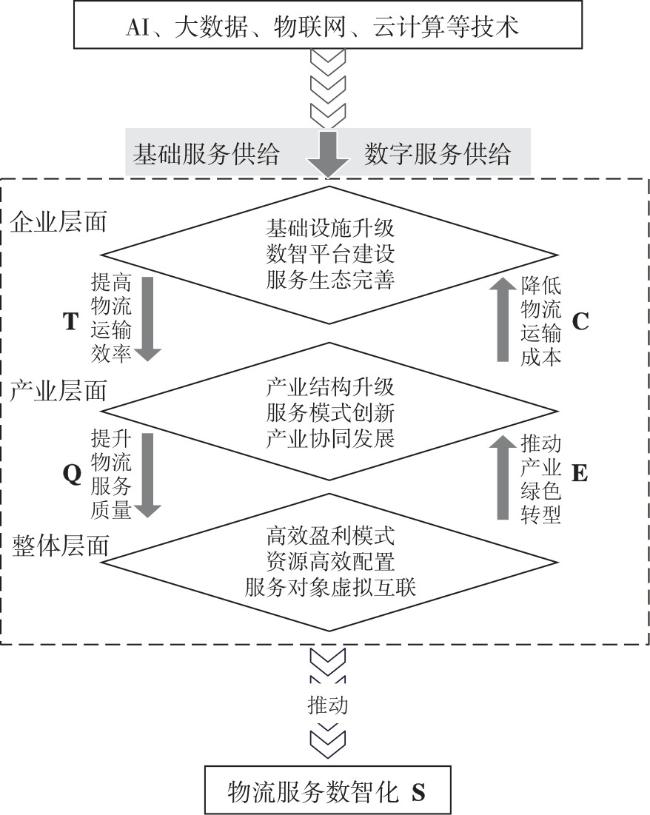
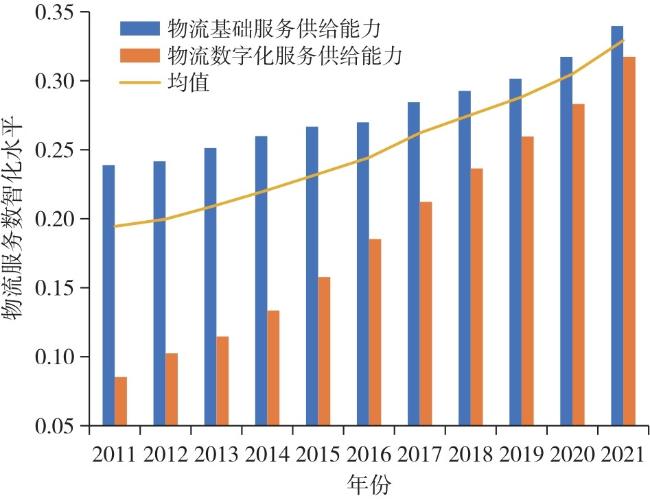
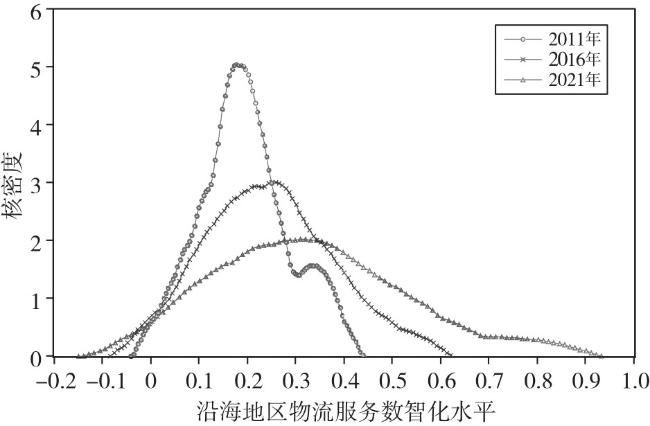
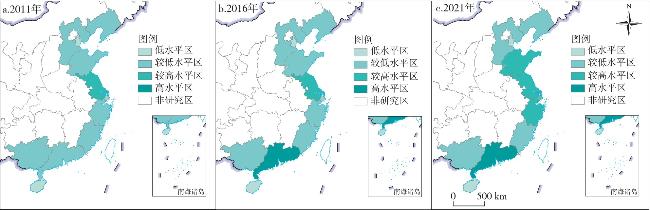
Based on the data of 5A-level logistics enterprises, this paper constructs an index system of logistics service intellectualization level from two aspects: logistics basic service supply capacity and logistics digital service supply capacity, and evaluates the logistics service intellectualization level in China's coastal areas from 2011 to 2021 using the improved TOPSIS method. It explores the evolution law of the logistics service intellectualization level using Dagum Gini coefficient and kernel density, and empirically analyzes the influencing factors by means of geographic detectors. The results show that: 1) From 2011 to 2021, the level of logistics services intellectualization in coastal areas increased year by year, among which the supply capacity of logistics digital services made outstanding contributions, with an average annual growth rate of 14.04%. 2) The logistics service intellectualization level showed the clearly segmented evolution characteristic in China's coastal areas. In 2011-2015, the level of logistics service intellectualization was concentrated in low-value areas, and it developed rapidly in 2016-2021. The deep integration between digital economy and industry, as well as the promotion of logistics service innovation by digital consumption, are the keys for the development of he logistics service intellectualization. 3) In terms of spatial pattern, the distribution of low-level areas remained stable, while the high-level areas expanded from the middle of China's coastal areas to the north and south of China's coastal areas, and the high-level areas shifted to the south of China's coastal areas. The overall and inter-group differences of the three major marine economic circles are fluctuating and expanding, and the evolution trend of intra-group differences is different. The overall development trend is good in the eastern marine economic circle, and the intra-regional differences are gradually narrowing, while the intra-regional differences are increasing in the southern and northern marine economic circles. 4) In terms of influencing factors, regional economic development, local government support and regional digital market are the leading influencing factors of logistics services, the values of their explanatory power is in 0.65-0.85. Regional logistics foundation is the foundation for supporting related services, and its interaction with other factors far exceeds the influence of single factor, the values of their explanatory power is in 0.7-09. Local government support is the key to break the path dependence and promote the transformation and development of regional logistics services.
表1 交互作用类型及判据Tab.1 Types and criteria of interaction result |
| 交互类型 | 判据依据 |
|---|---|
| 非线性减弱 | q(X1∩X2)<min[q(X1),q(X2)] |
| 单因子非线 性减弱 | min[q(X1),q(X2)]<q(X1∩X2)<max[q(X1),q(X2)] |
| 双因子增强 | q(X1∩X2)>max[q(X1),q(X2)] |
| 非线性增强 | q(X1∩X2)>q(X1)+q(X2) |
| 独立 | q(X1∩X2)=q(X1)+q(X2) |
表2 物流服务数智化水平评价指标体系及说明Tab.2 Evaluation index system of logistics service intellectualization level |
| 维度 | 一级指标 | 二级指标 | 单位 | 权重 |
|---|---|---|---|---|
| 物流 基础 服务 供给 能力 A1 | 基础资源B1 | 交通运输、仓储及邮政业从业人员数C1 | 万人 | 1.980 |
| 物流就业密度LED1C2 | - | 3.314 | ||
| 专利授权数2C3 | 件 | 5.228 | ||
| 金融业产值3C4 | 亿元 | 2.282 | ||
| 交通运输、仓储及邮政业固定资产投资额C5 | 亿元 | 2.758 | ||
| 基础设施B2 | 铁路里程C6 | km | 2.670 | |
| 内河航道里程C7 | km | 6.701 | ||
| 公路里程C8 | km | 2.770 | ||
| 民用运输船舶拥有量C9 | 艘 | 6.868 | ||
| 民用载货汽车拥有量C10 | 万辆 | 2.826 | ||
| 基础规模B3 | 物流业占GDP比重C11 | - | 2.220 | |
| 快递业务总量C12 | 万件 | 8.314 | ||
| 货物运输量C13 | 万t | 1.957 | ||
| 货物周转量C14 | 亿t·km | 2.380 | ||
| 社会消费品零售总额C15 | 亿元 | 2.527 | ||
| 进出口贸易总额C16 | 万美元 | 5.522 | ||
| 物流 数字 服务 供给 能力 A2 | 数智平台B4 | 区域内5A级物流企业拥有的网址数C17 | 个 | 2.970 |
| 区域内5A级物流企业建设的数字化平台数C18 | 个 | 5.233 | ||
| 数智创新B5 | 区域内5A级物流企业的计算机软件著作权数量C19 | 个 | 9.498 | |
| 区域内5A级物流企业实用和发明专利数量C20 | 件 | 14.041 | ||
| 数字服务 规模B6 | 电子商务销售额C21 | 亿元 | 5.267 | |
| 移动互联网用户数C22 | 万户 | 2.674 |
表3 2011—2021年中国沿海省份物流服务数智化水平评价结果Tab.3 Evaluation results of logistics service intellectualization level in China's coastal areas in 2011-2021 |
| 省份 | 2011 | 2012 | 2013 | 2014 | 2015 | 2016 | 2017 | 2018 | 2019 | 2020 | 2021 | 均值 |
|---|---|---|---|---|---|---|---|---|---|---|---|---|
| 天津 | 0.100 | 0.100 | 0.091 | 0.091 | 0.099 | 0.095 | 0.096 | 0.096 | 0.115 | 0.118 | 0.120 | 0.102 |
| 河北 | 0.208 | 0.217 | 0.226 | 0.231 | 0.236 | 0.240 | 0.250 | 0.270 | 0.282 | 0.312 | 0.323 | 0.254 |
| 辽宁 | 0.171 | 0.171 | 0.173 | 0.177 | 0.185 | 0.181 | 0.193 | 0.197 | 0.190 | 0.187 | 0.194 | 0.184 |
| 上海 | 0.205 | 0.202 | 0.231 | 0.255 | 0.293 | 0.323 | 0.354 | 0.379 | 0.392 | 0.423 | 0.470 | 0.321 |
| 江苏 | 0.355 | 0.359 | 0.364 | 0.371 | 0.370 | 0.373 | 0.392 | 0.403 | 0.428 | 0.450 | 0.472 | 0.394 |
| 浙江 | 0.214 | 0.222 | 0.237 | 0.253 | 0.262 | 0.272 | 0.286 | 0.305 | 0.328 | 0.355 | 0.387 | 0.284 |
| 福建 | 0.166 | 0.169 | 0.178 | 0.181 | 0.192 | 0.201 | 0.214 | 0.220 | 0.223 | 0.235 | 0.253 | 0.203 |
| 山东 | 0.224 | 0.231 | 0.237 | 0.259 | 0.277 | 0.296 | 0.319 | 0.338 | 0.347 | 0.360 | 0.389 | 0.298 |
| 广东 | 0.317 | 0.335 | 0.367 | 0.390 | 0.419 | 0.480 | 0.532 | 0.594 | 0.629 | 0.666 | 0.713 | 0.495 |
| 广西 | 0.134 | 0.138 | 0.146 | 0.157 | 0.163 | 0.167 | 0.174 | 0.176 | 0.181 | 0.194 | 0.219 | 0.168 |
| 海南 | 0.047 | 0.054 | 0.059 | 0.065 | 0.062 | 0.060 | 0.074 | 0.051 | 0.056 | 0.053 | 0.081 | 0.060 |
| 均值 | 0.195 | 0.200 | 0.210 | 0.221 | 0.232 | 0.244 | 0.262 | 0.275 | 0.288 | 0.305 | 0.329 | 0.251 |
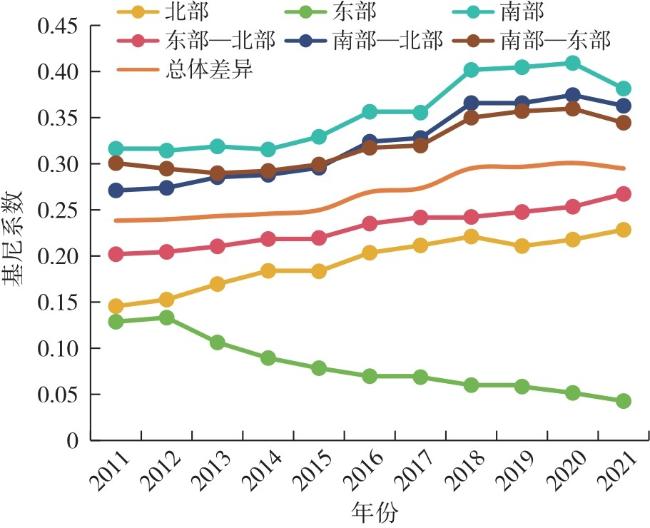
表4 Dagum基尼系数及其分解结果Tab.4 Dagum Gini coefficient and its decomposition result |
| 年份 | 总体差异 | 组内差异 | 组间差异 | 贡献率/% | ||||||||
|---|---|---|---|---|---|---|---|---|---|---|---|---|
| 1 | 2 | 3 | 2→1 | 3→1 | 3→2 | GW | Gnb | Gt | ||||
| 2011 | 0.238 | 0.146 | 0.129 | 0.316 | 0.202 | 0.271 | 0.301 | 27.601 | 39.899 | 32.500 | ||
| 2012 | 0.240 | 0.153 | 0.133 | 0.314 | 0.204 | 0.274 | 0.295 | 28.063 | 36.584 | 35.353 | ||
| 2013 | 0.243 | 0.170 | 0.106 | 0.319 | 0.210 | 0.285 | 0.290 | 27.766 | 37.471 | 34.763 | ||
| 2014 | 0.246 | 0.184 | 0.089 | 0.315 | 0.218 | 0.288 | 0.292 | 27.312 | 38.491 | 34.197 | ||
| 2015 | 0.250 | 0.183 | 0.078 | 0.329 | 0.220 | 0.296 | 0.299 | 27.073 | 37.732 | 35.194 | ||
| 2016 | 0.269 | 0.204 | 0.070 | 0.356 | 0.235 | 0.324 | 0.317 | 27.100 | 37.233 | 35.667 | ||
| 2017 | 0.273 | 0.211 | 0.069 | 0.355 | 0.242 | 0.328 | 0.320 | 27.108 | 37.432 | 35.460 | ||
| 2018 | 0.295 | 0.221 | 0.060 | 0.402 | 0.242 | 0.366 | 0.350 | 27.114 | 34.845 | 38.041 | ||
| 2019 | 0.297 | 0.211 | 0.058 | 0.405 | 0.248 | 0.366 | 0.357 | 26.580 | 36.177 | 37.244 | ||
| 2020 | 0.301 | 0.218 | 0.052 | 0.409 | 0.253 | 0.374 | 0.360 | 26.317 | 37.169 | 36.515 | ||
| 2021 | 0.295 | 0.228 | 0.043 | 0.381 | 0.267 | 0.363 | 0.344 | 25.866 | 40.160 | 33.974 | ||
注:分组代号1、2、3分别代表北部海洋经济圈、东部海洋经济圈、南部海洋经济圈。Gw为组内成分,Gnb为组间成分,Gt为超变密度成分,G=Gw+Gnb+Gt。 |
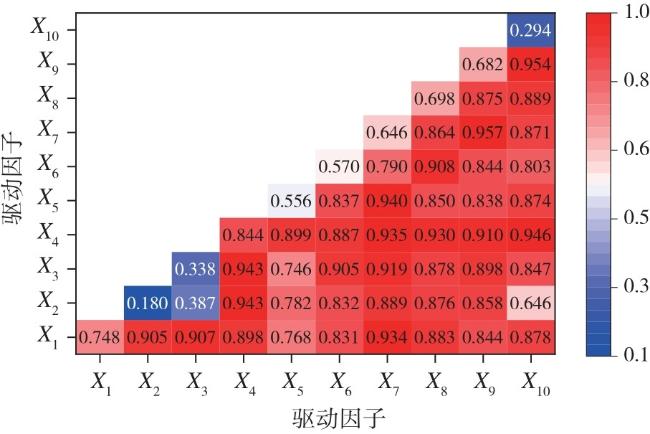
表5 物流服务数智化水平影响因素指标与q值结果Tab.5 Index and q value of influencing factors of logistics service intellectualization level |
| 影响因素类型 | 序号 | 影响因素指标 | 单位 | q值 |
|---|---|---|---|---|
| 区域经济发展 | X1 | 地区GDP | 亿元 | 0.748*** |
| 区域物流基础 | X2 | 区域物流集群 | - | 0.180** |
| X3 | 物流就业密度 | - | 0.338*** | |
| X4 | 区域互联网移动用户数 | 万户 | 0.844*** | |
| 地方政府扶持 | X5 | 国家示范物流园区数量 | 个 | 0.556*** |
| X6 | 国家电子商务示范基地数量 | 个 | 0.570*** | |
| 区域数字化市场 | X7 | 区域网上零售额 | 亿元 | 0.646*** |
| X8 | 区域电子商务销售额 | 亿元 | 0.698*** | |
| 区域基础市场 | X9 | 区域人口数量 | 万人 | 0.682*** |
| X10 | 区域居民人均可支配收入 | 元/人 | 0.294*** |
注:***、**、*分别表示在1%、5%和10%的水平下显著。 |
| [1] |
成荣. 数智化重构物流基础设施[J]. 中国物流与采购, 2019 (24):62.
|
| [2] |
周建平, 刘程军, 徐维祥, 等. 电子商务背景下快递企业物流网络结构及自组织效应——以中通快递为例[J]. 经济地理, 2021, 41(2):103-112.
|
| [3] |
谷城, 张树山. 中国物流产业智慧化空间联系的网络结构及其影响因素[J]. 经济地理, 2023, 43(5):117-127.
|
| [4] |
郝玉柱. 双循环新发展格局下统筹推进现代流通体系建设观点综述[J]. 中国流通经济, 2020, 34(11):3-17.
|
| [5] |
|
| [6] |
|
| [7] |
|
| [8] |
|
| [9] |
|
| [10] |
|
| [11] |
|
| [12] |
魏冉, 刘春红, 张悦. 物流服务生态系统价值共创与数字化能力研究——基于菜鸟网络的案例研究[J]. 中国软科学, 2022(3):154-163.
|
| [13] |
吴群, 朱嘉懿. 平台型物流企业供应链生态圈可持续协同发展研究[J]. 中国软科学, 2022(10):114-124.
|
| [14] |
董晓松, 许仁仁, 赵星, 等. 基于价值视角的制造业数字化服务转型机理与路径——仁和集团案例研究[J]. 中国软科学, 2021(8):152-161.
|
| [15] |
李立望, 黄德海. 基于价值共创的智慧物流平台生态体系构建研究[J]. 生态经济, 2022, 38(7):79-84.
|
| [16] |
张路娜, 胡贝贝, 王胜光. 数字经济演进机理及特征研究[J]. 科学学研究, 2021, 39(3):406-414.
|
| [17] |
罗建强, 蒋倩雯. 数字化转型下产品与服务创新优先级演化分析——基于海尔智家案例[J]. 科学学研究, 2022, 40(9):1710-1720.
|
| [18] |
宗会明, 周素红, 闫小培. 全球化下地方综合服务型物流企业的空间网络组织——以腾邦物流为案例[J]. 地理研究, 2015, 34(5):944-952.
|
| [19] |
沈馨怡, 吴松强. 数智化发展、双重网络嵌入与新创企业韧性——长三角中小集成电路企业的实证研究[J]. 科学学研究, 2024, 42(4):797-804.
|
| [20] |
|
| [21] |
王军, 刘小凤, 朱杰. 数字经济能否推动区域经济高质量发展?[J]. 中国软科学, 2023(1):206-214.
|
| [22] |
张英浩, 汪明峰, 汪凡, 等. 中国直播电商发展的空间差异与影响机理研究[J]. 地理科学, 2022, 42(9):1555-1565.
|
| [23] |
曾锵. 大数据驱动的商业模式创新研究[J]. 科学学研究, 2019, 37(6):1142-1152.
|
| [24] |
王泽宇, 王焱熙. 中国海洋经济弹性的时空分异与影响因素分析[J]. 经济地理, 2019, 39(2):139-145,151.
|
| [25] |
李旭辉, 何金玉, 严晗. 中国三大海洋经济圈海洋经济发展区域差异与分布动态及影响因素[J]. 自然资源学报, 2022, 37(4):966-984.
|
| [26] |
孙晓, 刘力钢, 陈金. 东北三省旅游经济质量的区域差异、动态演进及影响因素[J]. 地理科学, 2021, 41(5):832-841.
|
| [27] |
王泽宇, 唐云清, 韩增林, 等. 中国沿海省份海洋船舶产业链韧性测度及其影响因素[J]. 经济地理, 2022, 42(7):117-125.
|
| [28] |
王劲峰, 徐成东. 地理探测器:原理与展望[J]. 地理学报, 2017, 72(1):116-134.
|
| [29] |
张则强. 基于仿生的数字物流平衡问题理论与应用研究[D]. 成都: 西南交通大学, 2006.
|
| [30] |
戴德宝, 范体军, 安琪. 西部地区物流综合评价与协调发展研究[J]. 中国软科学, 2018(1):90-99.
|
| [31] |
余运江, 杨力, 任会明, 等. 中国城市数字经济空间格局演化与驱动因素[J]. 地理科学, 2023, 43(3):466-475.
|
| [32] |
刘思婧, 李国旗, 金凤君. 中国物流集群的量化甄别与发育程度评价[J]. 地理学报, 2018, 73(8):1540-1555.
|
| [33] |
谌玲. 金融业促进区域物流发展的内生机制研究——基于非限制性VAR模型的全视角分析[J]. 物流技术, 2014, 33(11):110-112,134.
|
| [34] |
李金沙. 数字金融对物流业高质量发展的影响研究[J]. 物流工程与管理, 2024, 46(2):105-106,93.
|
| [35] |
李利华, 王轩. 我国省域物流集群竞争力研究[J]. 经济地理, 2020, 40(5):165-173.
|
| [36] |
周正祥, 戴红梅, 查嫣媛. 数字交通赋能经济高质量发展的困境及对策研究[J]. 中国软科学, 2023 (9):86-94.
|
| [37] |
姜舸, 安同良, 陈孝强. 新发展格局下的互联网与数字经济研究——第二届互联网与数字经济论坛综述[J]. 经济研究, 2021, 56(4):198-200.
|
| [38] |
刘念, 简兆权, 刘洋. 服务供应链整合战略演进与服务创新能力升级[J]. 科学学研究, 2020, 38(1):145-157.
|
| [39] |
何黎明. 中国智慧物流发展趋势[J]. 中国流通经济, 2017, 31(6):3-7.
|
/
| 〈 |
|
〉 |