
百年未有之大变局下中国区域发展格局演变
|
曾刚(1961—),男,湖北武汉人,教授,博士生导师,研究方向为生态文明与区域发展方式、创新网络与产业集群。E-mail:gzeng@re.ecnu.edu.cn |
收稿日期: 2021-08-21
修回日期: 2021-09-10
网络出版日期: 2025-04-24
基金资助
教育部人文社会科学重点研究基地重大项目(17JJD790006)
华东师范大学优秀博士生学术创新能力提升计划(YBNLTS2020-021)
Spatial Evolution Process of China's Regional Development Pattern in Big Changes Unseen in a Century
Received date: 2021-08-21
Revised date: 2021-09-10
Online published: 2025-04-24
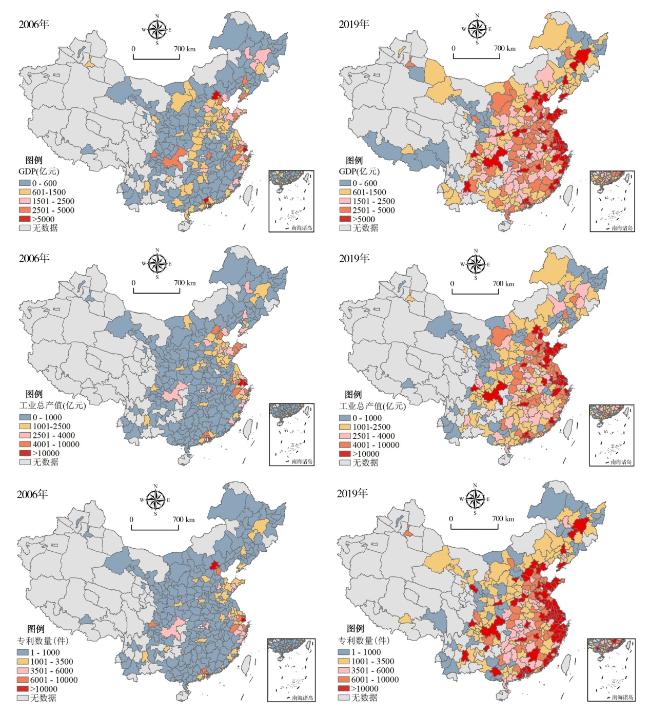
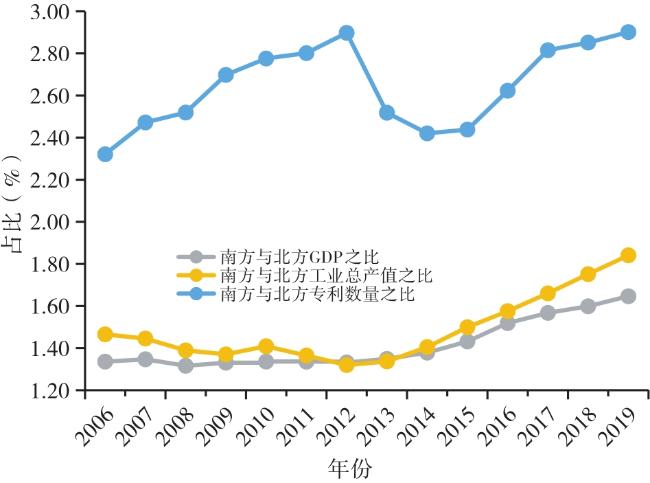
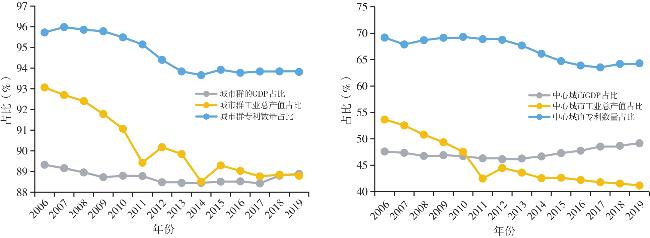
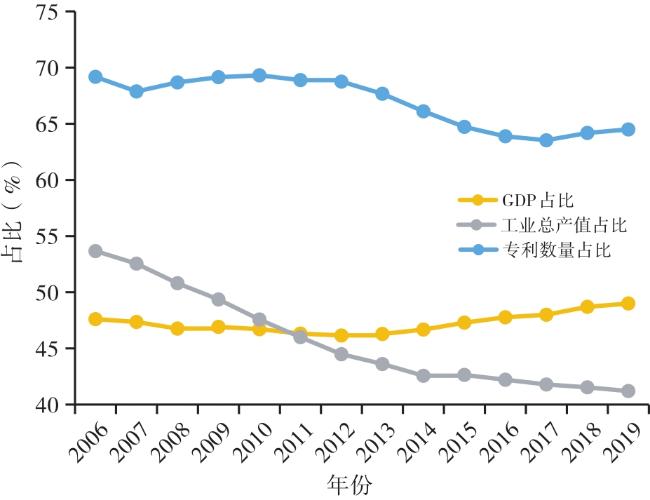
在经历百年未有之大变局的当下,我国区域发展总体格局演变的态势如何?哪些地域担当了区域增长极角色?推动区域发展的核心动力是什么?这些都是经济地理学者关心的问题。文章从科技创新、产业结构、经济发展三个方面入手,借助地理联系率、双变量Moran指数等分析工具,刻画2006—2019年中国区域发展格局的演变过程,分析内部作用机理,导出政策启示。研究发现:①2006—2019年,中国东西部发展差异呈现逐渐缩小态势,但南北发展差异却逐渐增大,我国东西“单向”发展不平衡的总体格局呈现出向东西、南北“双向”发展不平衡的方向演变。②城市群和中心城市对我国区域发展的支撑作用巨大,我国城乡“单向”发展不平衡格局向城乡、大城市与中小城市“双向”发展不平衡的方向转变。2006—2019年,19大城市群汇集了全国88%的GDP、93%的专利。③经济发展质量越来越高。“创新驱动、转型发展”政策效益呈现显现。2006年以来,科技创新、先进制造、经济发展三者空间关联关系不断增强。此外,针对中国区域发展现实问题,提出了加大支持东北地区、边缘地区中小城市创新能力建设、高质量发展,扶持“双向飞地”建设等对策建议。
曾刚 , 胡森林 . 百年未有之大变局下中国区域发展格局演变[J]. 经济地理, 2021 , 41(10) : 42 -48 . DOI: 10.15957/j.cnki.jjdl.2021.10.005
What is the evolution trend of the overall pattern of regional development in China? Which regions play the role in regional growth pole? What is the core driving force to promote regional development? These are issues of concern to economic geographers at a time of big changes unseen in a century. Under the background of the new era,this paper describes the evolution process of China's regional development pattern from 2006 to 2019 from three aspects of economic development,industrial structure and technological innovation. The results show that: 1) From 2006 to 2019,the regional differences between the east and the west of China gradually narrowed,but the development difference between the north and the south gradually increased. The spatial pattern of "one-way" imbalance development between the east and the west in China has evolved in the direction of "two-way" imbalance development between the east and west and between the north and south. 2) Urban agglomerations and central cities play a great role in supporting China's regional development. 19 major urban agglomerations accounts for 88% of China's GDP and 93% of patents from 2006 to 2019. The "one-way" development imbalance between urban and rural areas has changed to the "two-way" imbalance development between urban and rural areas,large cities and small and medium-sized cities. 3) The quality of economic development is getting more higher. The benefits of the innovation-driven transformation development policy have gradually emerged,and the quality of economic development is getting higher and higher. Since 2006,The spatial relationship between scientific and technological innovation,advanced manufacturing and economic development has been continuously strengthened. In view of the problems of China's regional development,this paper puts forward some suggestions,such as increasing support for the construction of innovation capacity and high-quality development of small and medium-sized cities in northeast and marginal areas, and supporting the construction of "two-way enclaves".
表1 2006—2019年中国GDP、工业产值和专利数量平均增长率(%)Tab.1 Average growth rate of China's GDP,industrial production and number of patents from 2006 to 2019(%) |
| 表征指标 | 全国平均 | 东部地区 | 中部地区 | 西部地区 |
|---|---|---|---|---|
| GDP | 11.93 | 11.12 | 12.51 | 13.69 |
| 工业总产值 | 14.15 | 12.19 | 18.94 | 17.24 |
| 专利 | 21.72 | 20.81 | 25.46 | 23.61 |
表2 2006—2019年中国8大经济区域GDP、工业产值和专利数量平均增长率(%)Tab.2 Average growth rate of GDP,industrial production and number of patents in China's eight economic zones from 2006 to 2019(%) |
| 北方地区 | GDP | 工业产值 | 专利 | 南方地区 | GDP | 工业产值 | 专利 | |
|---|---|---|---|---|---|---|---|---|
| 北部沿海地区 | 10.02 | 11.20 | 20.60 | 东部沿海地区 | 11.74 | 9.56 | 21.12 | |
| 黄河中游地区 | 12.11 | 14.95 | 24.78 | 南部沿海地区 | 12.26 | 11.29 | 21.75 | |
| 西北地区 | 12.30 | 7.58 | 24.03 | 长江中游地区 | 14.39 | 18.45 | 28.08 | |
| 东北地区 | 7.98 | 6.01 | 15.78 | 西南地区 | 14.44 | 16.64 | 23.05 |
表3 2006和2019年中国城市群经济、产业和创新产出的发展演变Tab.3 Variation trend of differences in GDP,industrial production and number of patents of China's urban agglomerations in 2006 and 2019 |
| 城市群名称 | GDP(%) | 工业产值占比(%) | 专利数量(%) | |||||
|---|---|---|---|---|---|---|---|---|
| 2006 | 2019 | 2006 | 2019 | 2006 | 2019 | |||
| 长三角城市群 | 22.67 | 23.37 | 29.78 | 24.04 | 31.93 | 31.37 | ||
| 珠三角城市群 | 10.68 | 10.29 | 13.60 | 10.73 | 18.30 | 20.42 | ||
| 京津冀城市群 | 11.86 | 10.00 | 10.51 | 9.16 | 10.40 | 10.16 | ||
| 山东半岛城市群 | 11.19 | 8.35 | 13.49 | 14.55 | 6.02 | 5.65 | ||
| 长江中游城市群 | 7.95 | 10.84 | 5.18 | 10.18 | 6.68 | 6.59 | ||
| 海峡西岸城市群 | 6.69 | 8.00 | 5.83 | 7.28 | 7.34 | 8.35 | ||
| 成渝城市群 | 5.50 | 7.71 | 3.44 | 6.02 | 6.40 | 4.71 | ||
| 辽中南城市群 | 5.00 | 2.85 | 4.68 | 1.96 | 1.54 | 1.83 | ||
| 哈长城市群 | 4.00 | 2.29 | 2.88 | 2.62 | 1.33 | 1.41 | ||
| 中原城市群 | 4.52 | 4.93 | 3.60 | 5.73 | 3.30 | 3.58 | ||
| 关中城市群 | 2.18 | 2.47 | 1.50 | 1.81 | 2.35 | 1.61 | ||
| 滇中城市群 | 1.07 | 1.31 | 0.80 | 0.57 | 0.71 | 0.89 | ||
| 黔中城市群 | 0.59 | 1.23 | 0.37 | 0.67 | 0.93 | 1.01 | ||
| 北部湾城市群 | 1.76 | 1.94 | 0.88 | 1.48 | 1.16 | 0.61 | ||
| 晋中城市群 | 1.33 | 1.23 | 1.07 | 0.74 | 0.48 | 0.55 | ||
| 兰西城市群 | 0.58 | 0.66 | 0.53 | 0.47 | 0.40 | 0.44 | ||
| 呼包鄂城市群 | 1.56 | 1.57 | 1.01 | 1.30 | 0.29 | 0.38 | ||
| 天山北坡城市群 | 0.56 | 0.56 | 0.55 | 0.29 | 0.22 | 0.17 | ||
| 宁夏沿黄城市群 | 0.33 | 0.41 | 0.30 | 0.39 | 0.23 | 0.26 | ||
表4 2006和2019年中国经济、工业和创新的空间匹配和空间关联性分析Tab.4 Spatial correlation analysis of China's economy,industry and innovation in 2006 and 2019 |
| 地理联系率 | 经济 | 工业 | 创新 | Moran's I | 经济 | 工业 | 创新 | |
|---|---|---|---|---|---|---|---|---|
| 经济 | - | 77.9 | 74.2 | 经济 | - | 0.418 | 0.398 | |
| 工业 | 83.5 | - | 62.4 | 工业 | 0.432 | - | 0.413 | |
| 创新 | 69.6 | 62.3 | - | 创新 | 0.427 | 0.304 | - |
注:下半矩阵和上半矩阵分别为2006、2019年计算结果。 |
| [1] |
沈坤荣, 赵倩. 以双循环新发展格局推动“十四五”时期经济高质量发展[J]. 经济纵横, 2020(10):18-25.
|
| [2] |
张占斌. 构建双循环新发展格局应把握好的几个关键问题[J]. 国家治理, 2020(31):9-15.
|
| [3] |
中国社会科学院工业经济研究所课题组. “十四五”时期中国工业发展战略研究[J]. 中国工业经济, 2020(2):5-27.
|
| [4] |
陆大道. 变化发展中的中国人文与经济地理学[J]. 地理科学, 2017, 37(5):641-650.
|
| [5] |
樊杰, 周侃, 陈东. 生态文明建设中优化国土空间开发格局的经济地理学研究创新与应用实践[J]. 经济地理, 2013, 33(1):1-8.
|
| [6] |
方创琳. 中国新型城镇化高质量发展的规律性与重点方向[J]. 地理研究, 2019, 38(1):13-22.
|
| [7] |
樊杰, 王亚飞, 梁博. 中国区域发展格局演变过程与调控[J]. 地理学报, 2019, 74(12):2437-2454.
|
| [8] |
尹为, 胡啸兵, 李育林. 中国高技术产业重心与经济重心变动轨迹比较[J]. 经济地理, 2012, 32(1):90-95.
|
| [9] |
周灿, 曾刚, 曹贤忠. 中国城市创新网络结构与创新能力研究[J]. 地理研究, 2017, 36(7):1297-1308.
|
| [10] |
焦敬娟, 王姣娥, 程珂. 中国区域创新能力空间演化及其空间溢出效应[J]. 经济地理, 2017, 37(9):11-18.
|
| [11] |
许宪春, 雷泽坤, 窦园园, 等. 中国南北平衡发展差距研究——基于“中国平衡发展指数”的综合分析[J]. 中国工业经济, 2021(2):5-22.
|
| [12] |
肖金成. “十四五”时期区域经济高质量发展的若干建议[J]. 区域经济评论, 2019(6):13-17.
|
| [13] |
樊杰, 刘汉初. “十三五”时期科技创新驱动对我国区域发展格局变化的影响与适应[J]. 经济地理, 2016, 36(1):1-9.
|
| [14] |
马凯. 中华人民共和国国民经济与社会发展第十一个五年规划纲要辅导读本[M]. 北京: 北京科学技术出版社, 2006.
|
| [15] |
刘锋. 关于“十一五”规划区域划分的思考[R]. 调查研究报告, 2005(65):1-15.
|
| [16] |
邱灵, 方创琳. 北京市生产性服务业空间集聚综合测度[J]. 地理研究, 2013, 32(1):99-110.
|
| [17] |
胡森林, 曾刚, 滕堂伟, 等. 长江经济带产业的集聚与演化——基于开发区的视角[J]. 地理研究, 2020, 39(3):611-626.
|
| [18] |
|
| [19] |
胡森林, 周亮, 滕堂伟, 等. 中国省级以上开发区空间分布特征及影响因素[J]. 经济地理, 2019, 39(1):21-28.
|
| [20] |
习近平. 推动形成优势互补高质量发展的区域经济布局[J]. 求是, 2019(24):4-9.
|
| [21] |
金凤君, 王姣娥, 杨宇, 等. 东北地区创新发展的突破路径与对策研究[J]. 地理科学, 2016, 36(9):1285-1292.
|
/
| 〈 |
|
〉 |