
中国文化产业的省域空间集聚及其溢出效应分析
|
冯星宇(1990—),男,山东济南人,博士研究生,研究方向为产业经济学、文化产业。E-mail:kaoyan349618346@163.com |
收稿日期: 2021-02-27
修回日期: 2021-08-22
网络出版日期: 2025-04-24
基金资助
国家自然科学基金项目(42071194)
教育部人文社会科学研究基金项目(20YJC760013)
北京市社会科学基金项目(19YTC039)
北京市社会科学基金项目(21ZDA07)
中央财经大学“青年英才”培育支持计划项目(QYP202111)
Provincial Spatial Agglomeration and Spillover Effect of China's Cultural Industry
Received date: 2021-02-27
Revised date: 2021-08-22
Online published: 2025-04-24
冯星宇 , 戴俊骋 , 孙东琪 . 中国文化产业的省域空间集聚及其溢出效应分析[J]. 经济地理, 2021 , 41(10) : 233 -240 . DOI: 10.15957/j.cnki.jjdl.2021.10.026
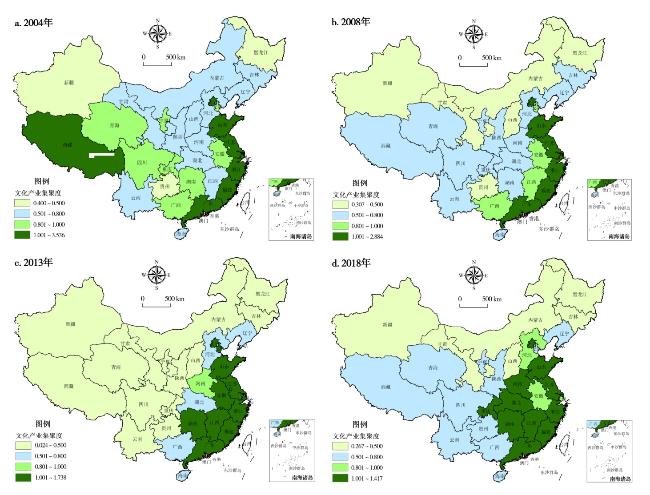
In the past,the research on the spatial spillover effect of cultural industry generally used the Geographic adjacency matrix or Geographic distance matrix to analyze,and there was endogeneity in the selection of independent variables. Based on the data of "The Fourth National Economic Census",this paper sets up economic weight matrix and a spatial model to analyze the spatial agglomeration and spatial spillover effect of the cultural industry of China from 2004 to 2018. The results show that: Firstly,in China,the spatial distribution characteristics of cultural industry agglomeration experienced a change from "decentralization" to "polarization" from 2004 to 2018. Secondly,they are the main factors affecting the development of cultural industry that the human resources,cultural needs and policy support. Thirdly,regional economy,urbanization level,financial support and other factors also show significant spatial spillover effect. Finally,this paper puts forward reasonable suggestions for further optimizing the cultural industry agglomeration and development.
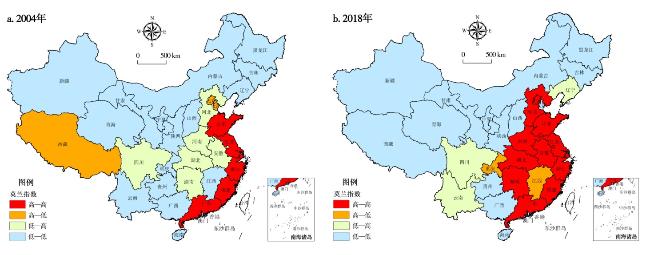
表1 2004—2018年各省文化产业集聚的全局莫兰指数Tab.1 Global Moran index of provincial cultural industry agglomeration in 2004-2018 |
| 年份 | I | z | p |
|---|---|---|---|
| 2004 | 0.078 | 2.205 | 0.027 |
| 2005 | 0.128 | 2.250 | 0.024 |
| 2006 | 0.196 | 2.976 | 0.003 |
| 2007 | 0.206 | 3.089 | 0.002 |
| 2008 | 0.347 | 4.851 | 0 |
| 2009 | 0.338 | 4.876 | 0 |
| 2010 | 0.366 | 5.142 | 0 |
| 2011 | 0.416 | 5.415 | 0 |
| 2012 | 0.440 | 5.824 | 0 |
| 2013 | 0.339 | 4.607 | 0 |
| 2014 | 0.252 | 4.523 | 0 |
| 2015 | 0.341 | 5.157 | 0 |
| 2016 | 0.163 | 2.378 | 0.017 |
| 2017 | 0.169 | 2.589 | 0.010 |
| 2018 | 0.454 | 5.046 | 0 |
表2 文化产业空间集聚的影响因素Tab.2 Influencing factors of cultural industry spatial agglomeration |
| 变量名称 | 固定效应 | 随机效应 | |
|---|---|---|---|
| (1) | lnec | 0.151(-1.312) | 0.323***(-2.67) |
| lnurb | -0.357(-1.423) | -0.249(-0.897) | |
| lnhc | 5.701***(-2.872) | 4.033*(-1.856) | |
| lncr | 0.061(-0.528) | -0.146(-1.209) | |
| lncn | 0.217***(-3.077) | 0.178**(-2.374) | |
| lnfin | 12.968(-1.516) | 36.137***(-4.633) | |
| lnpol | 0.112**(-2.297) | 0.087*(-1.755) | |
| Hausman | 47.730*(0.000) | 74.600(0.000) | |
| R2 | 0.319 | 0.426 | |
| (2) | W×lnec | -1.218***(-3.674) | -0.707**(-2.161) |
| W×lnurb | 2.426***(-2.808) | 1.872**(-1.977) | |
| W×hc | 17.473***(-3.289) | 12.914**(-2.277) | |
| W×lncr | 0.596(-1.43) | -0.298(-0.701) | |
| W×lncn | 0.339**(-2.249) | 0.004(-0.037) | |
| W×lnfin | -48.007*(-1.953) | 16.462(-0.737) | |
| W×lnpol | -0.087(-0.626) | -0.209***(-2.603) | |
| 47.730(0.000) | 74.600(0.000) | ||
| 0.319 | 0.426 | ||
| SDM→SAR | 18.74***(-0.0046) | ||
| SDM→SEM | 20.57***(-0.0045) | ||
注:***、**、*分别表示P在0.01、0.05、0.1的显著性水平,下同。 |
表3 基于空间杜宾模型的效应分解Tab.3 Effect decomposition based on the Spatial Durbin Model |
| 变量名称 | 直接效应 | 间接效应 | 总效应 |
|---|---|---|---|
| lnec | 0.189 (-1.616) | -1.120*** (-3.705) | -0.931*** (-2.679) |
| lnurb | -0.444* (-1.735) | 2.290*** (-3.072) | 1.846*** (-2.59) |
| lnhc | 5.424*** (-2.815) | 14.973*** (-3.341) | 20.397*** (-4.436) |
| lncr | 0.044 (-0.388) | 0.509 (-1.364) | 0.552 (-1.331) |
| lncn | 0.207*** (-2.742) | 0.281** (-2.044) | 0.488*** (-3.854) |
| lnfin | 13.928* (-1.766) | -44.237** (-1.992) | -30.309 (-1.139) |
| lnpol | 0.116** (-2.419) | -0.098 (-0.781) | 0.018 (-0.131) |
| [1] |
|
| [2] |
|
| [3] |
|
| [4] |
|
| [5] |
|
| [6] |
陈红霞, 吴姝雅. 文化创意产业的空间集聚特征及其区际差异比较——基于地级市的实证研究[J]. 城市发展研究, 2018, 25(7):25-33.
|
| [7] |
陶金, 罗守贵. 基于不同区域层级的文化产业集聚研究[J]. 地理研究, 2019, 38(9):2239-2253.
|
| [8] |
戴俊骋, 孙东琪, 张欣亮. 中国区域文化产业发展空间格局[J]. 经济地理, 2018, 38(9):122-129.
|
| [9] |
|
| [10] |
荆立群, 薛耀文. 资源型地区文化产业空间集聚特征研究[J]. 经济问题, 2020(5):123-129.
|
| [11] |
|
| [12] |
|
| [13] |
郭新茹, 陈天宇. 文化产业集聚、空间溢出与经济高质量发展[J]. 现代经济探讨, 2021(2):79-87.
|
| [14] |
谭娜, 黄伟. 文化产业集聚政策带动地区旅游经济增长了吗?——来自文创园区评选准自然实验的证据[J]. 中国软科学, 2021(1):68-75.
|
| [15] |
陈倩倩, 王缉慈. 论创意产业及其集群的发展环境——以音乐产业为例[J]. 地域研究与开发, 2005(5):5-8.
|
| [16] |
晏雄. 民族文化产业集群形成条件的多维度分析——以云南丽江为例[J]. 西南民族大学学报:人文社会科学版, 2014, 35(10):33-38.
|
| [17] |
|
| [18] |
戴钰. 湖南省文化产业集聚及其影响因素研究[J]. 经济地理, 2013, 33(4):114-119.
|
| [19] |
王伟年, 张平宇. 城市文化产业园区建设的区位因素分析[J]. 人文地理, 2006(1):110-115.
|
| [20] |
陈祝平, 黄艳麟. 创意产业集聚区的形成机理[J]. 国际商务研究, 2006(4):1-6.
|
| [21] |
黄永兴, 徐鹏. 经济地理、新经济地理、产业政策与文化产业集聚:基于省级空间面板模型的分析[J]. 经济经纬, 2011(6):47-51.
|
| [22] |
沈艳, 陈广, 顾江. 本地社会网络、外部空间溢出与城市文化产业增长——基于江苏地级市的空间计量研究[J]. 经济问题探索, 2017(8):64-69.
|
| [23] |
|
| [24] |
魏和清, 李燕辉, 肖惠妧. 我国文化产业综合发展实力的空间统计分析[J]. 统计与决策, 2017(15):83-87.
|
| [25] |
袁海. 中国文化产业区域差异的空间计量分析[J]. 统计与信息论坛, 2011, 26(2):65-72.
|
| [26] |
|
| [27] |
丛海彬, 高长春. 城市创意产业支撑环境评价研究[J]. 城市发展研究, 2011, 18(4):77-83.
|
| [28] |
|
| [29] |
郭新茹, 顾江, 陈天宇. 文化产业集聚、空间溢出与区域创新能力[J]. 江海学刊, 2019(6):77-83.
|
| [30] |
|
| [31] |
|
| [32] |
贺达, 顾江. 地方政府文化财政支出竞争与空间溢出效应——基于空间计量模型的实证研究[J]. 财经论丛, 2018(6):12-23.
|
| [33] |
陈红霞, 杨洋, 郭文文. 基于产业关联的北京市文化创意产业相对地位评价[J]. 城市发展研究, 2017, 24(7):56-62.
|
| [34] |
任英华, 沈凯娇, 游万海. 不同空间权重矩阵下文化产业集聚机制和溢出效应——基于2004—2011年省际面板数据的实证[J]. 统计与信息论坛, 2015, 30(2):82-87.
|
| [35] |
肖博华, 李忠斌. 民族地区文化产业集聚度测算及影响因素分析[J]. 中国人口·资源与环境, 2013, 23(S1):32-37.
|
| [36] |
魏和清, 李颖. 我国文化产业聚集特征及溢出效应的空间计量分析[J]. 江西财经大学学报, 2016(6):27-36.
|
/
| 〈 |
|
〉 |