
研发要素流动的时空特征及对中国经济高质量发展的影响
|
王兵(1991—),男,河南濮阳人,博士研究生,研究方向为全球化与中国区域经济发展。E-mail:dg1802036@smail.nju.edu.cn |
收稿日期: 2021-03-04
修回日期: 2021-09-17
网络出版日期: 2025-04-17
基金资助
国家社会科学基金重大项目(20&ZD123)
国家自然科学基金面上项目(72073061)
国家社会科学基金青年项目(20CJL034)
南京大学博士研究生创新创意研究计划项目(CXCY19-20)
江苏省软科学项目(BR2021055)
Spatio-temporal Characteristics of the R&D Element Flow and Its Impact on the High-quality Development of China's Economy
Received date: 2021-03-04
Revised date: 2021-09-17
Online published: 2025-04-17
王兵 , 徐霞 , 吴福象 . 研发要素流动的时空特征及对中国经济高质量发展的影响[J]. 经济地理, 2021 , 41(11) : 9 -18 . DOI: 10.15957/j.cnki.jjdl.2021.11.002
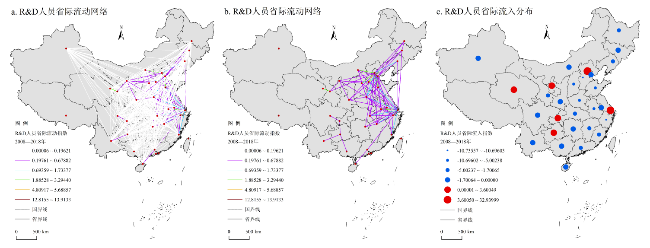
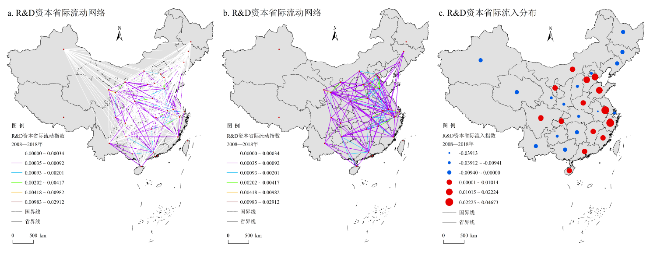
Innovation-driven development is a major strategy in the transformation phase of old-new driving force of China's economic growth. R&D elements, as important factors that participate in the innovation process, affect innovation performance and reflect innovation results,are the key to high-quality economic development. This study uses the logarithmic dual gravity model to calculate the inter-provincial flow index of R&D elements from 2008 to 2018, and describes its spatio-temporal characteristics and the status quo of geographic differentiation. Based on the dynamic spatial Dubin model, it analyzes its spatial effects on high-quality economic development. The results are showed that: Firstly, the inter-provincial flow of R&D elements has strong network characteristics and a certain degree of "core-periphery" characteristics. Secondly,its impact on the high-quality economic development is also affected by "inertia effect","demonstration effect" and "restriction effect", it shows a certain degree of heterogeneity across the whole country and on both sides of the "HU Huanyong Line". It puts forward some suggestions for solving the dilemma of innovation elements' spatial flow in the both sides of the "HU Huanyong Line" and realizing regional coordination and high-quality development,which include establishing cooperation-oriented inter-provincial links,guiding the orderly flow of R&D elements, taking into account local R&D element cultivation and international R&D element introduction, and promoting the convergence of R&D elements in the central and western regions.
表1 历年R&D要素流动指数的基尼系数Tab.1 Gini coefficient of the flow index of R&D elements over the years |
| 年份 | R&D人员 流动指数 的相对GN | R&D人员 流动指数 的绝对GN | R&D资本 流动指数 的相对GN | R&D资本 流动指数 的绝对GN |
|---|---|---|---|---|
| 2008 | 0.798 | 0.624 | 0.875 | 0.564 |
| 2009 | 0.727 | 0.615 | 0.819 | 0.603 |
| 2010 | 0.728 | 0.631 | 0.777 | 0.607 |
| 2011 | 0.758 | 0.681 | 0.702 | 0.585 |
| 2012 | 0.744 | 0.684 | 0.691 | 0.565 |
| 2013 | 0.759 | 0.684 | 0.686 | 0.536 |
| 2014 | 0.740 | 0.667 | 0.644 | 0.539 |
| 2015 | 0.756 | 0.668 | 0.647 | 0.526 |
| 2016 | 0.755 | 0.660 | 0.637 | 0.505 |
| 2017 | 0.793 | 0.681 | 0.703 | 0.537 |
| 2018 | 0.835 | 0.661 | 0.697 | 0.499 |
表2 历年R&D要素及其流入指数的全局莫兰指数Tab.2 Global Moran's index of R&D elements and their inflow index over the years |
| 年份 | R&D人员的GMI | R&D人员流入 指数的GMI | R&D资本的GMI | R&D资本流入 指数的GMI |
|---|---|---|---|---|
| 2008 | 0.018(1.484) | -0.098*(-1.935) | 0.026*(1.680) | -0.163***(-3.616) |
| 2009 | 0.038**(2.044) | -0.084(-1.481) | 0.031*(1.824) | -0.150***(-3.237) |
| 2010 | 0.037**(2.025) | -0.078(-1.297) | 0.034*(1.906) | -0.154***(-3.321) |
| 2011 | 0.036**(2.003) | -0.113**(-2.369) | 0.035*(1.943) | -0.156***(-3.330) |
| 2012 | 0.030*(1.870) | -0.112**(-2.361) | 0.036**(1.965) | -0.159***(-3.408) |
| 2013 | 0.041**(2.163) | -0.103**(-2.087) | 0.036**(1.981) | -0.151***(-3.144) |
| 2014 | 0.048**(2.345) | -0.114**(-2.434) | 0.037**(2.009) | -0.148***(-3.052) |
| 2015 | 0.055**(2.529) | -0.100**(-1.991) | 0.039**(2.043) | -0.141***(-2.870) |
| 2016 | 0.127***(4.432) | -0.098*(-1.941) | 0.056**(2.523) | -0.138***(-2.774) |
| 2017 | 0.052**(2.439) | -0.105**(-2.131) | 0.053**(2.449) | -0.134***(-2.689) |
| 2018 | 0.040**(2.158) | -0.123***(-2.726) | 0.053**(2.442) | -0.134***(-2.689) |
注:***、**、*分别表示双尾检验下1%、5%、10%的显著性水平;括号内数字为z统计量。表4同。 |
表3 考虑R&D要素流动的动态空间杜宾模型估计结果Tab.3 Estimation results of DSDM considering the inflow of R&D elements |
| 变量 | 被解释变量Y:lngdp | 被解释变量Y:urban_w | 被解释变量Y:rural_w | |||||
|---|---|---|---|---|---|---|---|---|
| 模型(1) | 模型(2) | 模型(3) | 模型(4) | 模型(5) | 模型(6) | |||
| frdp | 0.001**(2.51) | -0.048(-0.55) | 0.199(1.44) | |||||
| frdc | 0.683***(3.91) | -82.880(-1.39) | -373.082***(-3.80) | |||||
| absfrdp | 0.000(0.05) | -0.056(-0.50) | 0.070(0.36) | |||||
| absfrdc | 0.091(0.48) | -132.416**(-2.30) | -101.061(-1.02) | |||||
| L.lnY | 0.881***(37.14) | 0.914***(36.99) | 0.727***(16.26) | 0.722***(15.91) | 0.687***(16.33) | 0.739***(16.76) | ||
| L.W×lnY | -0.091***(-3.16) | -0.107***(-3.31) | -0.210***(-4.76) | -0.224***(-5.08) | -0.176***(-5.27) | -0.187***(-5.36) | ||
| W×frdp | -0.001***(-3.95) | 0.211**(2.07) | -0.131(-0.80) | |||||
| W×frdc | -0.251(-0.74) | -190.409*(-1.68) | 281.92(1.52) | |||||
| W×absfrdp | -0.001**(-2.45) | 0.287**(2.40) | -0.098(-0.48) | |||||
| W×absfrdc | -0.115(-0.39) | 73.972(0.77) | 61.250(0.37) | |||||
| ρ | 0.158***(6.24) | 0.149***(5.53) | 0.063*(1.70) | 0.746**(2.07) | 0.167***(6.94) | 0.155***(6.07) | ||
| 省份固定效应 | 是 | 是 | 是 | 是 | 是 | 是 | ||
| Log-L | 928.9421 | 909.6419 | -818.9703 | -816.9702 | -965.4360 | -981.0363 | ||
| R2 | 0.9980 | 0.9978 | 0.5554 | 0.5604 | 0.6388 | 0.6079 | ||
注:***、**和*分别表示在1%、5%和10%的显著性水平上显著,括号内为z统计量,Log-L为Log-likelihood值,L.Y表示被解释变量Y的滞后一期,L.W×Y表示滞后一期Y的空间滞后项,样本量为300。限于篇幅,表中未报告常规变量和控制变量的参数估计结果,留存备索。 |
表4 R&D要素流动对经济高质量发展的短期与长期直接效应和间接效应Tab.4 Effects of R&D element flow on the high-quality economic development |
| 变量 | 效应类型 | lngdp | urban_w | rural_w |
|---|---|---|---|---|
| frdp | 短期直接效应 | 0.000(1.46) | -0.028(-0.33) | 0.197(1.36) |
| 短期间接效应 | -0.010***(-2.68) | 0.896*(1.94) | -0.605(-0.44) | |
| 长期直接效应 | 0.012(0.05) | -0.329(-0.93) | 0.686(1.59) | |
| 长期间接效应 | 0.309(0.05) | 1.212**(2.06) | -1.192(-0.65) | |
| frdc | 短期直接效应 | 0.657***(3.08) | -92.432(-1.48) | -327.072***(-2.69) |
| 短期间接效应 | -1.045(-0.41) | -818.369(-1.57) | 1 650.063(1.11) | |
| 长期直接效应 | 5.820(0.23) | -191.999(-0.85) | -1 200.281(-3.87) | |
| 长期间接效应 | -23.840(-0.08) | -750.345(-1.32) | 2 849.178(1.48) | |
| absfrdp | 短期直接效应 | -0.000(-0.30) | -0.025(-0.22) | 0.081(0.39) |
| 短期间接效应 | -0.007**(-1.97) | 1.307**(2.10) | -0.360(-0.22) | |
| 长期直接效应 | -0.003(-0.04) | -0.401(-0.95) | 0.364 (0.52) | |
| 长期间接效应 | -0.029(-0.03) | 1.615**(2.56) | -0.697(-0.33) | |
| absfrdc | 短期直接效应 | 0.078(0.38) | -128.125**(-2.15) | -92.145(-0.81) |
| 短期间接效应 | -0.659(-0.32) | 282.195(0.63) | 325.395(0.27) | |
| 长期直接效应 | 0.968(0.07) | -583.525***(-2.60) | -401.293(-1.07) | |
| 长期间接效应 | -18.521(-0.06) | 712.956(1.51) | 692.287(0.42) |
| [1] |
吴福象, 蔡悦. 中国产业布局调整的福利经济学分析[J]. 中国社会科学, 2014(2):96-115,206.
|
| [2] |
王兵, 吴福象. 创新空间扩散、集聚租金与经济高质量发展[J]. 审计与经济研究, 2021(4):117-127.
|
| [3] |
欧进锋, 许抄军, 刘雨骐. 基于“五大发展理念”的经济高质量发展水平测度——广东省21个地级市的实证分析[J]. 经济地理, 2020, 40(6):77-86.
|
| [4] |
金碚. 关于“高质量发展”的经济学研究[J]. 中国工业经济, 2018(4):5-18.
|
| [5] |
李静, 刘霞辉, 楠玉. 提高企业技术应用效率加强人力资本建设[J]. 中国社会科学, 2019(6):63-84.
|
| [6] |
杨伟中, 余剑, 李康. 金融资源配置、技术进步与经济高质量发展[J]. 金融研究, 2020(12):75-94.
|
| [7] |
陶长琪, 徐茉. 经济高质量发展视阈下中国创新要素配置水平的测度[J]. 数量经济技术经济研究, 2021(2):1-20.
|
| [8] |
|
| [9] |
唐未兵, 傅元海, 王展祥. 技术创新、技术引进与经济增长方式转变[J]. 经济研究, 2014, 49(7):31-43.
|
| [10] |
卓乘风, 邓峰. 创新要素流动与区域创新绩效:空间视角下政府调节作用的非线性检验[J]. 科学学与科学技术管理, 2017, 38(7):15-26.
|
| [11] |
吴福象, 沈浩平. 新型城镇化、创新要素空间集聚与城市群产业发展[J]. 中南财经政法大学学报, 2013(4):36-42.
|
| [12] |
|
| [13] |
白俊红, 王钺, 蒋伏心, 等. 研发要素流动、空间知识溢出与经济增长[J]. 经济研究, 2017(7):109-123.
|
| [14] |
|
| [15] |
|
| [16] |
|
| [17] |
|
| [18] |
|
| [19] |
安虎森, 颜银根, 朴银哲. 城市高房价和户籍制度:促进或抑制城乡收入差距扩大?——中国劳动力流动和收入差距扩大悖论的一个解释[J]. 世界经济文汇, 2011(4):41-54.
|
| [20] |
吴延兵. R&D存量、知识函数与生产效率[J]. 经济学(季刊), 2006, 5(4):1129-1156.
|
| [21] |
王小鲁, 樊纲, 胡李鹏. 中国分省份市场化指数报告(2018)[M]. 北京: 社会科学文献出版社, 2019.
|
| [22] |
|
| [23] |
|
| [24] |
陈志鸿, 李扬. 中国分区域城镇居民福利水平测度[J]. 财经研究, 2018(10):111-124.
|
| [25] |
单豪杰. 中国资本存量K的再估算:1952—2006年[J]. 数量经济技术经济研究, 2008(10):17-31.
|
| [26] |
马光荣, 程小萌, 杨恩艳. 交通基础设施如何促进资本流动——基于高铁开通和上市公司异地投资的研究[J]. 中国工业经济, 2020(6):5-23.
|
| [27] |
王兵, 吴福象. 行业工资率差异、就业份额偏离与产业结构升级——基于省级面板数据的GMM分析[J]. 山西财经大学学报, 2019(5):40-53.
|
| [28] |
钟粤俊, 陆铭, 奚锡灿. 集聚与服务业发展——基于人口空间分布的视角[J]. 管理世界, 2020(11):35-49.
|
| [29] |
|
| [30] |
韩峰, 阳立高. 生产性服务业集聚如何影响制造业结构升级?——一个集聚经济与熊彼特内生增长理论的综合框[J]. 管理世界, 2020(2):72-94.
|
| [31] |
|
| [32] |
程名望, 贾晓佳, 俞宁. 农村劳动力转移对中国经济增长的贡献(1978-2015):模型与实证[J]. 管理世界, 2018(10):161-172.
|
| [33] |
吴福象, 王兵. “自然”本性、“一带一路”建设与供应链地理重塑[J]. 河北学刊, 2021(1):140-147.
|
/
| 〈 |
|
〉 |