
生产性服务业集聚空间效应与城市技术创新——基于长江经济带108个城市面板数据的实证分析
|
李勇辉(1969—),男,湖南永州人,博士,教授,博士生导师,研究方向为区域金融与产业发展。E-mail:jimlyh@163.com |
收稿日期: 2021-03-13
修回日期: 2021-09-22
网络出版日期: 2025-04-17
基金资助
湖南省教育厅2017年科学研究重点课题(17A034)
Spatial Effect of Producer Services Agglomeration and Urban Technological Innovation:Empirical Analysis Based on Panel Data of 108 Cities in the Yangtze River Economic Belt
Received date: 2021-03-13
Revised date: 2021-09-22
Online published: 2025-04-17
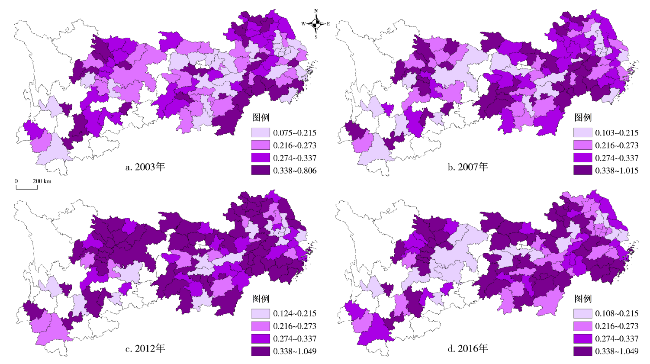
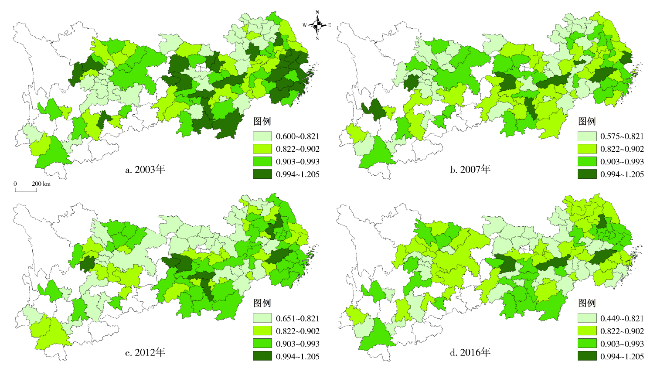
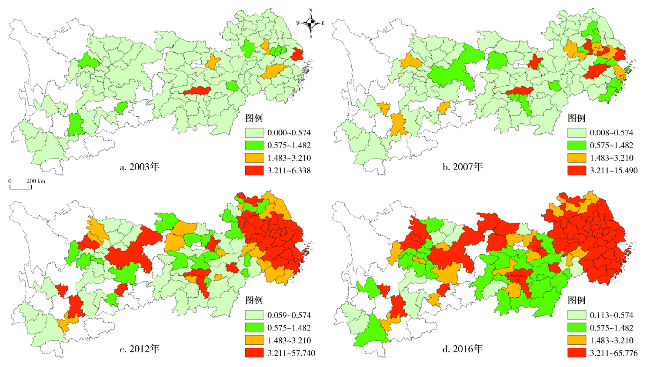
采用长江经济带108个城市2003—2016年的面板数据,通过构建生产性服务业的空间集聚测度模型,绘制专业化集聚、多样化集聚及城市技术创新的时空演化趋势图,检验长江经济带城市群创新的空间关联性,采用空间杜宾面板计量模型实证研究生产性服务业集聚对城市技术创新的直接效应与空间溢出效应,得到如下结果:①长江经济带各城市生产性服务业专业化、多样化集聚程度以及技术创新水平均呈现出明显的空间异质性与非均衡性,并且存在显著的空间自相关性。②生产性服务业专业化集聚对本地城市技术创新具有显著正向作用,并通过空间关联对其邻近城市创新产生了正向空间溢出效应。多样化集聚不利于本地城市技术创新发展,也对其邻近城市创新存在负向空间溢出。③从地理区位差异视角来看,生产性服务业专业化集聚显著推动了内陆城市技术创新进步,而多样化集聚对其邻近城市创新产生了负向空间溢出效应;从经济发展地区差异视角来看,生产性服务业专业化集聚显著推动了经济发达城市创新发展,但多样化集聚对经济发达城市创新产生了明显抑制作用。文章对于城市依托生产性服务业集聚促进自身技术创新水平提升、推动城市群跨地域创新活动开展,进而实现长江经济带高质量发展具有重要意义。
李勇辉 , 沈波澜 , 胡舜 , 林森 . 生产性服务业集聚空间效应与城市技术创新——基于长江经济带108个城市面板数据的实证分析[J]. 经济地理, 2021 , 41(11) : 65 -76 . DOI: 10.15957/j.cnki.jjdl.2021.11.008
Based on the panel data of 108 cities in the Yangtze River Economic Belt (YREB) from 2003 to 2016,this paper builds a spatial agglomeration measurement model of producer services,analyzes the spatiotemporal evolution of specialized agglomeration,diversified agglomeration and urban technological innovation,and tests the spatial correlation of innovation in urban agglomeration of the YREB. This paper adopts spatial Durbin panel measurement model to empirically research the direct effect and spatial spillover effects of producer services agglomeration on the urban technology innovation,and obtains the following results: 1) The specialized and diversified agglomeration of producer service and technological innovation level in the cities of the Yangtze River Economic Belt reflect obvious spatial heterogeneity and imbalance,and there is significant spatial autocorrelation. 2) Specialized agglomeration has a significant positive effect on the technological innovation of local cities,and has a positive spatial spillover effect on the innovation of neighboring cities through spatial association. Diversified agglomeration is not conducive to the development of technological innovation in local cities,but also has negative spatial spillover on the innovation of neighboring cities. 3) From the perspective of geographic location differences,the specialized agglomeration of producer services significantly promotes the development of technological innovation in inland cities,while the diversified agglomeration has a negative spillover effect on the technological innovation in its neighboring cities. From the perspective of regional differences in economic development,the specialized agglomeration of producer services has significantly promoted the innovation of developed cities,but diversified agglomeration has significantly inhibited innovation in developed cities. The above research is of great significance to cities relying on producer services agglomeration to promote the improvement of the city's own technological innovation level,promote the development of cross-regional innovation activities in urban agglomeration,and then realize the high-quality development of the Yangtze River Economic Belt.
表1 变量定义与描述性统计Tab.1 Variable definitions and descriptive statistics |
| 变量类别 | 变量名称 | 具体定义 | 样本量 | 均值 | 标准差 | 最小值 | 最大值 |
|---|---|---|---|---|---|---|---|
| 被解释变量 | 城市技术创新水平(INNO) | 每万人发明专利申请数 | 1 512 | 3.41 | 8.19 | 0.00 | 77.23 |
| 核心解释变量 | 生产性服务业专业化集聚(RZI) | 指数测算 | 1 512 | 0.08 | 0.03 | 0.01 | 0.34 |
| 生产性服务业多样化集聚(RDI) | 指数测算 | 1 512 | 0.87 | 0.10 | 0.45 | 1.21 | |
| 控制变量 | 科教投入水平(SFE) | 科技与教育支出/财政支出 | 1 512 | 0.03 | 0.02 | 0.01 | 0.11 |
| 人力资本水平(EDU) | 每万人大学生数量 | 1 512 | 8.23 | 15.21 | 0.00 | 96.21 | |
| 产业结构(STRU) | 第三产业GDP/第二产业GDP | 1 512 | 0.81 | 0.32 | 0.27 | 3.17 | |
| 外资引进水平(FDI) | 外商直接投资金额/GDP | 1 512 | 0.02 | 0.02 | 0.00 | 0.20 | |
| 人口集聚程度(POP) | 每平方公里的人口数量 | 1 512 | 481.97 | 294.62 | 52.73 | 2 284.06 |
表2 长江经济带城市群创新产出的空间自相关检验Tab.2 Spatial autocorrelation test of innovation output in urban agglomerations along the Yangtze River Economic Belt |
| 指标 | 年份 | Moran's I值 | Z值 | P值 |
|---|---|---|---|---|
| 城市技术 创新水平 | 2003 | 0.011 | 0.604 | 0.546 |
| 2007 | 0.197*** | 7.020 | 0.000 | |
| 2012 | 0.668*** | 21.018 | 0.000 | |
| 2016 | 0.800*** | 24.213 | 0.000 |
注:***、**和*分别表示在1%、5%和10%的统计水平上显著。 |
表3 生产性服务业集聚对城市技术创新的影响及空间外溢效应:全样本Tab.3 Direct effect and spatial spillover effect of producer services agglomeration on urban technological innovation: full sample |
| 效应 | 变量 | SDM | FE | |||
|---|---|---|---|---|---|---|
| (1) | (2) | (3) | (4) | |||
| 直接效应 | ln RZI | 0.146***(2.631) | 0.210***(3.422) | |||
| ln RDI | -0.408**(-2.299) | -0.216(-1.082) | ||||
| ln SFE | -0.152(-1.361) | -0.178(-1.598) | 0.011(0.088) | -0.030(-0.236) | ||
| ln EDU | 0.135***(3.105) | 0.123***(2.822) | 0.061(1.104) | 0.045(0.817) | ||
| ln STRU | -0.686***(-7.498) | -0.699***(-7.610) | -0.114(-1.235) | -0.120(-1.288) | ||
| ln FDI | 0.060***(3.309) | 0.060***(3.300) | 0.052**(2.469) | 0.052**(2.457) | ||
| ln POP | -1.044**(-2.187) | -0.958**(-2.040) | -2.841***(-5.918) | -2.903***(-6.025) | ||
| 间接效应 | ln RZI | 2.468*(1.912) | ||||
| ln RDI | -5.447*(-1.745) | |||||
| ln SFE | 2.768**(2.339) | 2.283(1.625) | ||||
| ln EDU | -1.658***(-2.745) | -1.662***(-2.630) | ||||
| ln STRU | -2.201**(-2.413) | -1.985**(-2.071) | ||||
| ln FDI | -0.363**(-2.415) | -0.391**(-2.462) | ||||
| ln POP | 47.167***(3.940) | 44.044***(3.624) | ||||
| R2 | 0.074 | 0.080 | 0.861 | 0.860 | ||
| Obs | 1512 | 1512 | 1512 | 1512 | ||
表4 生产性服务业集聚影响城市技术创新的空间效应分解:地理区位差异Tab.4 Decomposition of spatial effect of producer services agglomeration on urban technological innovation: differences in geographical location |
| 效应 | 变量 | 沿海城市 | 内陆城市 | |||
|---|---|---|---|---|---|---|
| (1) | (2) | (3) | (4) | |||
| 直接效应 | ln RZI | 0.170(1.531) | 0.188***(2.926) | |||
| ln RDI | 0.118(0.267) | -0.129(-0.590) | ||||
| ln SFE | 0.581**(2.467) | 0.500**(2.061) | -0.237*(-1.778) | -0.329**(-2.547) | ||
| ln EDU | 0.601***(6.058) | 0.571***(5.816) | 0.083*(1.704) | 0.063(1.307) | ||
| ln STRU | -1.472***(-4.754) | -1.529***(-4.825) | -0.467***(-4.060) | -0.487***(-4.330) | ||
| ln FDI | -0.128**(-2.204) | -0.152***(-2.638) | 0.063***(3.157) | 0.059***(2.987) | ||
| ln POP | -1.629***(-2.675) | -1.767***(-2.794) | -0.411(-0.671) | -0.143(-0.240) | ||
| 间接效应 | ln RZI | -0.995(-0.947) | 1.294(1.387) | |||
| ln RDI | 0.708(0.557) | -16.671***(-4.429) | ||||
| ln SFE | -0.506(-0.489) | -1.146(-1.023) | 4.135***(3.477) | 0.308(0.224) | ||
| ln EDU | 1.894*(1.860) | 1.702*(1.696) | -0.142(-0.299) | -0.691(-1.569) | ||
| ln STRU | -3.832**(-2.082) | -4.363**(-2.296) | -1.660*(-1.651) | -1.380(-1.342) | ||
| ln FDI | -0.140(-0.451) | -0.162(-0.511) | -0.373***(-2.907) | -0.636***(-4.178) | ||
| ln POP | -4.967(-0.565) | -2.570(-0.288) | 43.799***(4.779) | 41.159***(4.358) | ||
| R2 | 0.096 | 0.228 | 0.001 | 0.007 | ||
| Obs | 350 | 350 | 1162 | 1162 | ||
表5 生产性服务业集聚影响城市技术创新的空间效应分解:经济发展水平差异Tab.5 Decomposition of spatial effect of producer services agglomeration on urban technological innovation: differences in economic development levels |
| 效应 | 变量 | 经济发达城市 | 经济欠发达城市 | |||
|---|---|---|---|---|---|---|
| (1) | (2) | (3) | (4) | |||
| 直接效应 | ln RZI | 0.148**(2.253) | 0.129(1.592) | |||
| ln RDI | -0.482*(-1.732) | -0.296(-1.330) | ||||
| ln SFE | 0.248(1.515) | 0.164(1.022) | -0.183(-1.273) | -0.203(-1.414) | ||
| ln EDU | 0.494***(4.128) | 0.433***(3.605) | 0.080(1.639) | 0.074(1.507) | ||
| ln STRU | -0.598***(-3.130) | -0.555***(-2.796) | -0.296**(-2.396) | -0.315**(-2.530) | ||
| ln FDI | -0.152***(-3.103) | -0.171***(-3.541) | 0.057***(2.782) | 0.060***(2.915) | ||
| ln POP | -2.382***(-4.680) | -2.447***(-4.555) | -0.209(-0.287) | -0.188(-0.260) | ||
| 间接效应 | ln RZI | -0.610(-0.621) | 0.974(1.023) | |||
| ln RDI | -2.622(-0.927) | -2.309(-1.031) | ||||
| ln SFE | 1.111(0.750) | 0.213(0.140) | 2.121**(2.050) | 1.969(1.592) | ||
| ln EDU | -1.523(-0.820) | -3.012(-1.435) | -0.522(-1.203) | -0.551(-1.256) | ||
| ln STRU | -8.808***(-3.143) | -9.180***(-3.109) | -3.186***(-3.042) | -3.101***(-2.851) | ||
| ln FDI | -1.260***(-2.638) | -1.387***(-2.667) | -0.397***(-3.219) | -0.431***(-3.506) | ||
| ln POP | 8.706(1.110) | 15.135*(1.866) | 55.024***(5.443) | 53.009***(5.084) | ||
| R2 | 0.068 | 0.107 | 0.010 | 0.011 | ||
| Obs | 518 | 518 | 994 | 994 | ||
| [1] |
陈长石, 姜廷廷, 刘晨晖. 产业集聚方向对城市技术创新影响的实证研究[J]. 科学学研究, 2019, 37(1):77-85.
|
| [2] |
韩峰, 严伟涛, 王业强. 生产性服务业集聚与城市环境质量升级——基于土地市场调节效应的研究[J]. 统计研究, 2021, 38(5):42-54.
|
| [3] |
刘志彪. 现代服务业的发展:决定因素与政策[J]. 江苏社会科学, 2005(6):207-212.
|
| [4] |
|
| [5] |
|
| [6] |
|
| [7] |
|
| [8] |
吴玉鸣. 中国区域研发、知识溢出与创新的空间计量经济研究[M]. 北京: 人民出版社, 2007.
|
| [9] |
彭向, 蒋传海. 产业集聚、知识溢出与地区创新——基于中国工业行业的实证检验[J]. 经济学(季刊), 2011, 10(3):913-934.
|
| [10] |
刘乃全, 吴友, 赵国振. 专业化集聚、多样化集聚对区域创新效率的影响——基于空间杜宾模型的实证分析[J]. 经济问题探索, 2016(2):89-96.
|
| [11] |
郭星原. 我国生产性服务业集聚对区域技术进步的影响——基于空间经济学视角[J]. 商业经济研究, 2020(24):189-192.
|
| [12] |
|
| [13] |
|
| [14] |
|
| [15] |
|
| [16] |
韩峰, 洪联英, 文映. 生产性服务业集聚推进城市化了吗?[J]. 数量经济技术经济研究, 2014, 31(12):3-21.
|
| [17] |
|
| [18] |
|
| [19] |
余泳泽, 刘大勇, 宣烨. 生产性服务业集聚对制造业生产效率的外溢效应及其衰减边界——基于空间计量模型的实证分析[J]. 金融研究, 2016(2):23-36.
|
| [20] |
于斌斌, 吴丹. 生产性服务业集聚如何提升制造业创新效率?——基于集聚外部性的理论分析与实证检验[J]. 科学决策, 2021(3):18-35.
|
| [21] |
刘胜, 李文秀, 陈秀英. 生产性服务业与制造业协同集聚对企业创新的影响[J]. 广东财经大学学报, 2019, 34(3):43-53.
|
| [22] |
|
| [23] |
张天华, 陈博潮, 雷佳祺. 经济集聚与资源配置效率:多样化还是专业化[J]. 产业经济研究, 2019(5):51-64.
|
| [24] |
纪祥裕, 唐荣. 地方经济增长目标会影响技术创新吗[J]. 山西财经大学学报, 2021, 43(6):70-83.
|
| [25] |
|
| [26] |
|
| [27] |
|
| [28] |
|
/
| 〈 |
|
〉 |