
基于网络关注度的中国城市家政服务需求时空演变及影响因素
|
鄢继尧(1997—),男,四川成都人,博士研究生,研究方向为经济地理与区域规划。E-mail:njnuyanjiyao@qq.com |
收稿日期: 2021-03-27
修回日期: 2021-07-22
网络出版日期: 2025-04-17
基金资助
国家社会科学基金项目(20BSH116)
Spatiotemporal Evolution and Influencing Factors of Urban Domestic Service Demand in China:Based on Network Attention
Received date: 2021-03-27
Revised date: 2021-07-22
Online published: 2025-04-17
鄢继尧 , 赵媛 , 许昕 , 崔盼盼 , 祝孔超 . 基于网络关注度的中国城市家政服务需求时空演变及影响因素[J]. 经济地理, 2021 , 41(11) : 56 -64 . DOI: 10.15957/j.cnki.jjdl.2021.11.007
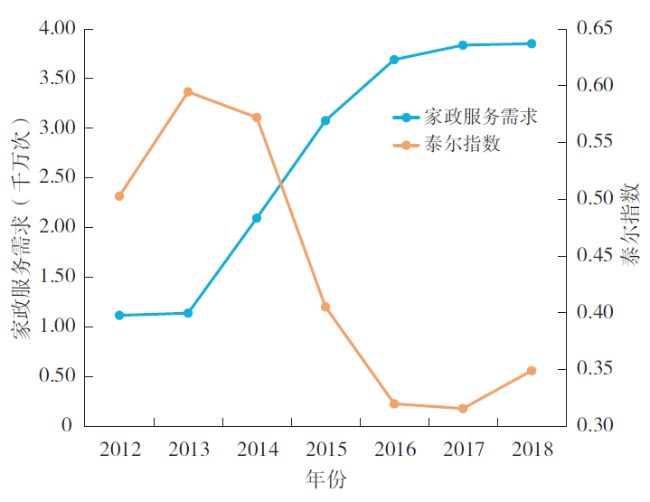
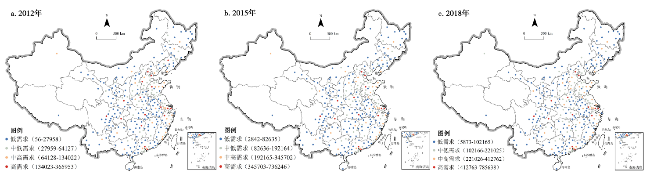
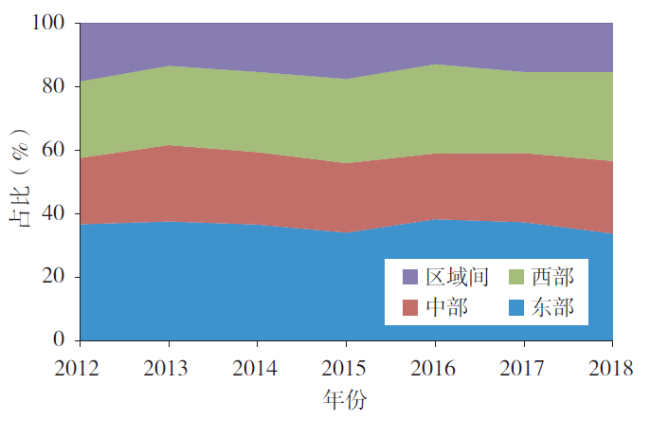
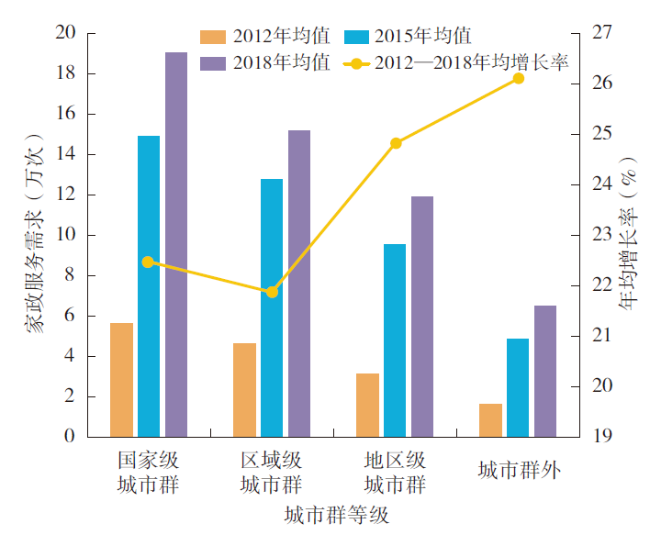
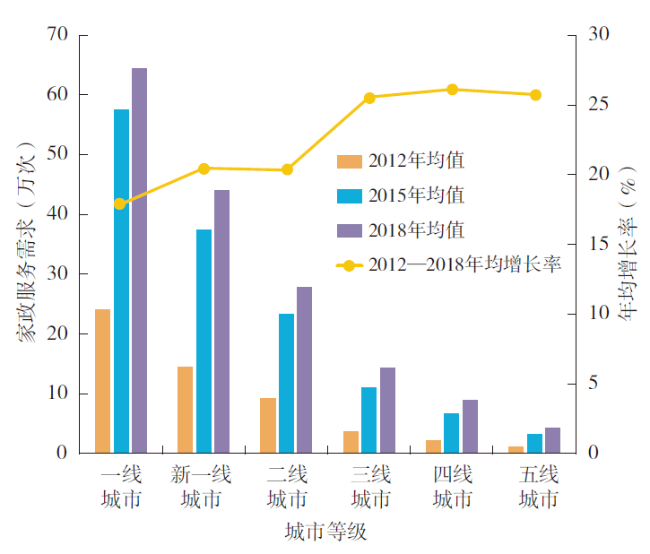
Domestic service industry plays an important role in improving people's life quality,promoting employment,and expanding domestic demands. Based on the domestic service demand data collected by Baidu Index,this paper measures the spatiotemporal evolution characteristics of domestic service demand in 285 cities of China from 2012 to 2018 at multiple scales,and uses multiple linear regression model to quantitatively explore its influencing factors. The results are as follows: 1) Urban domestic service demand in China is increasing year by year from 2012 to 2018,and the regional difference is narrowing,which could be divided into two stages: "rapid growth stage" and "high stability stage". At the same time,the demand for urban domestic service is dominated by low and medium-low type, and shows an obvious "core-periphery" characteristics with the central city as the core. 2) The domestic service demand in cities of China presents declining trend from the eastern China to the western China. The intraregional difference is always greater than that of the interregional. The domestic service demand shows an inverted pyramid cluster growth characteristics at different types of urban agglomerations,which the order from high to low is the national-level urban agglomerations,the regional-level urban agglomerations,the provincial-level urban agglomerations,the areas surrounding the urban agglomerations,and forms a hierarchical structure at different-tier cities,which the order from high to low is first-tier cities,new first-tier cities,second-tier cities,third-tier cities,fourth-tier cities,fifth-tier cities. 3) Supply and demand conditions affect the demand of domestic service together. The economic development level and industrial structure affect the supply scale and quality of domestic services,while the population size,residents' consumption and income level affect the demand scale and residents' payable ability. Finally,this paper discusses how to improve the domestic service consumption demand and expand domestic demand,in order to provide theoretical basis and practical reference for promoting the quality and capacity of domestic service industry and implementing the strategy of expanding domestic demand.
表1 中国城市家政服务需求时空分异的解释变量Tab.1 Explanatory variables of urban domestic service demand in China |
| 因素 | 解释变量 |
|---|---|
| 供给条件 | 居民服务、修理与其他服务业城镇从业人员数(X1) |
| 人均GDP(X2) | |
| 人均财政收入(X3) | |
| 第三产业占GDP比重(X4) | |
| 区域创新创业指数(X5) | |
| 需求条件 | 常住人口数(X6) |
| 灯光指数(X7) | |
| 城镇居民可支配收入(X8) | |
| 人均社会消费品零售额(X9) | |
| 在岗职工平均人数(X10) | |
| 从业人员高级度(X11) |
图4 2012—2018年中国不同等级城市群家政服务需求均值及其增长率Fig.4 Average demand and growth rate of domestic service in different level urban agglomerations in China from 2012 to 2018 |
表2 2012—2018年中国各城市群家政服务需求均值及其增长率Tab.2 Average demand and growth rate of domestic service in different urban agglomerations in China from 2012 to 2018 |
| 城市群 地位 | 所属 城市群 | 2012 (万次) | 2015 (万次) | 2018 (万次) | 2012—2018 均增长率(%) |
|---|---|---|---|---|---|
| 国家级 | 京津冀 | 9.934 | 22.673 | 24.951 | 16.590 |
| 长三角 | 6.894 | 17.89 | 21.910 | 21.254 | |
| 珠三角 | 8.025 | 24.118 | 29.776 | 24.425 | |
| 长江中游 | 3.261 | 8.509 | 12.682 | 25.405 | |
| 成渝 | 2.944 | 9.741 | 14.655 | 30.670 | |
| 区域级 | 哈长 | 4.709 | 11.834 | 14.330 | 20.382 |
| 辽中南 | 4.545 | 11.102 | 12.286 | 18.025 | |
| 山东半岛 | 6.192 | 17.22 | 19.857 | 21.437 | |
| 海峡西岸 | 5.525 | 14.458 | 17.966 | 21.716 | |
| 中原 | 4.346 | 12.288 | 14.233 | 21.862 | |
| 关中平原 | 3.259 | 9.918 | 12.533 | 25.166 | |
| 北部湾 | 2.470 | 9.212 | 11.909 | 29.978 | |
| 天山北坡 | 8.020 | 20.612 | 22.103 | 18.407 | |
| 地区级 | 呼包鄂榆 | 3.357 | 10.521 | 11.371 | 22.551 |
| 兰西 | 2.089 | 8.475 | 11.545 | 32.962 | |
| 滇中 | 4.494 | 13.438 | 16.639 | 24.380 | |
| 黔中 | 2.857 | 9.394 | 13.900 | 30.174 | |
| 晋中 | 4.937 | 12.074 | 13.740 | 18.600 | |
| 宁夏沿黄 | 1.039 | 3.764 | 4.918 | 29.574 | |
| 城市群外 | 1.612 | 4.872 | 6.478 | 26.095 | |
表3 城市家政服务需求影响因素的回归估计结果Tab.3 Estimates of the regression equation on urban domestic service demand |
| 解释变量 | 全国 | 东部 | 中部 | 西部 | ||||||||
|---|---|---|---|---|---|---|---|---|---|---|---|---|
| 标准化 回归系数 | Sig. | 标准化 回归系数 | Sig. | 标准化 回归系数 | Sig. | 标准化 回归系数 | Sig. | |||||
| 供给条件 | 人均GDP | 0.2452 | 0.0001 | 0.2856 | 0.0001 | 0.1600 | 0.0026 | 0.1761 | 0.0144 | |||
| 第三产业占GDP比重 | 0.0728 | 0.0001 | 0.0385 | 0.1552 | 0.0576 | 0.0146 | 0.0094 | 0.7859 | ||||
| 需求条件 | 城镇居民可支配收入 | 0.1485 | 0.0001 | 0.2002 | 0.0001 | 0.1514 | 0.0002 | 0.1272 | 0.0025 | |||
| 人均社会消费品零售额 | 0.2625 | 0.0001 | 0.2141 | 0.0001 | 0.2280 | 0.0001 | 0.2202 | 0.0001 | ||||
| 常住人口数 | 0.2871 | 0.0001 | 0.3138 | 0.0001 | 0.1036 | 0.0076 | 0.0974 | 0.0001 | ||||
| 在岗职工平均人数 | 0.0839 | 0.0038 | 0.0200 | 0.6562 | 0.3973 | 0.0001 | 0.7369 | 0.0001 | ||||
| 从业人员高级度 | 0.0981 | 0.0001 | 0.1163 | 0.0001 | 0.0847 | 0.0001 | 0.1468 | 0.0001 | ||||
注:模型因变量是城市家政服务需求,全国、东部、中部、西部地区R2分别为0.8166、0.8359、0.8017、0.7922,P值均为0.001。 |
| [1] |
赵媛, 鄢继尧, 熊筱燕. 开展家政服务企业第三方评估,助推家政服务业提质扩容[J]. 家庭服务, 2020(6):56-59.
|
| [2] |
2019中国家政服务业商业模式与发展趋势探究[J]. 家庭服务, 2020(1):46-47.
|
| [3] |
|
| [4] |
|
| [5] |
|
| [6] |
|
| [7] |
孙学致, 王丽颖. 我国家政服务业规范化发展问题研究[J]. 经济纵横, 2020(5):115-120.
|
| [8] |
姜长云. 家庭服务业的产业特性[J]. 经济与管理研究, 2011(3):42-48.
|
| [9] |
|
| [10] |
杨毅晨. 上海市家政市场研究[D]. 上海: 复旦大学, 2008.
|
| [11] |
吴莹. 长春市家政服务业的市场规模及成长性分析[J]. 经济地理, 2006, 26(6):1014-1017.
|
| [12] |
莫容. 中国家政服务业发展报告(2018)[M]. 北京: 中国社会劳动保障出版社, 2018.
|
| [13] |
中华人民共和国国家互联网信息办公室. 《第47次中国互联网络发展状况统计报告》全文[R/OL]. http://www.cac.gov.cn/2021-02/03/c_1613923423079314.htm,2021-02-03.
|
| [14] |
|
| [15] |
阮文奇, 张舒宁, 李勇泉, 等. 中国赴泰旅游需求时空分异及其影响因素[J]. 旅游学刊, 2019, 34(5):76-89.
|
| [16] |
|
| [17] |
|
| [18] |
孙宇婷, 肖凡, 周勇, 等. 新型冠状病毒肺炎疫情公众关注度的时空差异与影响因素——基于百度搜索指数的分析[J]. 热带地理, 2020, 40(3):375-385.
|
| [19] |
刘维斯, 攸小瑾, 马晓薇, 等. 互联网搜索指数与埃博拉认知需求相关性分析[J]. 医学动物防制, 2020, 34(12):1146-1148,1151.
|
| [20] |
|
| [21] |
|
| [22] |
马丽君, 龙云. 基于网络关注度的湖南省居民旅游需求时空特征[J]. 经济地理, 2017, 37(2):201-208.
|
| [23] |
许艳, 陆林, 赵海溶. 乌镇景区网络关注度动态演变与空间差异分析[J]. 经济地理, 2020, 40(7):200-210.
|
| [24] |
鄢继尧, 赵媛, 熊筱燕, 等. 江苏省家政服务业发展区域差异及影响因素——基于网络大数据分析[J/OL]. 西华师范大学学报(自然科学版):1-10[2021-10-18]. http://kns.cnki.net/kcms/detail/51.1699.N.20211014.2209.008.html.
|
| [25] |
唐海秀. 促进我国家庭服务业发展的财税政策研究[D]. 北京: 财政部财政科学研究所, 2011.
|
| [26] |
陈颖彪, 郑子豪, 吴志峰, 等. 夜间灯光遥感数据应用综述和展望[J]. 地理科学进展, 2019, 38(2):205-223.
|
| [27] |
朱颖. 家务劳动社会化问题研究[J]. 重庆社会科学, 2019(11):101-109.
|
| [28] |
|
| [29] |
|
| [30] |
王振波, 梁龙武, 王旭静. 中国城市群地区PM2.5时空演变格局及其影响因素[J]. 地理学报, 2019, 74(12):2614-2630.
|
| [31] |
韩艳红, 尹上岗, 李在军. 长三角县域房价空间分异格局及其影响因素分析[J]. 人文地理, 2018, 33(6):87-95.
|
| [32] |
喻忠磊, 唐于渝, 张华, 等. 中国城市舒适性的空间格局与影响因素[J]. 地理研究, 2016, 35(9):1783-1798.
|
| [33] |
张晓青, 黄彩虹, 张强, 等. “单独二孩”与“全面二孩”政策家庭生育意愿比较及启示[J]. 人口研究, 2016, 40(1):87-97.
|
| [34] |
姚作林, 涂建军, 牛慧敏, 等. 成渝经济区城市群空间结构要素特征分析[J]. 经济地理, 2017, 37(1):82-89.
|
| [35] |
方创琳. 中国城市群研究取得的重要进展与未来发展方向[J]. 地理学报, 2014, 69(8):1130-1144.
|
| [36] |
周阳. 国家中心城市:概念、特征、功能及其评价[J]. 城市观察, 2012(1):132-142.
|
| [37] |
朱国林, 范建勇, 严燕. 中国的消费不振与收入分配:理论和数据[J]. 经济研究, 2002(5):72-80,95.
|
/
| 〈 |
|
〉 |