
中国农产品加工业的产业集聚演化实证
|
何伟纯(1992—),男,河南信阳人,博士研究生。主要研究方向为产业集聚与区域创新发展。E-mail:Heweichun1219@163.com。 |
收稿日期: 2018-11-18
修回日期: 2019-08-12
网络出版日期: 2025-04-17
基金资助
国家自然科学基金项目(41971222)
国家自然科学基金项目(41601120)
教育部人文社会科学重点研究基地重大项目(15JJDZONGHE008)
河南省自然科学基金项目(182300410144)
河南省哲学社会科学规划项目(2019BJJ019)
河南大学一流学科培育项目(2018YLTD16)
河南大学一流学科培育项目(2019YLZDYJ12)
Empirical Study on the Evolution of Industrial Agglomeration of China's Agricultural Products Processing Industry
Received date: 2018-11-18
Revised date: 2019-08-12
Online published: 2025-04-17
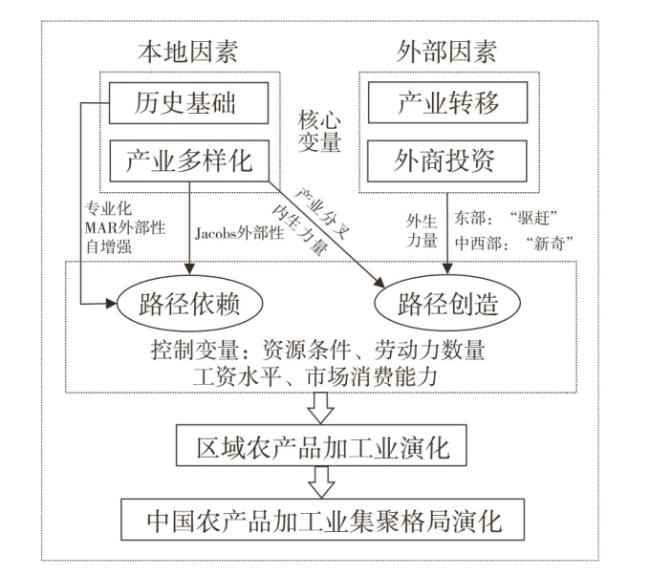
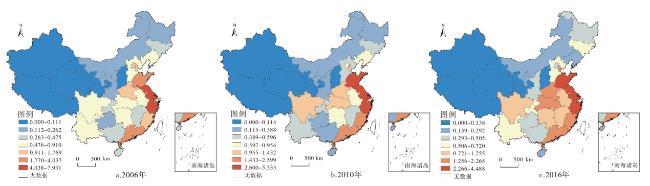
以2006—2016年中国(不包括港、澳、台地区)农产品加工业为例,从强调区域内外两方面因素出发,利用演化经济地理思维构建分析框架,探讨了产业集聚的演化机制。结果表明:①区域产业集聚演化是在区域内外部因素共同作用下路径依赖和路径创造的过程。②中国农产品加工业集聚水平的区域差异明显,地理集聚变化与产业转移高度相关;农产品加工业在中西部地区的集聚水平显著增强,表现出路径创造特征。分行业来看,中部地区对劳动力密集型农产品加工业的路径创造较为明显;长江中上游地区对原材料—资本密集型农产品加工业的路径创造突出,但烟草制品业集聚格局较为稳定,呈现出由区域路径锁定而导致的空间锁定特征。③对历史基础的依赖是影响农产品加工业集聚演化的关键,且是东部地区农产品加工业保持高水平集聚的最主要原因;产业转移显著推动了中西部地区农产品加工业的集聚;产业多样化与外商投资对农产品加工业集聚的影响存在明显的区域异质性,在东部表现为负向作用,在中西部表现为正向作用。
何伟纯 , 李二玲 . 中国农产品加工业的产业集聚演化实证[J]. 经济地理, 2019 , 39(11) : 94 -103 . DOI: 10.15957/j.cnki.jjdl.2019.11.012
Evolutionary economic geography provides a new research perspective for the evolution of regional industrial agglomeration, but it has been questioned by the academic circles because of overemphasizing the role of regional internal factors. Taking the agricultural product processing industry of China (excluding Hong Kong, Macao and Taiwan) from 2006 to 2016 as an example, this paper using evolutionary economic geography thinking to construct an analytical framework from internal and external factors to explore the geographic agglomeration pattern and evolution mechanism of industry. It show that: 1) The evolution of regional industrial agglomeration is a process of path dependence and path creation under the combined action of internal and external factors. 2) The regional difference of agglomeration level of agricultural products processing industry in China is obvious. The change of geographical agglomeration is highly correlated with industrial transfer. The agglomeration level of agricultural product processing industry in the central and western regions has increased significantly, showing the characteristics of path creation. In terms of sub-industries, the path creation of labor-intensive agricultural products processing industry is obvious in the central regions, and the path creation of raw material-capital intensive agricultural products processing industry is prominent in the middle and upper reaches of the Yangtze River. However, the agglomeration pattern of tobacco products industry is relatively stable, showing the characteristics of spatial locking caused by regional path locking. 3) Historical basics of agricultural product processing industry is the key factor for the agglomeration and evolution of agricultural product processing industry, it is the most important reason for the agglomeration of agricultural products processing industry in the eastern regions. Industrial transfer has significantly promoted the agglomeration of agricultural products processing industry in the central and western regions. The impact of industrial diversification and foreign investment on agricultural product processing industry agglomeration has obvious regional heterogeneity, showing a negative impact in the eastern regions and a positive impact in the central and western regions.
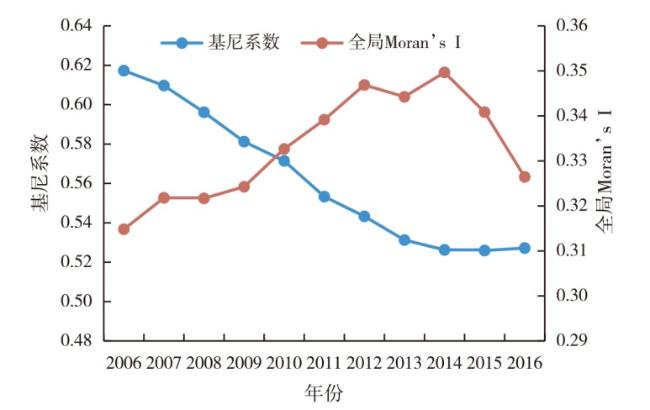
图2 农产品加工业全局Moran I指数和基尼系数Fig.2 Global Moran I index and Gini coefficient in agricultural product processing industry |
表1 中国各地区农产品加工业的产业转移指数Tab.1 Industrial transfer index of agricultural products processing industry in China |
| 2006 | 2007 | 2008 | 2009 | 2010 | 2011 | 2012 | 2013 | 2014 | 2015 | 2016 | |
|---|---|---|---|---|---|---|---|---|---|---|---|
| 北京 | -1.533 | -1.339 | -1.047 | -0.773 | -0.894 | -0.425 | -0.590 | -0.639 | -0.476 | -0.550 | -0.223 |
| 天津 | -2.357 | -0.795 | 0.108 | 1.341 | 0.176 | 2.998 | 2.603 | -0.436 | 0.388 | 0.272 | 0.706 |
| 河北 | -0.086 | -1.633 | -1.686 | -1.012 | -0.035 | 2.802 | -0.022 | -0.800 | 0.052 | -1.397 | -0.177 |
| 山西 | -0.221 | 0.063 | -0.469 | -0.046 | 0.375 | 0.462 | -0.006 | 0.027 | -0.368 | -0.495 | -0.037 |
| 内蒙古 | 0.783 | 0.814 | 0.752 | 2.394 | 0.047 | -0.492 | -2.429 | 0.513 | -1.806 | -0.149 | 0.552 |
| 辽宁 | 3.247 | 1.863 | 6.641 | 3.774 | 2.585 | -0.749 | 4.877 | -1.575 | -7.921 | -14.493 | -11.965 |
| 吉林 | 1.155 | 1.789 | 4.199 | 1.401 | 1.091 | 2.715 | 2.399 | -0.591 | -0.638 | 0.160 | -0.641 |
| 黑龙江 | -0.912 | -0.479 | 1.225 | 0.908 | 1.935 | 1.559 | 1.578 | 2.362 | -1.704 | -0.615 | -1.429 |
| 上海 | -4.095 | -3.188 | -2.706 | -3.307 | -0.768 | -2.267 | -1.240 | -2.429 | -0.871 | -1.173 | -1.795 |
| 江苏 | 2.288 | -6.532 | -4.430 | -8.585 | -3.293 | -12.618 | -2.015 | -2.901 | 0.860 | 2.144 | 1.735 |
| 浙江 | -4.352 | -5.406 | -13.487 | -8.861 | -3.834 | -13.294 | -4.715 | -3.935 | -2.847 | -2.634 | -1.917 |
| 安徽 | 0.495 | 1.482 | 1.648 | 2.276 | 2.853 | 5.385 | 1.293 | 0.149 | 2.121 | 1.159 | 1.220 |
| 福建 | -0.019 | 0.202 | -0.257 | 1.038 | 1.157 | 2.348 | -1.606 | 1.257 | 2.413 | 2.405 | 3.290 |
| 江西 | 1.014 | 1.421 | 1.595 | 1.590 | 1.858 | 0.670 | 2.519 | 2.449 | 3.761 | 1.973 | 0.972 |
| 山东 | 4.608 | 2.490 | -2.701 | 0.224 | -13.843 | -8.900 | 6.686 | -4.156 | -4.325 | 1.223 | -3.585 |
| 河南 | 4.065 | 7.542 | 2.387 | -1.978 | 0.654 | 7.742 | -4.705 | 3.074 | 4.876 | 3.796 | 4.444 |
| 湖北 | 1.119 | 1.037 | 2.588 | 4.686 | 4.665 | 7.710 | 7.138 | 2.874 | 3.488 | 1.930 | 2.258 |
| 湖南 | 0.540 | 1.396 | 2.597 | 2.347 | 2.665 | 3.875 | -1.982 | -0.145 | 0.944 | 1.534 | 0.861 |
| 广东 | -4.348 | -3.045 | -0.303 | -3.678 | 0.731 | -6.418 | -8.941 | 0.987 | -1.148 | 0.294 | 0.139 |
| 广西 | 0.947 | -0.238 | 1.323 | 0.113 | 0.742 | 1.825 | 1.591 | 0.159 | 0.261 | 0.632 | 0.341 |
| 海南 | -0.120 | -0.113 | -0.123 | -0.366 | -0.044 | -0.460 | 0.169 | -0.015 | -0.179 | -0.056 | -0.125 |
| 重庆 | -0.095 | 0.290 | 1.169 | 0.652 | 0.808 | -0.102 | 0.169 | 0.437 | 0.587 | 0.684 | 0.656 |
| 四川 | 0.834 | 2.876 | 3.050 | 5.366 | 0.310 | 4.842 | -6.224 | 0.940 | -0.483 | -0.411 | 2.008 |
| 贵州 | -0.399 | -0.447 | 0.248 | 0.114 | -0.070 | 0.852 | 0.304 | 0.940 | 0.880 | 1.531 | 1.050 |
| 云南 | -2.102 | -0.910 | -1.503 | -0.337 | -1.037 | -0.141 | 1.190 | -0.210 | 0.051 | 0.600 | 0.185 |
| 西藏 | -0.003 | 0.020 | 0.003 | 0.021 | -0.005 | -0.004 | -0.001 | -0.007 | 0.042 | 0.037 | 0.026 |
| 陕西 | 0.017 | 0.334 | -0.095 | 0.970 | 0.440 | 0.514 | 0.871 | 0.865 | 0.902 | 1.074 | 0.660 |
| 甘肃 | -0.345 | -0.110 | 0.153 | 0.014 | 0.026 | 0.113 | 0.627 | 0.234 | 0.184 | -0.213 | -0.204 |
| 青海 | 0.053 | -0.003 | 0.151 | 0.119 | 0.088 | -0.146 | 0.181 | 0.096 | 0.175 | 0.204 | 0.135 |
| 宁夏 | -0.098 | -0.112 | -0.144 | -0.037 | 0.149 | -0.043 | 0.160 | 0.157 | 0.417 | 0.227 | 0.246 |
| 新疆 | -0.080 | 0.732 | -0.886 | -0.367 | 0.469 | -0.351 | 0.121 | 0.319 | 0.364 | 0.310 | 0.614 |
注:为方便比较,将产业转移指数均乘以1 000。 |
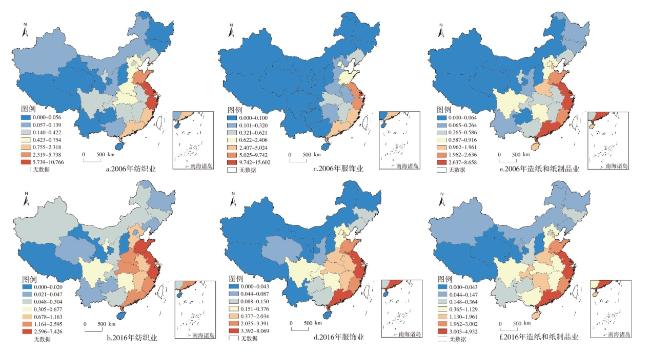
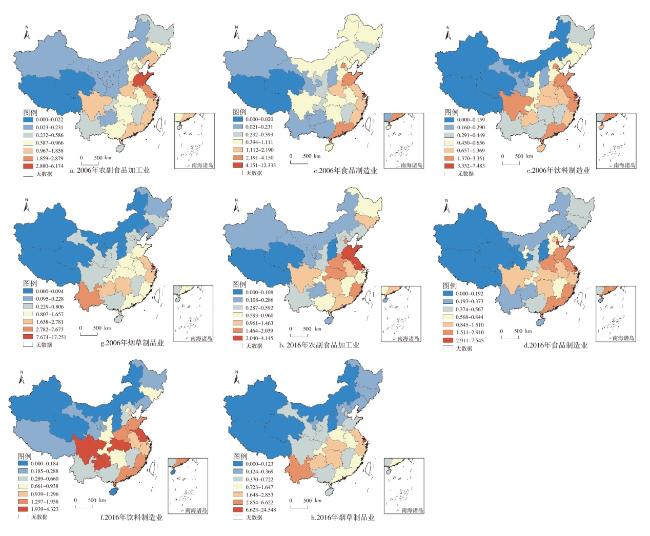
图4 劳动力密集型农产品加工业空间集聚格局演变Fig.4 Evolution of spatial agglomeration pattern of labor-intensive agricultural products processing industry |
表2 中国农产品加工业集聚水平的回归结果Tab.2 The regression results of agglomeration level of agricultural products processing industry |
| 东部 | 中西部 | ||||
|---|---|---|---|---|---|
| 劳动力密集型 | 原材料—资本密集型 | 劳动力密集型 | 原材料—资本密集型 | ||
| HB | 0.805*** | 0.519*** | 0.772*** | 0.621*** | |
| UV | -0.070* | -0.074* | 0.145*** | 0.334*** | |
| IR | 0.023 | 0.054 | 0.043** | 0.067*** | |
| FDI | -0.246*** | -0.146* | 0.119*** | 0.130*** | |
| PRO | 0.401 | -0.345 | 0.058 | -0.050 | |
| EMP | -0.025 | 0.019 | 0.140*** | -0.059 | |
| WAG | -0.076 | -0.248** | 0.069* | 0.114*** | |
| W(HB) | 0.884*** | -0.312 | 0.104 | -0.324*** | |
| W(UV) | 0.076 | 0.127 | -0.111* | -0.074 | |
| W(IR) | -0.002 | -0.040 | -0.064 | 0.015 | |
| W(FDI) | -0.187* | -0.031 | 0.191*** | 0.401*** | |
| W(PRO) | 0.214 | -0.581 | -0.369*** | -0.749*** | |
| W(EMP) | 0.178** | 0.147* | 0.078 | 0.256*** | |
| W(WAG) | 0.106 | 0.240* | -0.063* | -0.088** | |
| rho | -0.129 | 0.186 | 0.131 | 0.039 | |
| R2 | 0.734 | 0.452 | 0.931 | 0.864 | |
| Log-L | 189.6166 | 181.1231 | 548.994 | 527.182 | |
| Observations | 110 | 110 | 231 | 231 | |
注:*、**、***分别表示在90%、95%和99%的置信水平上显著。 |
| [1] |
李小建, 李二玲. 产业集聚发生机制的比较研究[J]. 中州学刊, 2002(4):5-8.
|
| [2] |
|
| [3] |
阿尔弗雷德·韦伯. 工业区位论[M]. 北京: 商务印书馆, 2011.
|
| [4] |
|
| [5] |
保罗·克鲁格曼. 地理和贸易[M]. 北京: 北京大学出版社, 2000.
|
| [6] |
贺灿飞, 潘峰华, 孙蕾. 中国制造业的地理集聚与形成机制[J]. 地理学报, 2007, 62(12):1 253-1 264.
|
| [7] |
|
| [8] |
周圣强, 朱卫平. 产业集聚一定能带来经济效率吗:规模效应与拥挤效应[J]. 产业经济研究, 2013(3):12-22.
|
| [9] |
王凯, 易静, 肖燕, 等. 中国旅游产业集聚与产业效率的关系研究[J]. 人文地理, 2016, 31(2):120-127.
|
| [10] |
史焱文, 李二玲, 李小建, 等. 基于SNA的农业产业集群创新网络与知识流动分析——以寿光蔬菜产业集群、鄢陵花木产业集群为例[J]. 经济地理, 2015, 35(8):114-122.
|
| [11] |
李二玲, 史焱文, 李小建. 基于农业产业集群的农业创新体系结构分析——以河南省鄢陵县花木产业集群为例[J]. 经济地理, 2012, 32(11):113-119.
|
| [12] |
王兵, 聂欣. 产业集聚与环境治理:助力还是阻力——来自开发区设立准自然实验的证据[J]. 中国工业经济, 2016(12):75-89.
|
| [13] |
胡志强, 苗健铭, 苗长虹. 中国地市工业集聚与污染排放的空间特征及计量检验[J]. 地理科学, 2018, 38(2):168-176.
|
| [14] |
贺灿飞, 金璐璐, 刘颖. 多维邻近性对中国出口产品空间演化的影响[J]. 地理研究, 2017, 36(9):1 613-1 626.
|
| [15] |
金璐璐, 贺灿飞, 周沂, 等. 中国区域产业结构演化的路径突破[J]. 地理科学进展, 2017, 36(8):974-985.
|
| [16] |
|
| [17] |
让·博西玛, 让·马丁. 演化经济地理学手册[M]. 李小建,译. 北京: 商务印书馆, 2016:3-36.
|
| [18] |
|
| [19] |
|
| [20] |
|
| [21] |
苗长虹, 胡志强, 耿凤娟, 等. 中国资源型城市经济演化特征与影响因素——路径依赖、脆弱性和路径创造的作用[J]. 地理研究, 2018, 37(7):1 268-1 281.
|
| [22] |
|
| [23] |
|
| [24] |
|
| [25] |
|
| [26] |
|
| [27] |
贺灿飞. 区域产业发展演化:路径依赖还是路径创造?[J]. 地理研究, 2018, 37(7):1 253-1 266.
|
| [28] |
石敏俊, 杨晶, 龙文, 等. 中国制造业分布的地理变迁与驱动因素[J]. 地理研究, 2013, 32(9):1 708-1 720.
|
| [29] |
李伟, 贺灿飞. 劳动力成本上升与中国制造业空间转移[J]. 地理科学, 2017, 37(9):1 289-1 299.
|
| [30] |
段小薇, 李璐璐, 苗长虹, 等. 中部六大城市群产业转移综合承接能力评价研究[J]. 地理科学, 2016, 36(5):681-690.
|
| [31] |
钟业喜, 陆玉麒. 鄱阳湖生态经济区人口与经济空间耦合研究[J]. 经济地理, 2011, 31(2):195-200.
|
| [32] |
|
| [33] |
|
| [34] |
彭继增, 陶旭辉, 徐丽. 我国数字化贫困地理集聚特征及时空演化机制[J]. 经济地理, 2019, 39(2):169-179.
|
| [35] |
农业部软科学委员会课题组. 中国农产品加工业的发展与政策选择[J]. 中国农村经济, 1999(2):4-15.
|
| [36] |
Erlat, Güzin,
|
| [37] |
邓宗兵, 吴朝影, 封永刚, 等. 中国农产品加工业的地理集聚分析[J]. 农业技术经济, 2014(5):89-98.
|
| [38] |
田光辉, 苗长虹, 胡志强, 等. 环境规制、地方保护与中国污染密集型产业布局[J]. 地理学报, 2018, 73(10):1 954-1 969.
|
| [39] |
|
| [40] |
陈强. 高级计量经济学及Stata应用(第二版)[M]. 北京: 高等教育出版社, 2014.
|
/
| 〈 |
|
〉 |