
长江经济带装备工业知识空间网络特征及优化路径
|
邹琳(1987—),女,山东青岛人,博士,讲师。主要研究方向为产业集群、创新网络及区域经济发展等。E-mail:zoulin200618@163.com。 |
收稿日期: 2019-02-19
修回日期: 2019-06-12
网络出版日期: 2025-04-17
基金资助
教育部人文社会科学基地重大项目(17JJD790006)
国家自然科学基金面上项目(41071093)
国家自然科学基金面上项目(41371147)
上海市哲学社会科学规划基金青年项目(2017EJL002)
中国博士后科学基金面上资助项目(2018M641964)
Characteristics and Optimum Path of Knowledge Network of Equipment Manufacturing Industry in Yangtze River Economic Belt
Received date: 2019-02-19
Revised date: 2019-06-12
Online published: 2025-04-17
知识经济时代,企业、高校、政府等组织跨区域、跨组织合作不断增加,知识与技术创新逐渐取代传统经济竞争模式。如何在知识创新竞争新模式下,实现知识获取、吸收及转化是提升区域创新的关键。长江经济带横跨中国经济差异巨大的东、中、西三大区域,文章基于长江经济带三大城市群实地调研,结合SNA及VAR模型对三大城市群网络结构特征及演化路径进行判定及机理分析,结论包括:①长江经济带知识网络规模增强,科学知识网络规模扩散,技术知识网络核心—边缘结构显著。网络演化中,工业技术类高校或大型国有企业占重要结构洞位置,与工业技术类高校建立的合作关系有助于实现跨区域知识创新及转化。②长三角城市群在知识网络中表现为市场或企业需求驱动下技术指向型路径,跨区域关系为满足企业技术或市场需求。③长江中西部城市群路径相反,表现为科学知识驱动路径。目的是实现新科学知识市场化。区域知识网络结构及路径演化差异证明欠发达区域不应盲目追求创新,而需找出自身发展路径,才能避免创新活动一哄而上现象发生。
邹琳 , 曾刚 , 朱贻文 , 马双 , 曹贤忠 . 长江经济带装备工业知识空间网络特征及优化路径[J]. 经济地理, 2019 , 39(11) : 113 -122 . DOI: 10.15957/j.cnki.jjdl.2019.11.014
In the era of knowledge economy, regional or inter-state competition is increasingly evolving into competition for knowledge innovation. How to achieve knowledge acquisition, absorption and transformation through inter-organizational cooperation is the key to enhance regional innovation. This paper based on field research and use SNA and VAR method to analysis evolution of knowledge network. Main conclusions: 1) The scale of knowledge network in Yangtze River Economic Belt is enhanced, scale of scientific knowledge network is enhanced, the technical knowledge network has enhanced and the core-edge structure is significant. Engineering university or large state-owned enterprises occupy important structural hole locations. Knowledge cooperation relationship with universities plays key bridging role in realizing inter-regional knowledge cooperation. 2) Yangtze River Delta is driven by market or enterprise demand, inter-regional bridging relationship is essentially to meet the demands of enterprise technology or market. 3) Middle and western Yangtze River are driven by scientific knowledge cooperation, purpose of inter-regional cooperation is to realize marketization of new scientific knowledge. So less developed region should not blindly pursue innovation, and need to find out their own development pathway, in order to avoid the phenomenon of innovation activities going up.
表1 SNA指标及内涵解释Tab.1 SNA indicators and explanations |
| 名称 | 内涵解释 | 基本表达式 |
|---|---|---|
| 网络密度及点度 | 网络中实际存在的连线数,密度最大、最健全的网络叫完备网络;单个顶点拥有连线数,通过计算顶点平均点度衡量网络凝聚性 | |
| 网络中心性 | 对节点在网络内中心性进行测度,包括点度中心度、接近中心度和中介中心度;中心势基于节点的中心度进行网络中心化程度测度 | ; |
| 网络弱组元及桥 | 点度大于等于1的顶点至少与一个邻点相连,但不意味这些点组成网络中的团块,弱组元是最大弱连通子网络;桥是只要删除就会增加网络组元数量的网络关系 | - |
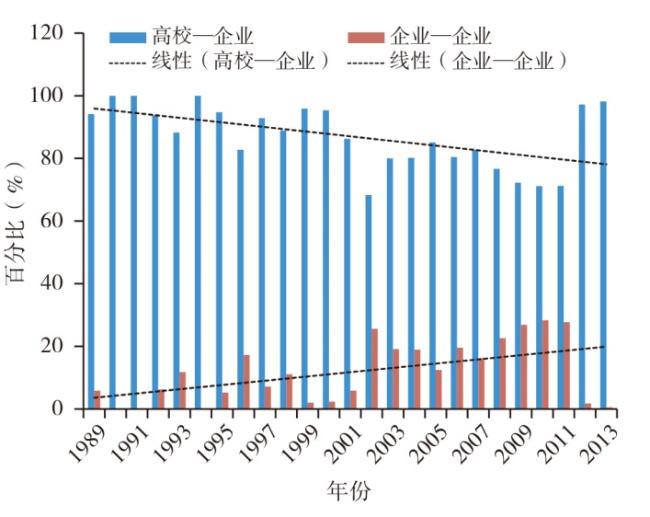
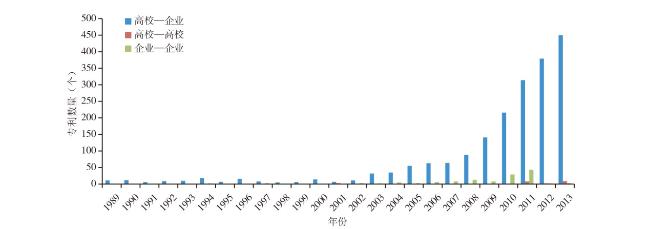
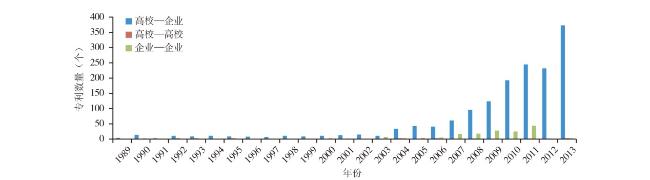
图1 1989—2013年长三角城市群装备工业技术知识合作注:根据SIPO长三角城市群装备工业合作专利数据统计绘制。 Fig.1 Technology knowledge cooperation of equipment manufacturing industry of Yangtze River Delta from 1989 to 2013 |
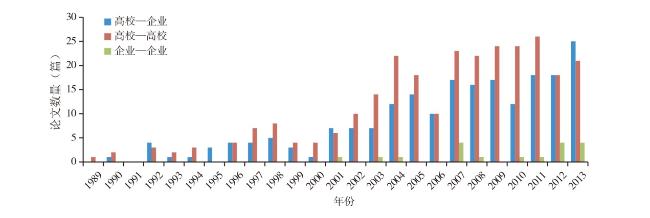
图3 1989—2013年长江中部城市群装备工业技术知识合作资料来源:根据SIPO长江中部城市群装备工业合作专利数据统计绘制。 Fig.3 Technology knowledge cooperation of equipment manufacturing industry in central region of Yangtze River Economic Belt from 1989 to 2013 |
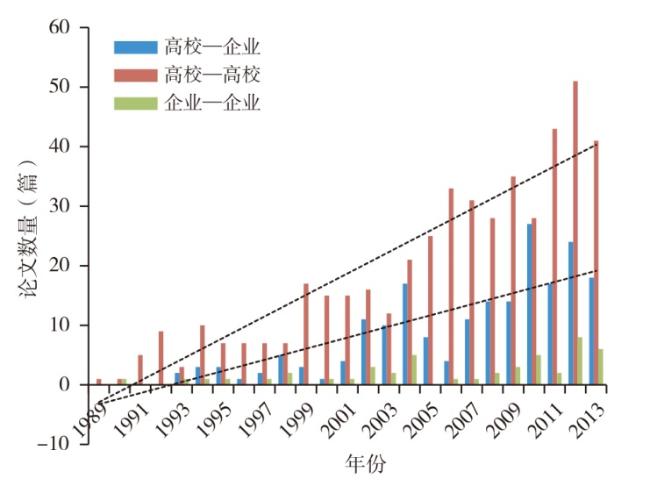
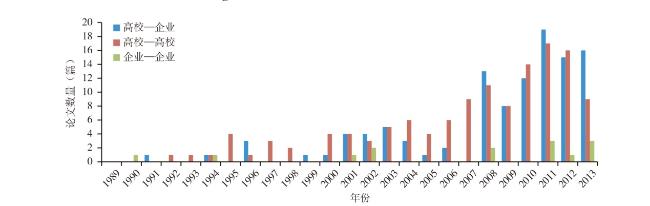
图4 1989—2013年长江中部城市群装备工业科学知识合作资料来源:根据CNKI长江中部城市群装备工业合作论文数据统计绘制。 Fig.4 Scientific knowledge cooperation of equipment manufacturing industry in central region of Yangtze River Economic Belt from 1989 to 2013 |
图5 1989—2013年长江西部城市群装备工业技术知识合作资料来源:根据SIPO长江西部城市群装备工业合作专利数据统计绘制。 Fig.5 Technology knowledge cooperation of equipment manufacturing industry in western region of Yangtze River Economic Belt from 1989 to 2013 |
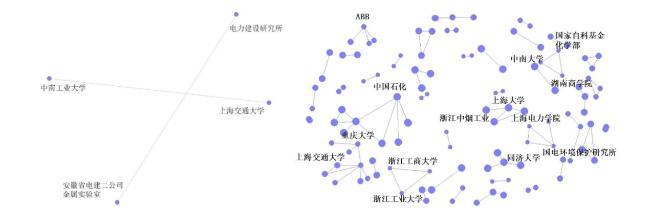
图7 1989—2013年科学知识网变化拓扑图注:1.“•”为参与知识合作网络的组织机构;-为组织间的合作关系。2.根据CNKI长江经济带装备制造业合作论文数据统计分析。 Fig.7 Topology changes of scientific knowledge network from 1989 to 2013 |
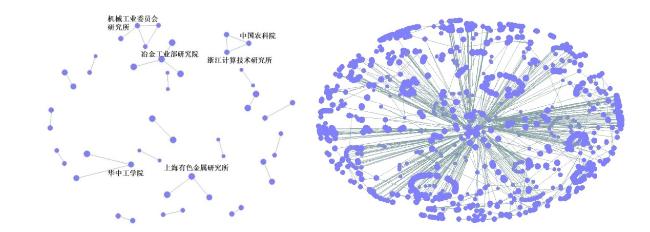
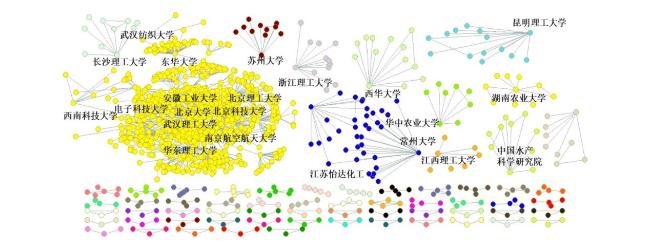
图8 1989—2013年技术知识网络变化拓扑图注:1.“•”为参与知识合作网络的组织机构;“-”为组织间的合作关系。2.根据SIPO长江经济带装备制造业合作专利数据统计分析。 Fig.8 Topology changes of technology knowledge network from 1989 to 2013 |
表2 长江经济带装备工业知识网络基础拓扑数据Tab.2 Topological data of knowledge network of equipment manufacturing industry in Yangtze River Economic Belt |
| 年份 | 点度中心势 | 中介中心势 | 网络密度 | 年份 | 点度中心势 | 中介中心势 | 网络密度 | |||||||||||||
|---|---|---|---|---|---|---|---|---|---|---|---|---|---|---|---|---|---|---|---|---|
| SKN | TKN | SKN | TKN | SKN | TKN | SKN | TKN | SKN | TKN | SKN | TKN | |||||||||
| 1989 | 0 | 0.03 | 0 | 0.003 | 0.14 | 0.030 | 2002 | 0.04 | 0.06 | 0.004 | 0.007 | 0.030 | 0.014 | |||||||
| 1990 | 0 | 0.08 | 0 | 0.023 | 0.07 | 0.029 | 2003 | 0.09 | 0.05 | 0.011 | 0.007 | 0.020 | 0.008 | |||||||
| 1991 | 0.11 | 0.05 | 0.020 | 0.003 | 0.11 | 0.025 | 2004 | 0.11 | 0.05 | 0.033 | 0.073 | 0.020 | 0.006 | |||||||
| 1992 | 0.18 | 0.06 | 0.070 | 0.003 | 0.15 | 0.025 | 2005 | 0.15 | 0.06 | 0.105 | 0.099 | 0.030 | 0.004 | |||||||
| 1993 | 0 | 0.02 | 0 | 0.003 | 0.09 | 0.019 | 2006 | 0.10 | 0.05 | 0.019 | 0.007 | 0.020 | 0.004 | |||||||
| 1994 | 0.13 | 0.02 | 0.060 | 0 | 0.12 | 0.015 | 2007 | 0.03 | 0.05 | 0.007 | 0.086 | 0.020 | 0.004 | |||||||
| 1995 | 0.06 | 0.03 | 0 | 0.002 | 0.09 | 0.018 | 2008 | 0.05 | 0.07 | 0.003 | 0.142 | 0.020 | 0.003 | |||||||
| 1996 | 0.12 | 0.01 | 0.020 | 0.002 | 0.08 | 0.019 | 2009 | 0.04 | 0.06 | 0.004 | 0.078 | 0.020 | 0.002 | |||||||
| 1997 | 0.05 | 0.03 | 0.008 | 0.003 | 0.08 | 0.020 | 2010 | 0.05 | 0.05 | 0.005 | 0.090 | 0.010 | 0.002 | |||||||
| 1998 | 0.04 | 0.05 | 0.002 | 0.006 | 0.03 | 0.023 | 2011 | 0.05 | 0.05 | 0.004 | 0.075 | 0.010 | 0.001 | |||||||
| 1999 | 0.11 | 0.13 | 0.019 | 0.078 | 0.05 | 0.029 | 2012 | 0.07 | 0.06 | 0.011 | 0.200 | 0.010 | 0.001 | |||||||
| 2000 | 0.06 | 0.08 | 0.008 | 0.011 | 0.07 | 0.020 | 2013 | 0.06 | 0.05 | 0.003 | 0.140 | 0.013 | 0.001 | |||||||
| 2001 | 0.11 | 0.12 | 0.020 | 0.029 | 0.04 | 0.020 | 总计 | 1.79 | 0.71 | 0.436 | 0.166 | 1.343 | 0.292 | |||||||
资料来源:根据CNKI和SIPO长江经济带装备制造业合作论文及合作专利数据分析。 |
表3 1989—2013年长江经济带科学知识网络和技术知识网络组元连通性Tab.3 Connectivity of scientific and technology knowledge network in Yangtze River economic belt from1989 to 2013. |
| 年份 | 网络规模 | >3弱联系组元数 | 最大弱组元占比/% | 最大弱组元规模 | |||||||
|---|---|---|---|---|---|---|---|---|---|---|---|
| SKN | TKN | SKN | TKN | SKN | TKN | SKN | TKN | ||||
| 1989 | 4 | 49 | - | 5 | - | 8.20 | 2 | 4 | |||
| 1993 | 12 | 68 | - | 7 | - | 8.82 | 2 | 6 | |||
| 1998 | 42 | 57 | 5 | 6 | 9.52 | 10.52 | 4 | 6 | |||
| 2003 | 61 | 185 | 6 | 20 | 13.11 | 9.70 | 8 | 18 | |||
| 2008 | 90 | 644 | 11 | 33 | 7.78 | 50.15 | 7 | 323 | |||
| 2013 | 118 | 1 412 | 17 | 65 | 7.62 | 66.85 | 9 | 944 | |||
注:1.SKN为科学知识网络,TKN为技术知识网络;2.根据CNKI和SIPO长江经济带装备制造业合作论文及合作专利数据分析。 |
表4 长江经济带三大城市群单位根检验结果汇总Tab.4 Unit root test of three regions in Yangtze River Economic Belt |
| 城市群 | 变量名 | ADF统计量 | 1%临界值 | 相伴概率 | 检验结果 |
|---|---|---|---|---|---|
| 长 三 角 城 市 群 | CP1 | 0.2459 | -3.7378 | 0.9699 | non-stationary |
| CP2 | -2.4574 | -3.7378 | 0.1378 | non-stationary | |
| E | 0.5044 | -3.7378 | 0.9832 | non-stationary | |
| F | -1.2564 | -3.7378 | 0.6323 | non-stationary | |
| GDP | -0.4199 | -3.7378 | 0.8906 | non-stationary | |
| D(CP1) | -5.3037 | -3.7529 | 0.0003 | stationary | |
| D(CP2) | -5.5459 | -3.7529 | 0.0002 | stationary | |
| D(E) | -3.5113 | -3.7529 | 0.0170 | stationary | |
| D(F) | -3.3914 | -3.7529 | 0.0221 | stationary | |
| D(GDP) | -5.8649 | -3.7529 | 0.0001 | stationary | |
| 长 江 中 部 城 市 群 | CP1 | -0.0960 | -3.7378 | 0.9392 | non-stationary |
| CP2 | -1.2579 | -3.7378 | 0.6316 | non-stationary | |
| E | -3.4077 | -3.7880 | 0.0224 | stationary | |
| F | -2.3431 | -3.7378 | 0.1675 | non-stationary | |
| GDP | 0.4026 | -3.7378 | 0.9788 | non-stationary | |
| D(CP1) | -6.3603 | -3.7529 | 0.0000 | stationary | |
| D(CP2) | -7.0961 | -3.7529 | 0.0000 | stationary | |
| D(F) | -6.1423 | -3.7529 | 0.0000 | stationary | |
| D(GDP) | -2.6964 | -3.8315 | 0.0929 | stationary | |
| 长 江 西 部 城 市 群 | CP1 | 0.8437 | -3.7529 | 0.9926 | non-stationary |
| CP2 | -0.4108 | -3.7529 | 0.8917 | non-stationary | |
| E | -1.0310 | -3.7378 | 0.7251 | non-stationary | |
| F | -2.3204 | -3.7378 | 0.1740 | non-stationary | |
| GDP | 0.2836 | -3.7378 | 0.9723 | non-stationary | |
| D(CP1) | -2.3358 | -3.7880 | 0.1708 | non-stationary | |
| D(CP2) | -5.5486 | -3.7695 | 0.0002 | stationary | |
| D(E) | -3.6251 | -3.7529 | 0.0133 | stationary | |
| D(F) | -6.0981 | -3.7529 | 0.0000 | stationary | |
| D(GDP) | -5.1730 | -3.8315 | 0.0013 | stationary | |
| D(CP1,2) | -3.7006 | -3.8573 | 0.0137 | stationary |
表5 长江经济带三大城市群VAR模型滞后阶数选择Tab.5 Lag order of VAR of three regions in Yangtze River Economic Belt |
| 城市群 | 阶数 | LogL | LR | FPE | AIC | SC | HQ |
|---|---|---|---|---|---|---|---|
| 长三角城市群 | 0 | -40.89017 | NA | 3.72e-05 | 3.990450 | 4.237296 | 4.052531 |
| 1 | 49.63643 | 133.8219 | 1.33e-07 | -1.707515 | -0.226436 | -1.335028 | |
| 2 | 92.82835 | 45.06983* | 3.92e-08* | -3.289421* | -0.574109* | -2.606528* | |
| 长江中部城市群 | 0 | -83.01282 | NA | 0.001451 | 7.653289 | 7.900135 | 7.715370 |
| 1 | -0.530108 | 121.9310* | 1.04e-05* | 2.654792* | 4.135871* | 3.027279* | |
| 2 | 19.88074 | 21.29827 | 2.23e-05 | 3.053849 | 5.769161 | 3.736743 | |
| 长江西部城市群 | 0 1 | -62.68454 12.50066 | NA 111.1434* | 0.000248 3.35e-06* | 5.885612 1.521681 | 6.132459 3.002761* | 5.947694 1.894169 |
| 2 | 41.33677 | 30.08985 | 3.45e-06 | 1.188107* | 3.903419 | 1.871000* |
注:1990—2014年样本数据变量包括:R1CP1、R1CP2、R1E、R1F、R1GDP;HQ:Hannan-Quinn information criterion;SC:Schwarz information criterion;AIC:Akaike information criterion;FPE:Final prediction error;LR:sequential modified LR test statistic(each test at 5% level) |
表6 长江经济带三大城市群Johansen协整检验结果(迹统计量、最大特征值)Tab.6 Johansen integration test of three regions in Yangtze River Economic Belt(trace Statistics, maximum eigenvalue) |
| 城市群 | 原假设协整方程数 | 特征值 | 统计量 | 0.05临界值 | 相伴概率** | |||||||||
|---|---|---|---|---|---|---|---|---|---|---|---|---|---|---|
| 迹统计量 | 最大特征值 | 迹统计量 | 最大特征值 | 迹统计量 | 最大特征值 | 迹统计量 | 最大特征值 | 迹统计量 | 最大特征值 | |||||
| 长三角城市群 | None* | None* | 0.923906 | 0.923906 | 112.3850 | 59.24316 | 69.81889 | 33.87687 | 0.0000 | 0.0000 | ||||
| At most 1* | At most 1* | 0.701515 | 0.701515 | 53.14185 | 27.80784 | 47.85613 | 27.58434 | 0.0147 | 0.0468 | |||||
| At most 2 | At most 2 | 0.522871 | 0.522871 | 25.33401 | 17.01929 | 29.79707 | 21.13162 | 0.1498 | 0.1711 | |||||
| At most 3 | At most 3 | 0.277652 | 0.277652 | 8.314712 | 7.480705 | 15.49471 | 14.26460 | 0.4324 | 0.4339 | |||||
| At most 4 | At most 4 | 0.035612 | 0.035612 | 0.834007 | 0.834007 | 3.841466 | 3.841466 | 0.3611 | 0.3611 | |||||
| 长江中部城市群 | None* | None* | 0.792460 | 0.792460 | 77.95518 | 36.16592 | 69.81889 | 33.87687 | 0.0097 | 0.0262 | ||||
| At most 1 | At most 1 | 0.642101 | 0.642101 | 41.78926 | 23.63258 | 47.85613 | 27.58434 | 0.1647 | 0.1481 | |||||
| At most 2 | At most 2 | 0.368293 | 0.368293 | 18.15668 | 10.56459 | 29.79707 | 21.13162 | 0.5545 | 0.6905 | |||||
| At most 3 | At most 3 | 0.280866 | 0.280866 | 7.592086 | 7.583260 | 15.49471 | 14.26460 | 0.5100 | 0.4227 | |||||
| At most 4 | At most 4 | 0.000384 | 0.000384 | 0.008826 | 0.008826 | 3.841466 | 3.841466 | 0.9248 | 0.9248 | |||||
| 长江西部城市群 | None* | None* | 0.782749 | 0.782749 | 70.37847 | 35.11410 | 69.81889 | 33.87687 | 0.0451 | 0.0354 | ||||
| At most 1 | At most 1 | 0.525583 | 0.525583 | 35.26437 | 17.15037 | 47.85613 | 27.58434 | 0.4341 | 0.5671 | |||||
| At most 2 | At most 2 | 0.419859 | 0.419859 | 18.11400 | 12.52312 | 29.79707 | 21.13162 | 0.5576 | 0.4969 | |||||
| At most 3 | At most 3 | 0.215791 | 0.215791 | 5.590885 | 5.590839 | 15.49471 | 14.26460 | 0.7432 | 0.6661 | |||||
| At most 4 | At most 4 | 2.00E-06 | 2.00E-06 | 4.59E-05 | 4.59E-05 | 3.841466 | 3.841466 | 0.9962 | 0.9962 | |||||
注:1.1992—2014年全部序列R1CP1、R1GDP、R1E、R1CP2、R1F;0.05显著性下存在2个协整方程;线性确定性趋势为趋势设定。2.最大特征值检验说明显著性是0.05时,协整方程有2个。3.“*”说明在0.05的水平拒绝原假设,“**”P值可以通过MacKinnon-Haug-Michelis得出。 |
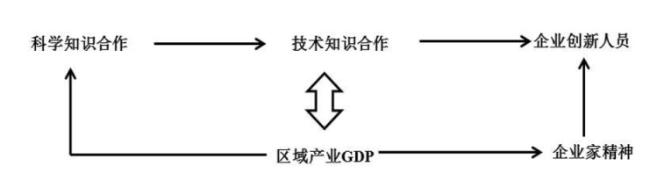
图10 长三角城市群在知识网络中的发展路径Fig.10 Development path of Yangtze River Delta in knowledge network |
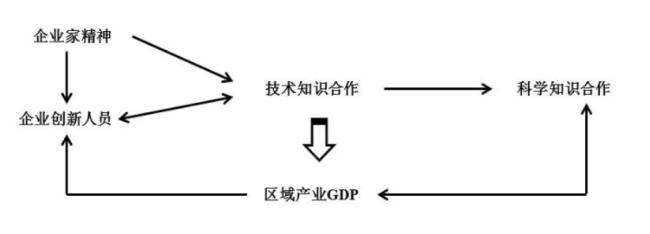
图11 长江中部城市群在知识网络中的发展路径Fig.11 Development path of central region of Yangtze River Economic Belt in knowledge network |
| [1] |
顾娜娜. 长江经济带装备工业产学研创新网络研究[D]. 上海: 华东师范大学, 2015.
|
| [2] |
陈雯, 虞孝感. 长江产业带建设特征、问题与发展思路[J]. 地理科学, 1997, 17(2):113-119.
|
| [3] |
|
| [4] |
|
| [5] |
胡耀辉. 产业技术创新链:我国企业从模仿到自主创新的路径突破[J]. 科技进步与对策, 2013, 30(9):66-69.
|
| [6] |
吕国庆, 曾刚, 顾娜娜. 基于地理邻近与社会邻近的创新网络动态演化分析——以我国装备工业为例[J]. 中国软科学, 2014(5):97-106.
|
| [7] |
曹贤忠. 基于全球—地方视角的上海高新技术产业创新网络研究[D]. 上海: 华东师范大学, 2017.
|
| [8] |
陆大道. 建设经济带是经济发展布局的最佳选择——长江经济带经济发展的巨大潜力[J]. 地理科学, 2014, 34(7):769-772.
|
| [9] |
马双, 曾刚. 技术合作对企业创新绩效的影响研究——以我国装备工业为例[J]. 华东经济管理, 2016, 30(5):160-165.
|
| [10] |
马双. 封闭型创新网络的结构和内在机理研究[D]. 上海: 华东师范大学, 2017.
|
| [11] |
|
| [12] |
|
| [13] |
|
| [14] |
|
| [15] |
李丹丹, 汪涛, 魏也华, 等. 中国城市尺度科学知识网络与技术知识网络结构的时空复杂性[J]. 地理研究, 2015, 34(3):525-540.
|
| [16] |
贺灿飞. 区域产业发展演化:路径依赖还是路径创造?[J]. 地理研究, 2018, 37(7):1 253-1 267.
|
| [17] |
|
| [18] |
|
/
| 〈 |
|
〉 |