
长三角城市群消费水平空间格局及其影响机制
|
毛中根(1975—),男,湖南武冈人,博士,教授。主要研究方向为消费经济和产业经济。E-mail:maogen@swufe.edu.cn。 |
收稿日期: 2020-02-26
修回日期: 2020-08-23
网络出版日期: 2025-04-11
基金资助
国家自然科学基金重点项目(72033007)
国家自然科学基金面上项目(71873107)
Spatial Pattern and Influencing Mechanism of Consumption Level in Yangtze River Delta Urban Agglomeration
Received date: 2020-02-26
Revised date: 2020-08-23
Online published: 2025-04-11
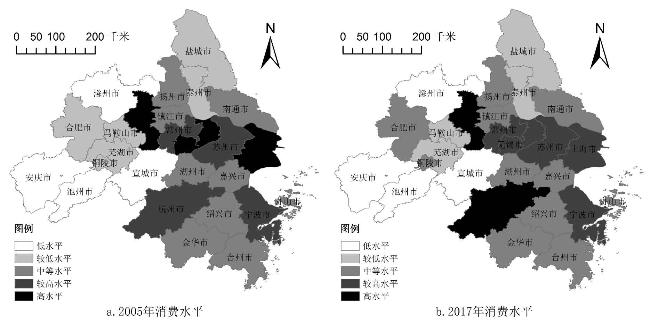
消费发展具有时代特征,既与人民生活质量密切相关,又是生产发展的动力。文章运用重心分析、空间自相关分析、空间面板计量、地理加权回归等多种方法,探索2005—2017年长三角城市群消费水平空间格局特征及其影响机制。研究发现:长三角城市群消费水平重心在上海、南京、杭州构成的三角区域内向西移动,与区域中心距离有所缩短,区域差异逐年缩小;消费水平存在正向空间关联,呈现出以上海—南京沿江带为主导的空间分布特征;经济水平、服务业占比、工业化率、人均财政支出、人力资本水平等对当地消费水平有正向影响,前三者对消费水平具有正向的空间溢出效应;此外,各因子对消费水平的影响存在空间异质性。
毛中根 , 武优勐 , 谢迟 . 长三角城市群消费水平空间格局及其影响机制[J]. 经济地理, 2020 , 40(12) : 56 -62 . DOI: 10.15957/j.cnki.jjdl.2020.12.007
Consumption development has the characteristics of the times,which is closely related to people's life quality and the driving force of production development. This paper explores the spatial pattern characteristics and influence mechanism of consumption level of Yangtze River Delta urban agglomeration from 2005 to 2017 by means of gravity center analysis,spatial autocorrelation analysis,spatial panel measurement and geographic weighted regression. The results show that: The center of consumption level of Yangtze River Delta urban agglomeration moves westward in the triangle region composed by Shanghai,Nanjing and Hangzhou,the distance between the center of consumption level and the regional center is shortened,and the regional difference is narrowing year by year. There is positive spatial correlation in consumption level and shows the characteristic of regional distribution which is dominated by the Yangtze River Belt between Shanghai and Nanjing. Economic level,the proportion of service industry,industrialization rate,per capita fiscal expenditure and human capital level have a positive impact on the local consumption level,and the first three factors have a positive spatial spillover effect on the consumption level. In addition,the influence of each factor on the consumption level has spatial heterogeneity.
表1 长三角城市群消费水平的LISA聚类结果Tab.1 LISA cluster result of consumption level in Yangtze River Delta urban agglomeration |
| 象限 | 2005 | 2017 |
|---|---|---|
| 象限1:HH | 上海、无锡、常州、苏州、杭州、宁波、嘉兴、湖州、绍兴、舟山、金华 | 上海、无锡、常州、苏州、杭州、宁波、嘉兴、湖州、绍兴、舟山、金华、南通、台州 |
| 象限2:LH | 南通、盐城、泰州、台州、滁州 | 扬州、盐城、泰州、滁州 |
| 象限3:LL | 扬州、合肥、马鞍山、芜湖、宣城、铜陵、池州、安庆 | 合肥、马鞍山、芜湖、宣城、铜陵、池州、安庆 |
| 象限4:HL | 南京、镇江 | 南京、镇江 |
表2 变量统计性描述Tab.2 Statistical description of variables |
| 变量 | 单位 | 观测值 | 平均值 | 标准差 | 最小值 | 最大值 |
|---|---|---|---|---|---|---|
| Cp | 元/人 | 338 | 16 466.02 | 9 234.24 | 2 254.99 | 46 851.41 |
| Pgdp | 万元/人 | 338 | 4.77 | 2.42 | 0.73 | 11.57 |
| Tgdp | - | 338 | 0.41 | 0.08 | 0.23 | 0.70 |
| Igdp | - | 338 | 0.45 | 0.08 | 0.22 | 0.70 |
| Pexpend | 元/人 | 338 | 5 748.41 | 3 515.84 | 722.44 | 22 315.80 |
| Phuman | 人/万人 | 338 | 216.29 | 195.57 | 6.64 | 1 002.70 |
| Proad | km/万人 | 338 | 21.17 | 11.07 | 4.29 | 61.60 |
注:以2004年为基期,用各市居民消费价格指数(CPI)对金额数据进行平减。本文采用插值法对缺失值和异常值进行替补。 |
表3 空间计量回归结果Tab.3 Results of spatial econometric regression |
| 变量 | (1)SAR lnCp | (2)SEM lnCp | (3) SAC lnCp | (4)SDM lnCp |
|---|---|---|---|---|
| ln Pgdp | 0.28*** (7.66) | 0.25*** (6.31) | 0.39*** (7.02) | 0.24*** (6.26) |
| ln Tgdp | 0.25*** (6.24) | 0.13*** (2.90) | 0.29*** (4.84) | 0.17*** (3.81) |
| ln Igdp | 0.17*** (3.94) | 0.15*** (3.35) | -0.09* (-1.69) | 0.19*** (4.31) |
| ln Pexpend | 0.07*** (2.64) | 0.10*** (3.69) | 0.32*** (9.38) | 0.09*** (3.28) |
| ln Phuman | 0.03** (2.22) | 0.04*** (2.89) | 0.07*** (3.17) | 0.05*** (3.19) |
| ln Proad | -0.00 (-0.21) | 0.02 (1.49) | -0.02 (-1.35) | 0.01 (0.96) |
| W·ln Pgdp | 0.22* (1.87) | |||
| W·ln Tgdp | 0.55*** (3.77) | |||
| W·ln Igdp | 0.31* (1.73) | |||
| W·ln Pexpend | -0.12 (-1.53) | |||
| W·ln Phuman | 0.08 (1.12) | |||
| W·ln Proad | -0.14*** (-3.32) | |||
| rho | 0.64***(20.44) | 1.36*** (5.82) | 0.57*** (6.74) | |
| lambda | 0.97***(160.66) | 3.89*** (7.32) | ||
| sigma2_e | 0.00***(12.97) | 0.00***(12.72) | 0.00***(13.86) | 0.00***(12.88) |
| N | 338 | 338 | 338 | 338 |
| Log L | 594.86 | 571.39 | 495.73 | 614.89 |
| R2 | 0.83 | 0.88 | 0.79 | 0.83 |
注:括号内为t统计量,* p < 0.1,** p < 0.05,*** p < 0.01。 |
表4 空间效应分解结果Tab.4 Results of spatial effect decomposition |
| 变量 | 模型 | 直接影响 | 空间溢出效应 | 总体效应 |
|---|---|---|---|---|
| ln Pgdp | SDM | 0.26***(6.74) | 0.82***(3.46) | 1.08***(4.50) |
| ln Tgdp | SDM | 0.21***(4.68) | 1.50***(4.06) | 1.71***(4.43) |
| ln Igdp | SDM | 0.22***(4.99) | 1.00**(1.97) | 1.21**(2.33) |
| ln Pexpend | SDM | 0.08***(3.09) | -0.16(-0.92) | -0.08(-0.44) |
| ln Phuman | SDM | 0.05***(3.44) | 0.24(1.36) | 0.29(1.60) |
| ln Proad | SDM | 0.01(0.41) | -0.31***(-2.94) | -0.30***(-2.74) |
注:括号内为z统计量,* p < 0.1,** p < 0.05,*** p < 0.01。 |
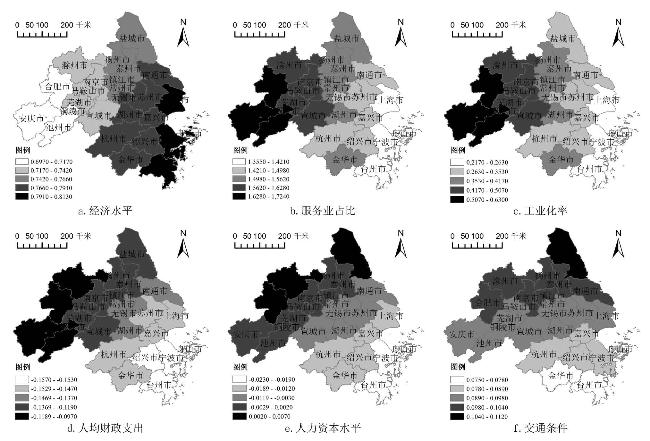
表5 GWR 模型的回归系数描述分析Tab.5 Descriptive statistical analysis of regression coefficients in the GWR model |
| 变量 | 最小值 | 下四分位值 | 中值 | 上四分位值 | 最大值 |
|---|---|---|---|---|---|
| 常数项 | 10.8659 | 11.0455 | 11.0924 | 11.1789 | 11.2911 |
| ln Pgdp | 0.6972 | 0.7305 | 0.7649 | 0.7858 | 0.8129 |
| ln Tgdp | 1.3554 | 1.4683 | 1.5212 | 1.6211 | 1.7235 |
| ln Igdp | 0.2166 | 0.3206 | 0.3755 | 0.4971 | 0.6304 |
| ln Pexpend | -0.1571 | -0.1494 | -0.1343 | -0.1200 | -0.0970 |
| ln Phuman | -0.0225 | -0.0119 | -0.0031 | 0.0015 | 0.0069 |
| ln Proad | 0.0752 | 0.0894 | 0.0957 | 0.0999 | 0.1116 |
| [1] |
欧阳峣, 傅元海, 王松. 居民消费的规模效应及其演变机制[J]. 经济研究, 2016, 51(2):56-68.
|
| [2] |
|
| [3] |
|
| [4] |
杨继东. 中国消费不平等演变趋势及其原因[J]. 财贸经济, 2013, 34(4):111-120.
|
| [5] |
杭斌, 申春兰. 经济转型中消费与收入的长期均衡关系和短期动态关系——中国城镇居民消费行为的实证分析[J]. 管理世界, 2004(5):25-32.
|
| [6] |
刘长庚. 完善提升居民消费能力的收入分配制度[J]. 消费经济, 2018, 34(6):9-11.
|
| [7] |
李文星, 徐长生, 艾春荣. 中国人口年龄结构和居民消费:1989—2004[J]. 经济研究, 2008(7):118-129.
|
| [8] |
毛中根, 孙武福, 洪涛. 中国人口年龄结构与居民消费关系的比较分析[J]. 人口研究, 2013, 37(3):82-92.
|
| [9] |
付波航, 方齐云, 宋德勇. 城镇化、人口年龄结构与居民消费——基于省际动态面板的实证研究[J]. 中国人口·资源与环境, 2013, 23(11):108-114.
|
| [10] |
潘明清, 高文亮. 我国城镇化对居民消费影响效应的检验与分析[J]. 宏观经济研究, 2014(1):118-125.
|
| [11] |
杨智峰. 地区差异、财政支出与居民消费[J]. 经济经纬, 2008(4):64-67.
|
| [12] |
毛军, 刘建民. 财税政策、路径依赖与中国居民消费的区域均衡发展[J]. 中国经济问题, 2016(6) :50-56.
|
| [13] |
毛中根, 洪涛. 中国服务业发展与城镇居民消费关系的实证分析[J]. 财贸经济, 2012(12):125-133.
|
| [14] |
汤向俊, 马光辉. 城镇化、服务业发展与居民消费:国际经验[J]. 财经科学, 2016(7):90-98.
|
| [15] |
肖挺. 交通设施、居民的消费区域流向与消费结构——来自我国省际层面的经验证据[J]. 财贸研究, 2018, 29(9):12-27.
|
| [16] |
郭广珍, 刘瑞国, 黄宗晔. 交通基础设施影响消费的经济增长模型[J]. 经济研究, 2019, 54(3):166-180.
|
| [17] |
马骊, 孙敬水. 我国居民消费与收入关系的空间自回归模型研究[J]. 管理世界, 2008(1):167-168.
|
| [18] |
管卫华, 周静, 陆玉麒. 改革开放以来中国社会消费水平的区域格局变化[J]. 地理研究, 2012, 31(2):234-244.
|
| [19] |
胡美娟, 周年兴, 李在军, 等. 江苏省县域消费水平的空间格局及影响因素分析[J]. 经济地理, 2014, 34(6):48-53.
|
| [20] |
焦志伦. 中国城市消费的空间分布与空间相关关系研究[J]. 经济地理, 2013, 33(7):41-46.
|
| [21] |
周民良. 经济重心、区域差距与协调发展[J]. 中国社会科学, 2000(2):42-53.
|
| [22] |
冯宗宪, 黄建山. 1978—2003年中国经济重心与产业重心的动态轨迹及其对比研究[J]. 经济地理, 2006, 26(2):249-254.
|
| [23] |
|
| [24] |
段禄峰, 张沛. 我国城镇化与工业化协调发展问题研究[J]. 城市发展研究, 2009, 16(7):12-17.
|
| [25] |
|
| [26] |
|
| [27] |
|
| [28] |
滕堂伟, 方文婷. 新长三角城市群创新空间格局演化与机理[J]. 经济地理, 2017, 37(4):68-77.
|
| [29] |
夏四友, 赵媛, 许昕. 江苏省粮食生产时空格局及其驱动因素[J]. 经济地理, 2018, 38(12):166-175.
|
/
| 〈 |
|
〉 |