
基于夜间灯光数据的黄河流域能源消费碳排放时空演变多尺度分析
|
作者简介:吕倩(1986—),女,河北石家庄人,博士,讲师。主要研究方向为大数据管理与应用、气候变化。E-mail: lvqian@bistu.edu.cn。 |
收稿日期: 2020-01-12
修回日期: 2020-09-02
网络出版日期: 2025-04-11
基金资助
中央高校基本科研业务费专项资金项目(2009QG10)
Multiscale Spatio-Temporal Characteristics of Carbon Emission of Energy Consumption in Yellow River Basin Based on the Nighttime Light Datasets
Received date: 2020-01-12
Revised date: 2020-09-02
Online published: 2025-04-11
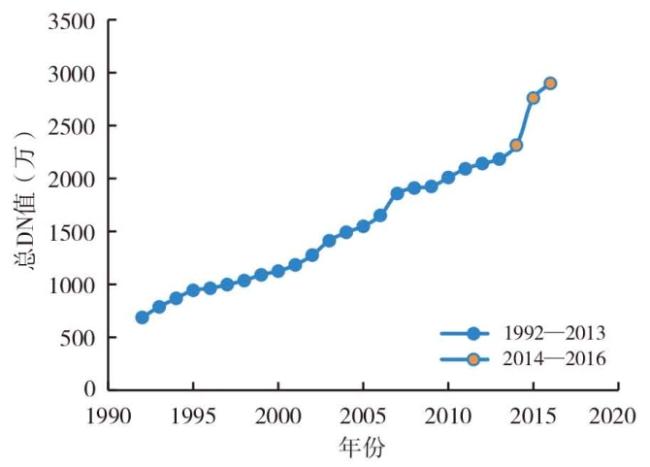
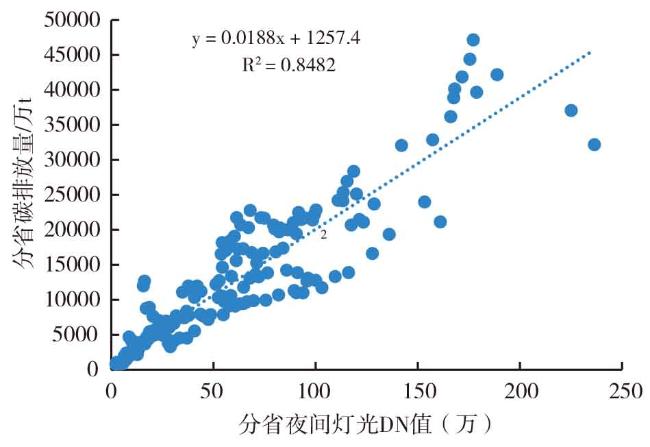
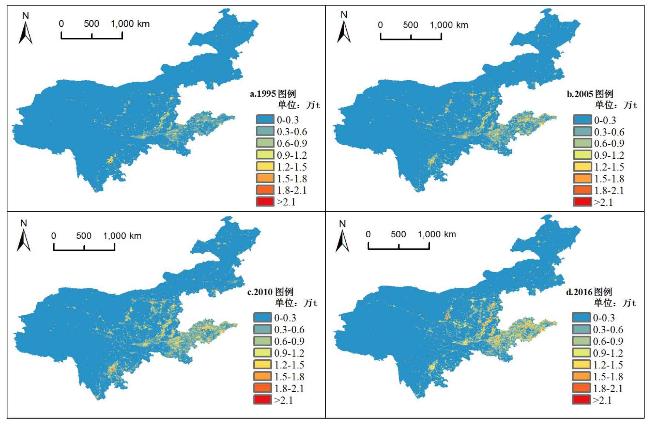
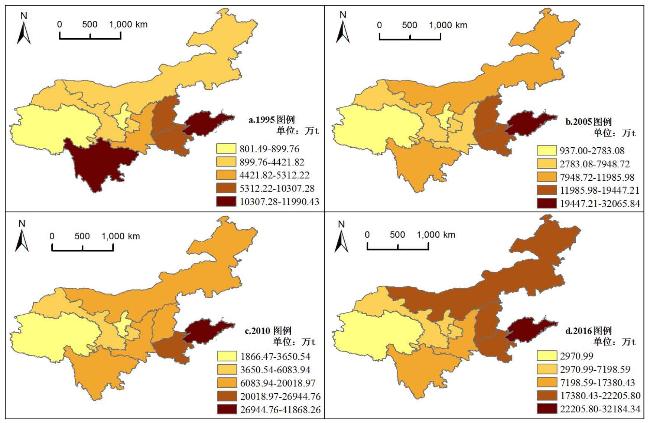
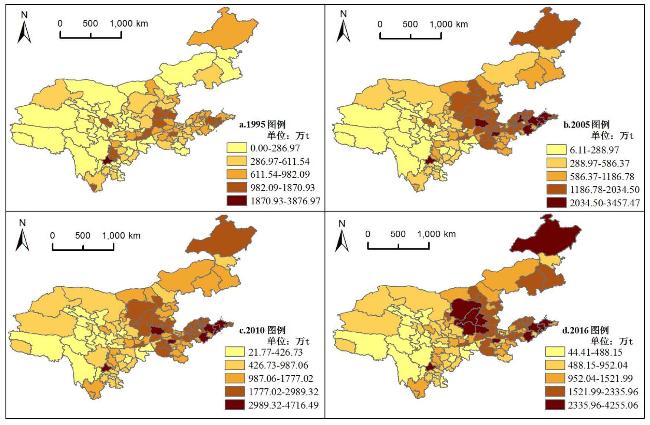
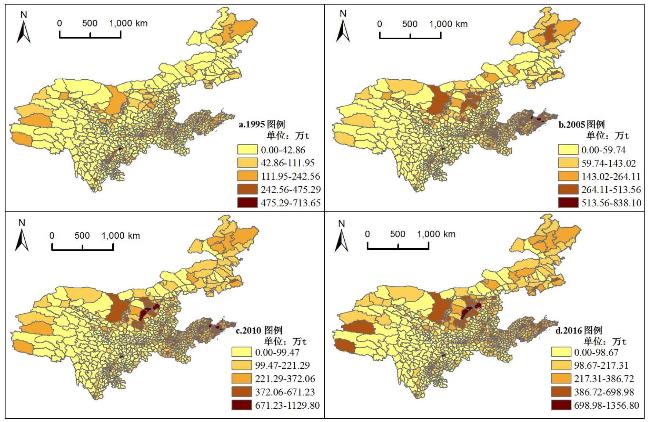
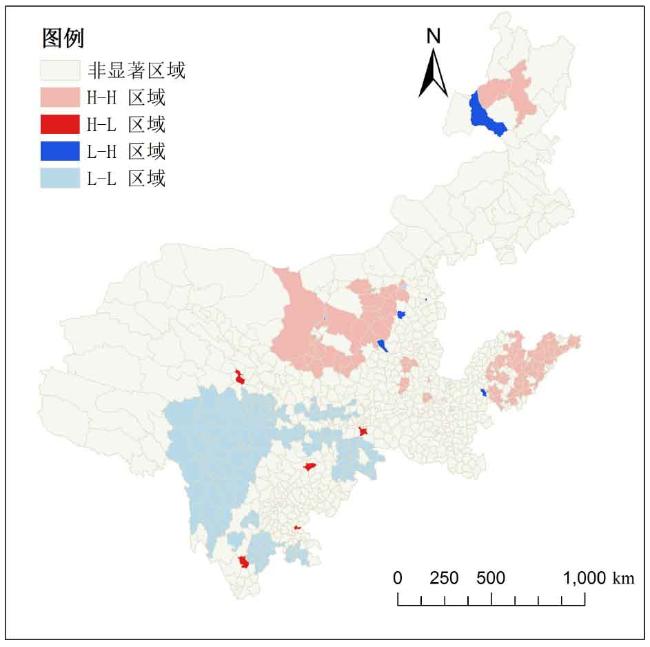
采用四步法对DMSP-OLS和NPP-VIIRS夜间灯光数据进行融合校正,得到1995—2016年黄河流域长时间序列夜间灯光数据集,结合省级能源消费统计碳排放数据,构建黄河流域多尺度碳排放估算模型。利用构建的估算模型和探索性空间数据分析方法从省级、市级、县级和栅格级对黄河流域能源消费碳排放进行时空演变特征分析。结果表明:①融合校正模型拟合优度为0.8354,满足精度要求;多尺度碳排放估算模型拟合优度达到0.8482,精度检验平均相对误差为17.25%,估算模型有效。②碳排放量呈现出显著连片扩张趋势;碳排放量较高省份为内蒙古、山西和河南;较高城市主要分布在山东、陕西和内蒙古。高碳县域基本维持在四川广元和内江,山西太原的清徐县,内蒙古的乌审旗和准格尔旗,山东枣庄、济宁和济南。③碳排放具有显著的空间正相关性;省级尺度全局相关性增长幅度最大;省级碳排放仅有甘肃呈现出LL集聚格局;城市聚集态势由内蒙古和山东的高碳聚集区以及甘肃和青海的低碳聚集区引起;县域聚集态势由高碳聚集区和低碳聚集区引起。
吕倩 , 刘海滨 . 基于夜间灯光数据的黄河流域能源消费碳排放时空演变多尺度分析[J]. 经济地理, 2020 , 40(12) : 12 -21 . DOI: 10.15957/j.cnki.jjdl.2020.12.002
This study applies the four-step method to integrate and correct the DMSP-OLS and NPP-VIIRS nighttime light datasets,so as to obtain the long time series of nighttime light datasets in the Yellow River Basin from 1995 to 2016. and constructs the multiscale carbon emissions estimation model for the Yellow River Basin based on the statistical data of provincial energy consumption. This paper analyzes the spatio-temporal characteristics of carbon emissions of energy consumption in the Yellow River Basin from the provincial,prefectural,county and grid scales by using the estimation model and the exploratory spatial analysis. The results show that: 1) The fitting precision using integrated model is 0.8354,which meets the accuracy requirement. And the fitting precision reaches 0.8482 based on multiscale carbon emissions estimation model,the average relative error of accuracy test is 17.25%,which indicates the estimation model is effective. 2) It shows a significant continuous expansion on the carbon emissions. Inner Mongolia Autonomous Region,Shanxi Province and Henan Province are at the highest level on carbon emissions. The cities which are located in Shandong Province,Shaanxi Province and Inner Mongolia Autonomous Region are mainly at the higher level of carbon emissions. The counties with higher level of carbon emissions are basically distributed in Guangyuan and Neijiang in Sichuan Province,Qingxu in Shanxi Province,Uxin Banner and Jungar Banner in Inner Mongolia Autonomous Region,and Zaozhuang,Jining and Jinan in Shandong Province. 3) It has significant positive spatial correlation on the carbon emissions,and the growth of the global correlation on provincial scale is the largest. Only Gansu Province shows low-low agglomeration pattern. The urban agglomeration trend is caused by the high carbon accumulation areas in Inner Mongolia Autonomous Region and Shandong Province,as well as by the low carbon accumulation areas in Gansu Province and Qinghai Province. The agglomeration trend at the county level is caused by high and low carbon accumulation areas.
表1 2012和2013年DMSP-OLS与NPP-VIIRS拟合参数值Tab.1 Fitting parameters of DMSP-OLS and NPP-VIIRS in 2012 and 2013 |
| 模型 | 拟合函数 | a | b | c | d | e | R2 |
|---|---|---|---|---|---|---|---|
| (1) | 5.2948 | 2 415.9 | - | - | - | 0.7701 | |
| (2) | 0.00003 | 2.6539 | 4 726.5 | - | - | 0.8354 | |
| (3) | 4 067.3 | 0.00009 | - | - | - | 0.0336 | |
| (4) | 62.695 | 0.6738 | - | - | - | 0.2847 |
表2 2014—2016年NPP-VIIRS拟合参数Tab.2 Fitting parameters of NPP-VIIRS in 2014-2016 |
| 年份 | 拟合函数 | a | R2 |
|---|---|---|---|
| 2014 | 1.0600 | 0.9993 | |
| 2015 | 1.2636 | 0.9942 | |
| 2016 | 1.3272 | 0.9881 |
表3 燃料消耗碳排放系数Tab.3 Coefficients of carbon emissions of fuel consumption |
| 能源种类 | 原煤 | 洗精煤 | 焦炭 | 原油 | 汽油 | 煤油 | 柴油 | 燃料油 | 液化石油气 | 天然气 | 焦炉煤气 | 炼厂干气 |
|---|---|---|---|---|---|---|---|---|---|---|---|---|
| 折算标准煤系数 | 0.7143 | 0.9000 | 0.9714 | 1.4286 | 1.4714 | 1.4714 | 1.4571 | 1.4286 | 1.7143 | 1.1~1.33 | 0.5714~0.6143 | 1.5714 |
| 碳排放系数 | 0.7559 | 0.7559 | 0.8550 | 0.5857 | 0.5538 | 0.5714 | 0.5921 | 0.6185 | 0.5042 | 0.4483 | 0.3548 | 0.4602 |
表4 碳排放估算模型相对误差(%)Tab.4 Relative error of carbon emission estimation model(%) |
| 省市地区 | 1995 | 2000 | 2005 | 2010 | 2016 |
|---|---|---|---|---|---|
| 内蒙古自治区 | 5.38 | 7.18 | -30.33 | -25.03 | -10.20 |
| 山东省 | 59.70 | 76.04 | -12.77 | -19.89 | 42.02 |
| 河南省 | 19.20 | 41.35 | -6.00 | -14.82 | 49.19 |
| 四川省 | -64.94 | -19.78 | -13.88 | -33.76 | -1.85 |
| 陕西省 | 6.34 | 103.33 | 18.98 | 13.81 | 51.97 |
| 甘肃省 | -23.39 | -7.74 | -4.38 | 8.72 | 41.28 |
| 青海省 | 110.06 | 109.49 | 143.80 | 52.09 | 26.84 |
| 宁夏回族自治区 | 152.87 | 28.40 | 13.27 | 10.28 | -1.79 |
| 山西省 | 7.71 | 15.18 | -4.19 | -12.64 | 15.83 |
| 高精度占比 | 55.56 | 44.44 | 77.78 | 66.67 | 44.44 |
表5 全局相关性分析结果Tab.5 Global correlation analysis results |
| 1995 | 2005 | 2010 | 2016 | ||
|---|---|---|---|---|---|
| 省级 | Moran I | 0.2509 | 0.4688 | 0.4848 | 0.5534 |
| z | 1.3107 | 2.4282 | 2.4006 | 2.4830 | |
| p | 0.1899 | 0.0151 | 0.0163 | 0.0130 | |
| 市级 | Moran I | 0.1246 | 0.4441 | 0.4064 | 0.3088 |
| z | 3.1212 | 9.7935 | 8.9792 | 6.8660 | |
| p | 0.0018 | 0.0000 | 0.0000 | 0.0000 | |
| 县级 | Moran I | 0.1554 | 0.3122 | 0.2896 | 0.2359 |
| z | 15.9173 | 31.6565 | 29.4000 | 24.0290 | |
| p | 0.0000 | 0.0000 | 0.0000 | 0.0000 |
表6 市级局域LISA集聚格局Tab.6 LISA cluster pattern at the municipal level |
| 省份 | HH | HL | LH | LL |
|---|---|---|---|---|
| 内蒙古 | 鄂尔多斯、呼和浩特 | |||
| 山东 | 临沂、青岛、潍坊、烟台、延安、临汾、晋中、吕梁、榆林 | 莱芜 | ||
| 四川 | 成都 | |||
| 甘肃 | 陇南、甘南藏族自治州、定西、临夏回族自治州、武威市、金昌市、张掖市 | |||
| 青海 | 果洛藏族自治州、黄南藏族自治州、海东地区、海南藏族自治州、海北藏族自治州 |
| [1] |
国务院. “十三五”控制温室气体排放工作方案[EB/OL]. http://www.gov.cn/zhengce/content/2016-11/04/content_5128619.htm, 2016-10-27.
|
| [2] |
|
| [3] |
新华社. 习近平在河南主持召开黄河流域生态保护和高质量发展座谈会[EB/OL]. http://www.gov.cn/xinwen/2019-09/19/content_5431299.htm, 2019-09-19.
|
| [4] |
陆大道, 孙东琪. 黄河流域的综合治理与可持续发展[J]. 地理学报, 2019, 74(12):2431-2436.
|
| [5] |
|
| [6] |
|
| [7] |
|
| [8] |
苏泳娴, 陈修治, 叶玉瑶, 等. 基于夜间灯光数据的中国能源消费碳排放特征及机理[J]. 地理学报, 2013, 68(11):1513-1526.
|
| [9] |
|
| [10] |
|
| [11] |
|
| [12] |
|
| [13] |
|
| [14] |
|
| [15] |
王喜, 秦耀辰, 鲁丰先, 等. 黄河中下游地区主要省份低碳经济发展水平的时空差异研究[J]. 地理科学进展, 2013, 32(4):505-513.
|
| [16] |
武娜, 沈镭, 钟帅. 基于夜间灯光数据的晋陕蒙能源消费碳排放时空格局[J]. 地球信息科学学报, 2019, 21(7):1040-1050.
|
| [17] |
黄光球, 刘富垒. 陕西省能源消费结构对碳排放强度的作用机理研究[J]. 生态经济, 2019, 35(5):36-41.
|
| [18] |
刘玉珂, 金声甜. 中部六省能源消费碳排放时空演变特征及影响因素[J]. 经济地理, 2019, 39(1):182-191.
|
| [19] |
刘晓红, 江可申, 魏洁云. 我国经济增长、能源消费、贸易开放度、城镇化和碳排放之间关系——以东部地区为例[J]. 系统工程, 2016, 34(9):81-88.
|
| [20] |
|
| [21] |
|
| [22] |
施开放. 多尺度视角下的中国碳排放时空格局动态及影响因素研究[D]. 上海: 华东师范大学, 2017.
|
| [23] |
冯宗宪, 高赢. 中国区域碳排放驱动因素、减排贡献及潜力探究[J]. 北京理工大学学报:社会科学版, 2019, 21(4):13-20.
|
| [24] |
刘华军, 石印, 雷名雨. 碳源视角下中国碳排放的地区差距及其结构分解[J]. 中国人口·资源与环境, 2019, 29(8):87-93.
|
/
| 〈 |
|
〉 |