
中国经济南北差距演变及其收敛性评估
|
李峰波(1997—),男,博士研究生,研究方向为城市经济学。E-mail:lifb23@mails.tsinghua.edu.cn |
收稿日期: 2023-12-31
修回日期: 2024-07-20
网络出版日期: 2025-01-21
基金资助
国家社会科学基金项目(22BZZ094)
国家资助博士后研究人员计划(GZC20231228)
中国博士后科学基金第76批面上资助(2024M761742)
Evolution Characteristics and Convergence Evaluation of Economic Disparity in Northern and Southern Regions of China
Received date: 2023-12-31
Revised date: 2024-07-20
Online published: 2025-01-21
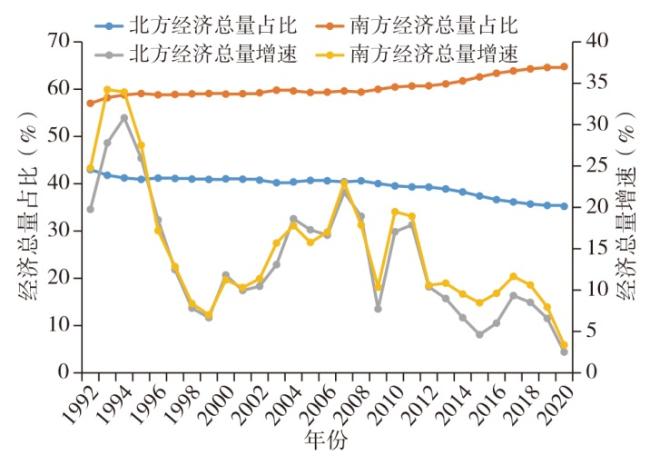
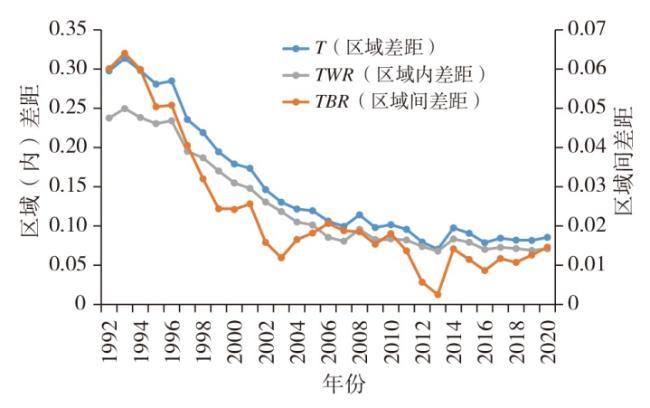
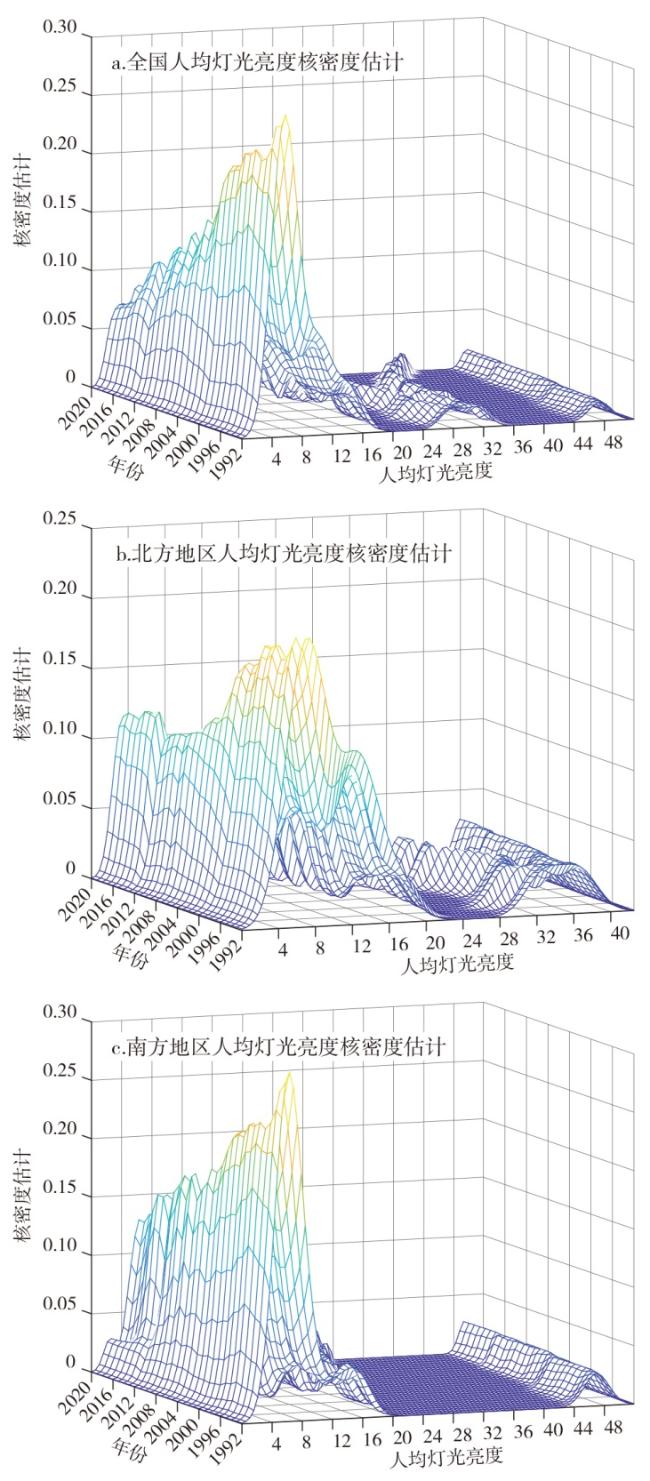
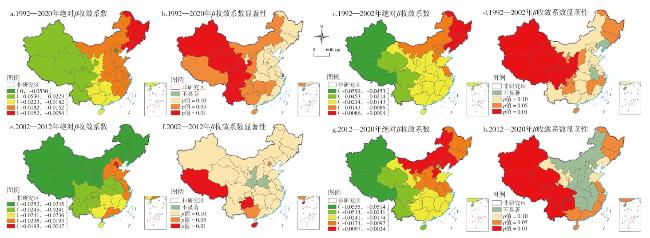
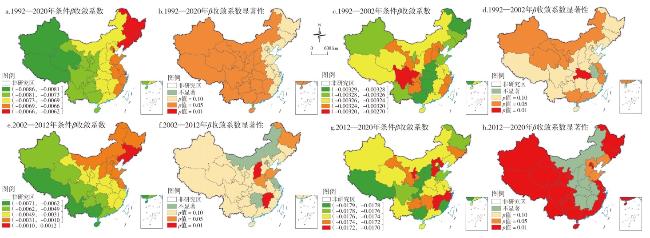
南北差距逐步拉大,已经成为我国区域发展不平衡不充分的典型现象。文章使用1992—2020年夜间卫星灯光数据分析了我国南北差距及其动态演变特征,评估了其全局和局部收敛性,并探究了影响南北差距收敛性的主要因素。结果表明:①样本期内南北差距呈现出下降—上升的反复波动趋势,但2013年以后呈现出新一轮加速扩大趋势。②南方和北方地区间经历了从不存在俱乐部收敛到俱乐部收敛的过程,主要体现为南方发散和北方收敛。③南方和北方地区内部均存在明显的局部收敛特征,但不同地区收敛的稳态水平存在分化。④营商环境和创新水平的差距是造成南北方发展加速分化的主要因素,技术进步和创新水平是导致南方地区内部分化的主导力量,而产业结构变迁对缩小北方地区内部差距具有积极作用。研究结论为缩小南北差距和推动区域协调发展提供了有效的政策建议。
李峰波 , 程文浩 , 陈琴 , 张博淳 . 中国经济南北差距演变及其收敛性评估[J]. 经济地理, 2024 , 44(12) : 1 -11 . DOI: 10.15957/j.cnki.jjdl.2024.12.001
The widening gap between the north and the south in China has become a typical phenomenon of unbalanced and inadequate regional development. This paper uses the nighttime satellite light data from 1992 to 2020 to analyze the North-South gap and its dynamic evolution characteristics, evaluates its global and local convergence, and explores the main factors affecting the convergence of the North-South gap. The empirical results show that: 1) During the sample period, the North-South gap showed a downward-upward trend of repeated fluctuations, but after 2013, it showed a new round of accelerated expansion trend. 2) The South and the North in China both experienced a process from non-existent club convergence to club convergence, which is mainly reflected divergence in the southern region and convergence in the northern region. 3) There are obvious local convergence characteristics in the southern and northern regions, but the steady-state level of convergence in different regions is differentiated. 4) The gap between the business environment and the innovation level is the main factor causing the accelerated differentiation between the northern and the southern regions. Technological progress and innovation level are the leading forces leading to the internal differentiation in the southern region, and the change of industrial structure has a positive effect on narrowing the internal gap in the northern region. This paper provides an effective policy reference for narrowing the gap between the northern and the southern regions and promoting regional coordinated development.
表1 绝对β收敛结果Tab.1 The absolute β convergence results |
| 变量 | 1992—2020年 | 1992—2002年 | 2002—2012年 | 2012—2020年 | |||||||
|---|---|---|---|---|---|---|---|---|---|---|---|
| SAR | SEM | SAR | SEM | SAR | SEM | SAR | SEM | ||||
| lnpgit | -0.0247*** (-4.4718) | -0.0167*** (-3.5624) | -0.0169*** (-3.3117) | -0.0162** (-2.3617) | -0.0235*** (-7.0315) | -0.0220*** (-7.2625) | -0.0157*** (-3.4815) | -0.0177** (-3.0232) | |||
| lnpgit·South | 0.0004 (0.3421) | 0.0001 (0.0718) | 0.0068(1.2321) | 0.0046(0.6119) | 0.0334 (1.2524) | 0.0029 (1.0431) | 0.0004 (0.1517) | 0.0005 (0.1217) | |||
| 常数项 | 0.0400*** (2.9018) | 0.0820*** (8.6921) | 0.0326** (2.1018) | 0.0847*** (4.8916) | 0.1058*** (5.4727) | 0.0906*** (6.2047) | 0.0619*** (3.0821) | 0.0968*** (9.5618) | |||
| loglikelihood | 93.1461 | 90.5599 | 78.4167 | 76.3344 | 92.5196 | 92.1972 | 77.6923 | 76.2357 | |||
| LM-error | 1.5831 | 1.5266 | 1.0001 | 1.2385 | |||||||
| Robust-LM-error | 1.9269 | 8.0667*** | 0.1836 | 6.1811** | |||||||
| LM-lag | 7.2978*** | 7.2838*** | 6.3547*** | 8.4091*** | |||||||
| Robust-LM-lag | 7.6415*** | 8.8239*** | 6.5382*** | 8.3517*** | |||||||
| N | 31 | 31 | 31 | 31 | 31 | 31 | 31 | 31 | |||
注:South为地区虚拟变量,南方地区的省份取值为1,北方地区的省份取值为0。***、**、*分别表示通过了1%、5%、10%的显著性检验,括号内为z值。表2同。 |
表2 条件β收敛结果Tab.2 The conditions β convergence results |
| 变量 | 1992—2020年 | 1992—2002年 | 2002—2012年 | 2012—2020年 | |||||||
|---|---|---|---|---|---|---|---|---|---|---|---|
| SAR | SEM | SAR | SEM | SAR | SEM | SAR | SEM | ||||
| lnpgit | -0.0096*** (-2.7931) | -0.0119*** (-3.1224) | -0.0166*** (-2.7223) | -0.0153*** (-2.9425) | -0.0165*** (-2.6214) | -0.0128* (-1.6819) | -0.0064 (-1.0821) | -0.0093 (-1.6023) | |||
| lnpgit·South | 0.0004(0.5119) | 0.0006 (0.5919) | 0.0035 (0.7819) | 0.0008 (0.3319) | 0.0007 (0.2521) | 0.0050 (1.4917) | 0.0054* (1.6418) | 0.0087** (3.1321) | |||
| 常数项 | 0.0415*** (3.1121) | 0.0708*** (7.4615) | 0.0458** (2.1321) | 0.0547*** (3.1910) | 0.1056*** (4.2214) | 0.0840*** (5.2021) | 0.0752*** (2.8417) | 0.1040*** (5.5432) | |||
| loglikelihood | 109.0541 | 105.9322 | 90.3018 | 92.3612 | 95.1615 | 94.6181 | 93.3307 | 92.3349 | |||
| LM-error | 0.1616 | 0.0717 | 5.0796*** | 0.0346 | |||||||
| Robust-LM-error | 1.7270 | 9.3760*** | 4.8261*** | 1.0612 | |||||||
| LM-lag | 6.7043*** | 5.4742** | 0.0132 | 5.1168** | |||||||
| Robust-LM-lag | 6.2696*** | 4.7785*** | 1.2666 | 7.1434*** | |||||||
| 控制变量 | 是 | 是 | 是 | 是 | 是 | 是 | 是 | 是 | |||
| N | 31 | 31 | 31 | 31 | 31 | 31 | 31 | 31 | |||
表3 QAP 回归分析结果Tab.3 The QAP regression analysis results |
| 变量 | 全样本 | 南方地区 | 北方地区 | |||||
|---|---|---|---|---|---|---|---|---|
| 未标准化系数 | 标准化系数 | 未标准化系数 | 标准化系数 | 未标准化系数 | 标准化系数 | |||
| Market | 89.081 | 0.665*** | 9.148 | 0.070 | 0.229 | 0.001 | ||
| Patent | 0.197 | 0.378** | 0.544 | 0.904*** | 0.606 | 1.334 | ||
| Structure | -2.564 | -0.161 | 9.138 | 0.345 | -6.540 | -0.575** | ||
| Technology | -9.860 | -0.023 | 0.682 | 0.001 | -0.209 | -0.001 | ||
| Tfp | 11.966 | 0.109 | 32.733 | 0.262** | 9.351 | 0.097 | ||
| Capital | 0.001 | 0.009 | -0.001 | -0.089 | 0.001 | 0.236 | ||
| Adj-R2 | 0.305 | 0.340 | 0.278 | |||||
注:*、**、***分别表示在10%、5%、1%的水平上显著。变量均为31×31矩阵,随机置换5000次。 |
| [1] |
耿瑞霞, 胡鞍钢, 周绍杰. 我国经济发展南北差距:基本判断、主要原因与政策建议[J]. 中共中央党校(国家行政学院)学报, 2022, 26(5):64-71.
|
| [2] |
李善同, 何建武, 唐泽地. 从价值链分工看中国经济发展南北差距的扩大[J]. 中国经济报告, 2019(2):16-21.
|
| [3] |
许宪春, 雷泽坤, 窦园园, 等. 中国南北平衡发展差距研究——基于“中国平衡发展指数”的综合分析[J]. 中国工业经济, 2021(2):5-22.
|
| [4] |
安虎森, 周江涛. 影响我国南北经济差距的主要因素分析[J]. 经济纵横, 2021(7):28-38.
|
| [5] |
张红梅, 李善同, 许召元. 改革开放以来我国地区差距的演变[J]. 改革, 2019(4):78-87.
|
| [6] |
盛来运, 郑鑫, 周平, 等. 我国经济发展南北差距扩大的原因分析[J]. 管理世界, 2018, 34(9):16-24.
|
| [7] |
吕承超, 索琪, 杨欢. “南北”还是“东西”地区经济差距大?——中国地区经济差距及其影响因素的比较研究[J]. 数量经济技术经济研究, 2021, 38(9):80-97.
|
| [8] |
刘华军, 孙东旭, 丁晓晓. 中国居民收入的南北差距分析[J]. 中国人口科学, 2022(4):30-43,126-127.
|
| [9] |
梁林, 段世玉, 李妍. 中国南北差距现象能得到改善吗——基于三大重点城市群创新网络韧性监测和比较[J]. 中国科技论坛, 2022(7):106-117.
|
| [10] |
|
| [11] |
|
| [12] |
|
| [13] |
王贤彬, 黄亮雄, 徐现祥, 等. 中国地区经济差距动态趋势重估——基于卫星灯光数据的考察[J]. 经济学(季刊), 2017, 16(3):877-896.
|
| [14] |
王维. 南北经济收敛性与共同富裕[J]. 南方经济, 2022(10):37-53.
|
| [15] |
董雪兵, 池若楠. 中国区域经济差异与收敛的时空演进特征[J]. 经济地理, 2020, 40(10):11-21.
|
| [16] |
王磊, 李峰波, 马新宇. 中国南北差距之谜:结构转换与结构冲击——基于空间计量模型的实证分析[J]. 云南财经大学学报, 2022, 38(5):1-15.
|
| [17] |
|
| [18] |
|
| [19] |
|
| [20] |
苏红键. 自然禀赋与地区发展:兼论南北经济差距扩大现象[J]. 中国软科学, 2022(10):61-71.
|
| [21] |
赵子乐, 林建浩. 经济发展差距的文化假说:从基因到语言[J]. 管理世界, 2017(1):65-77.
|
| [22] |
杨明洪, 黄平. 南北差距中的结构效应及空间差异性测度[J]. 经济问题探索, 2020(5):1-13.
|
| [23] |
兰秀娟, 张卫国, 裴璇. 我国中心—外围城市经济发展差异及收敛性研究[J]. 数量经济技术经济研究, 2021, 38(6):45-65.
|
| [24] |
潘文卿. 中国区域经济差异与收敛[J]. 中国社会科学, 2010(1):72-84,222-223.
|
| [25] |
陈梦根, 张帅. 中国地区居民生活水平比较——基于全球夜间灯光数据[J]. 经济理论与经济管理, 2021, 41(5):48-67.
|
| [26] |
邓忠奇, 高廷帆, 朱峰. 地区差距与供给侧结构性改革——“三期叠加”下的内生增长[J]. 经济研究, 2020, 55(10):22-37.
|
| [27] |
刘华军, 杜广杰. 中国经济发展的时空格局及分布动态演变——基于城市DMSP/OLS夜间灯光数据的研究[J]. 中国人口科学, 2017(3):17-29,126.
|
| [28] |
李华, 董艳玲. 基本公共服务均等化是否缩小了经济增长质量的地区差距?[J]. 数量经济技术经济研究, 2020, 37(7):48-70.
|
| [29] |
李敬, 陈澍, 万广华, 等. 中国区域经济增长的空间关联及其解释——基于网络分析方法[J]. 经济研究, 2014, 49(11):4-16.
|
| [30] |
白俊红, 王林东. 创新驱动对中国地区经济差距的影响:收敛还是发散?[J]. 经济科学, 2016(2):18-27.
|
| [31] |
王家庭, 袁春来, 贺沛翔. 我国南北差距的定量测度、时空演进及驱动因素[J]. 学习与实践, 2023(4):40-51.
|
| [32] |
唐兆涵, 陈璋. 区域经济差距的形成动因、演变路径和发展趋势——基于技术引进视角的研究[J]. 上海经济研究, 2019(2):46-57.
|
| [33] |
邱康权, 陈静, 吕雁琴. 中国营商环境综合发展水平的测度、地区差异与动态演变研究[J]. 数量经济技术经济研究, 2022, 39(2):121-143.
|
| [34] |
涂正革, 程烺, 张沐. 中国营商环境地区差异及时空演变特征研究[J]. 数量经济技术经济研究, 2022, 39(7):3-25.
|
| [35] |
张三保, 康璧成, 张志学. 中国省份营商环境评价:指标体系与量化分析[J]. 经济管理, 2020, 42(4):5-19.
|
| [36] |
裴延峰. 中国产业结构变迁的空间不平衡对地区经济差距的影响[J]. 数量经济技术经济研究, 2022, 39(3):3-23.
|
/
| 〈 |
|
〉 |