
粮食安全背景下非洲跨国耕地投资空间格局及其驱动机制
|
段健(1986—),女,博士,副教授,研究方向为经济地理。E-mail:duanj@zjnu.edu.cn |
收稿日期: 2023-09-11
修回日期: 2024-04-22
网络出版日期: 2024-10-31
基金资助
国家自然科学基金项目(42001128)
国家自然科学基金项目(41971160)
浙江省哲学社会科学规划课题一般项目(25NDJC023YB)
国家资助博士后研究人员计划(GZC20230918)
2021年浙江师范大学青年博士专项(ZZ323205020520013060)
Spatial Patterns and Driving Mechanism of Transnational Farmland Investment in Africa under the Background of Food Security
Received date: 2023-09-11
Revised date: 2024-04-22
Online published: 2024-10-31
段健 , 汝旖星 , 姜海宁 , 王莹莹 , 金星星 . 粮食安全背景下非洲跨国耕地投资空间格局及其驱动机制[J]. 经济地理, 2024 , 44(9) : 174 -184 . DOI: 10.15957/j.cnki.jjdl.2024.09.018
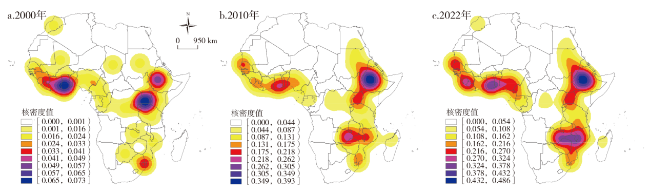
Based on the Land Matrix database,and using spatial analysis tools and spatial econometric models,this research dissects the spatial pattern characteristics and the impelling forces of overseas farmland investments in Africa from different countries worldwide. The results show that: 1) By 2022,African transnational farmland investments accounted for 28.71% of the global portfolio, spanning 42 African countries. The principal investment inflows into African farmland originated from Africa's developed countries,developed Western countries,Gulf countries,and Asian emerging countries. 2) The African transnational farmland investments present a T-shaped layout,demonstrating marked spatial clustering. This has led to the formation of three major investment hotspots: the Guinea coast areas,the Kenyan Plateau,and the Zambian Plateau. 3) The African transnational farmland investment mirrors a classic "resource-seeking" foreign direct investment (FDI),with water resources playing a pivotal role. There are "corruption preference" and "institutional weakness preference" in the global farmland investments in Africa. The economic development level and market size of the host countries do not significantly influence the transnational farmland investments.
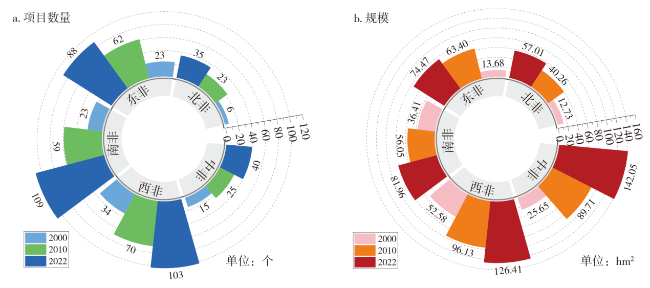
表1 2000—2022年非洲跨国耕地投资项目统计Tab.1 Statistics on transnational farmland investment projects in Africa from 2000 to 2022 |
| 时段 | 项目数量 (个) | 合同面积 (万hm2) | 实施面积 (万hm2) | 意向面积 (万hm2) | 实施率 (%) |
|---|---|---|---|---|---|
| 2000 | 101 | 141.05 | 46.73 | 145.85 | 33.13 |
| 2010 | 240 | 345.49 | 79.02 | 453.61 | 22.87 |
| 2022 | 373 | 481.90 | 103.17 | 683.04 | 21.41 |
表2 2022年非洲跨国耕地投资项目和面积(存量)前10位投资国Tab.2 Top 10 investor countries for transnational farmland investment projects and area (stock) in Africa in 2022 |
| 序号 | 投资国 | 项目数量(个) | 序号 | 投资国 | 合同面积(万hm2) | |
|---|---|---|---|---|---|---|
| 1 | 法国 | 47 | 1 | 美国 | 75.44 | |
| 2 | 南非 | 36 | 2 | 沙特阿拉伯 | 48.34 | |
| 3 | 英国 | 36 | 3 | 新加披 | 35.17 | |
| 4 | 美国 | 34 | 4 | 南非 | 34.61 | |
| 5 | 中国 | 30 | 5 | 法国 | 29.92 | |
| 6 | 沙特阿拉伯 | 28 | 6 | 中国 | 21.83 | |
| 7 | 阿联酋 | 24 | 7 | 英国 | 21.53 | |
| 8 | 瑞士 | 22 | 8 | 津巴布韦 | 19.66 | |
| 9 | 印度 | 19 | 9 | 阿联酋 | 18.14 | |
| 10 | 荷兰 | 19 | 10 | 加纳 | 17.94 |
表3 非洲跨国耕地投资主体及其结构变化(%)Tab.3 Changes in the structure of transnational farmland investment agents in Africa(%) |
| 投资主体 | 2000年 | 2010年 | 2022年 |
|---|---|---|---|
| 私营企业 | 79.63 | 55.88 | 54.92 |
| 国有企业 | 1.85 | 18.49 | 14.04 |
| 金融机构 | 16.67 | 21.43 | 24.38 |
| 非盈利组织 | 0.00 | 0.84 | 0.49 |
| 其他 | 1.85 | 3.36 | 6.17 |
表4 2022年非洲跨国耕地投资项目和面积(存量)前10位东道国Tab.4 Top 10 host countries for transnational farmland investment projects and area (stock) in Africa in 2022 |
| 序号 | 东道国 | 项目数量 (个) | 序号 | 东道国 | 合同面积 (万hm2) | |
|---|---|---|---|---|---|---|
| 1 | 埃塞俄比亚 | 41 | 1 | 刚果(金) | 67.68 | |
| 2 | 莫桑比克 | 40 | 2 | 埃塞俄比亚 | 48.95 | |
| 3 | 赞比亚 | 35 | 3 | 利比里亚 | 45.44 | |
| 4 | 尼日利亚 | 25 | 4 | 苏丹 | 44.57 | |
| 5 | 加纳 | 22 | 5 | 加蓬 | 34.64 | |
| 6 | 苏丹 | 19 | 6 | 莫桑比克 | 32.80 | |
| 7 | 坦桑尼亚 | 18 | 7 | 赞比亚 | 27.48 | |
| 8 | 乌干达 | 15 | 8 | 加纳 | 26.32 | |
| 9 | 科特迪瓦 | 15 | 9 | 喀麦隆 | 23.03 | |
| 10 | 刚果(金) | 15 | 10 | 尼日利亚 | 21.94 |
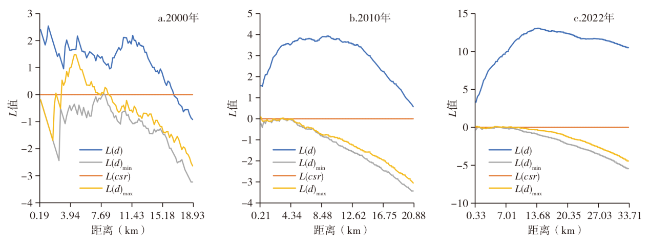
表5 非洲跨国耕地投资项目最邻近指数Tab.5 Nearest neighbor index for transnational farmland investment projects in Africa |
| 时间 | 2000年 | 2010年 | 2022年 |
|---|---|---|---|
| 集聚程度R | 1.00 | 0.55 | 0.39 |
| P值 | 0.70 | 0.00 | 0.00 |
表6 非洲跨国耕地投资规模的影响因素回归结果Tab.6 Regression results on factors affecting the scale of transnational farmland investment in Africa |
| 维度 | 指标(单位) | OLS | SLM | SEM |
|---|---|---|---|---|
| 资源禀赋 | CONSTANT | -1.0319 | -0.8711* | -0.4874 |
| 人均耕地数量(hm2) | 0.0173 | 0.0119 | 0.0734 | |
| 人均水资源使用量(m3) | 0.0610** | 0.0589*** | 0.0482* | |
| 人均耗电量(kW·h) | -0.0355 | -0.0381 | -0.0453** | |
| 农业用地百分比(%) | 0.0525 | 0.0476 | 0.0202 | |
| 化肥总消费量(kg/ha) | 0.0815 | 0.0869** | 0.0873** | |
| 谷类单产(t) | 0.0500 | 0.0593** | 0.0535* | |
| 基础设施 | 交通综合评分(分) | -0.3556* | -0.4168*** | -0.4760*** |
| 制度环境 | 政府治理指数 | -0.1860 | -0.2030* | -0.2957*** |
| 政治风险(分) | 0.0215 | -0.0624 | -0.1428 | |
| 恐怖主义事件发生率(%) | 0.0473 | 0.0335 | 0.0216 | |
| 司法独立水平(分) | -0.1181 | -0.1461 | 0.0126 | |
| 腐败发生率(%) | 0.6617** | 0.7623*** | 0.8194*** | |
| 经济环境 | 农业就业人员占比(%) | 0.0712 | 0.0355 | 0.0075 |
| 人均GDP(USD) | 0.0433 | 0.0450 | 0.0689** | |
| 通货膨胀(%) | 0.0903 | 0.0868 | 0.0440 | |
| 劳动力平均受教育年限(年) | 0.2765 | 0.2694** | 0.2940** | |
| 职业培训水平(%) | 0.6396 | 0.6941 | 0.4329 | |
| 劳动力市场(万人) | -0.9923 | -1.0627** | -1.2144*** | |
| 农业产值占GDP比(%) | 0.1055 | 0.1154** | 0.1269*** | |
| 市场规模(万人) | 0.1746 | 0.2081 | 0.3104* | |
| 开放程度 | 外资净流入(USD) | 0.0698 | 0.0727** | 0.0798** |
| 贸易开放水平(%) | 0.0206 | 0.0228 | 0.1734 | |
| 非关税壁垒 | 0.6528 | 0.6849 | 0.6038 | |
| R-squared | 0.6519 | 0.6735 | 0.7010 | |
| LogL | 48.46 | 49.8651 | 49.9234 | |
| AIC | -48.93 | -49.7302 | -51.8468 | |
| SC | -1.6422 | -0.4729 | -4.5598 |
注:*、**和***分别表示在10%、5%和1%水平下显著。表7同。 |
表7 跨国耕地投资规模与非洲粮食安全指标Pearson相关性系数Tab.7 Pearson correlation coefficients between the scale of transnational farmland investment and the indicators of food security in Africa |
| 非洲粮食安全分项指标 | 孕妇贫血患病率 | 平均膳食能量供应充足率 | 营养不良发生率 | 中度或重度粮食不安全发生率 | 食品进口 占比 | 5岁以下儿童发育不良占比 | 5岁以下儿童消瘦占比 | 基本饮用水占比 | 基本卫生 服务占比 |
|---|---|---|---|---|---|---|---|---|---|
| 耕地投资规模 | 0.130 | -0.290 | 0.278 | 0.404** | -0.014 | 0.253 | -0.085 | 0.151 | -0.348* |
注:非洲各国粮食安全指标数据来源于联合国粮农组织统计数据库(https://www.fao.org/statistics/zh/)。 |
| [1] |
|
| [2] |
|
| [3] |
中华人民共和国商务部. 中国对非洲政策文件[R/OL]. http://ug.mofcom.gov.cn/article/ddfg/zfhzzc/201611/20161101643343.shtml,2016-11-07.
|
| [4] |
中华人民共和国外交部. 中非合作论坛—约翰内斯堡行动计划[R/OL]. http://cja40.fmprc.gov.cn/gjhdq_676201/gjhdqzz_681964/zfhzlt_682902/zywj_682914/201512/t20151210_93875 36.shtml,2015-12-10.
|
| [5] |
中华人民共和国国务院新闻办公室. 新时代中非合作白皮书[R/OL]. http://www.scio.gov.cn/gxzt/dtzt/2021/xsddzfhzbps/,2021-11.
|
| [6] |
|
| [7] |
卢新海, 韩璟. 当前非洲海外耕地投资东道国耕地投资潜力评价[J]. 中国土地科学, 2014, 28(1):82-90.
|
| [8] |
|
| [9] |
|
| [10] |
|
| [11] |
|
| [12] |
|
| [13] |
|
| [14] |
王大伟, 潘子纯, 韩璟. 非洲海外耕地投资发展的时空格局演变与影响因素[J]. 地域研究与开发, 2020, 39(5):47-52.
|
| [15] |
|
| [16] |
|
| [17] |
韩璟, 杨莼, 柯楠, 等. 中美对非洲海外耕地投资东道国的选择差异与影响因素分析[J]. 中国土地科学, 2018, 32(8):37-43.
|
| [18] |
唐承丽, 陈伟杨, 吴佳敏, 等. 长江经济带开发区空间分布与产业集聚特征研究[J]. 地理科学, 2020, 40(4):657-664.
|
| [19] |
禹文豪, 艾廷华. 核密度估计法支持下的网络空间POI点可视化与分析[J]. 测绘学报, 2015, 44(1):82-90.
|
| [20] |
姜海宁, 张文忠, 张建珍, 等. 21世纪以来非洲跨国移民空间格局及其对FDI影响[J]. 地理研究, 2021, 40(3):725-742.
|
| [21] |
潘子纯, 马林燕, 朱玉春. 中国海外耕地投资规模与地缘经济的耦合协调研究[J]. 地理学报, 2023, 78(9):2338-2357.
|
| [22] |
韩璟, 陈泽秀, 卢新海. 中国海外耕地投资发展的时空格局演变与影响因素[J]. 资源科学, 2020, 42(9):1715-1727.
|
| [23] |
韩璟, 周金佩, 卢新海. 中国海外耕地投资东道国空间分布及地缘关系影响[J]. 华中农业大学学报:社会科学版, 2021,(6):155-164,193-194.
|
| [24] |
贾盼娜, 刘爱民, 成升魁, 等. 中国农产品贸易格局变化及海外农业资源利用对策[J]. 自然资源学报, 2019, 34(7):1357-1364.
|
| [25] |
|
| [26] |
金晔, 林青宁, 毛世平. 深化中非农业投资合作面临的挑战与对策[J]. 国际贸易, 2022(10):19-26.
|
| [27] |
王贤彬, 韩永辉, 韦东明. 润滑效应抑或摩擦效应:东道国腐败控制对中国企业海外并购的影响研究[J]. 国际经贸探索, 2023, 39(4):52-66.
|
| [28] |
张悦, 李众, 曲春红. 非洲农业现代化发展:现状、挑战与机遇[J]. 中国食物与营养, 2021, 27(6):17-22.
|
| [29] |
|
| [30] |
|
/
| 〈 |
|
〉 |