
北京市上市公司的功能环节的空间分布特征
|
卢明华(1978—),女,博士,副教授,研究方向为企业地理、产业地理。E-mail:lmhannie@vip.sina.com |
收稿日期: 2023-09-13
修回日期: 2024-06-18
网络出版日期: 2024-09-23
基金资助
国家自然科学基金项目(41971156)
国家自然科学基金项目(42071148)
Spatial Distribution of Different Functions of Listed Companies in Beijing
Received date: 2023-09-13
Revised date: 2024-06-18
Online published: 2024-09-23
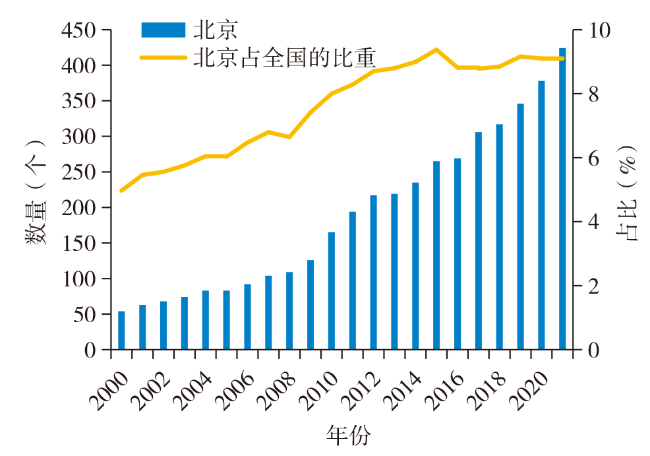
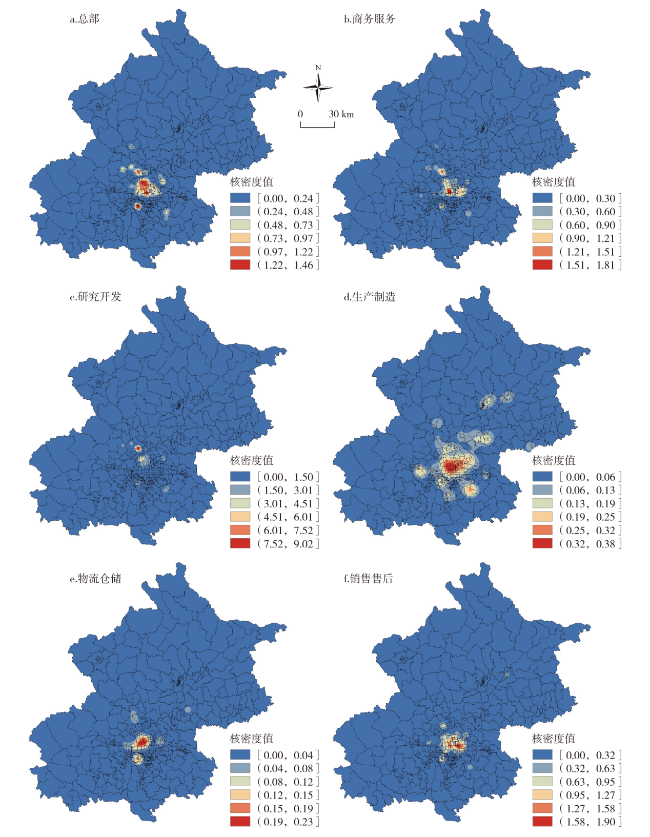
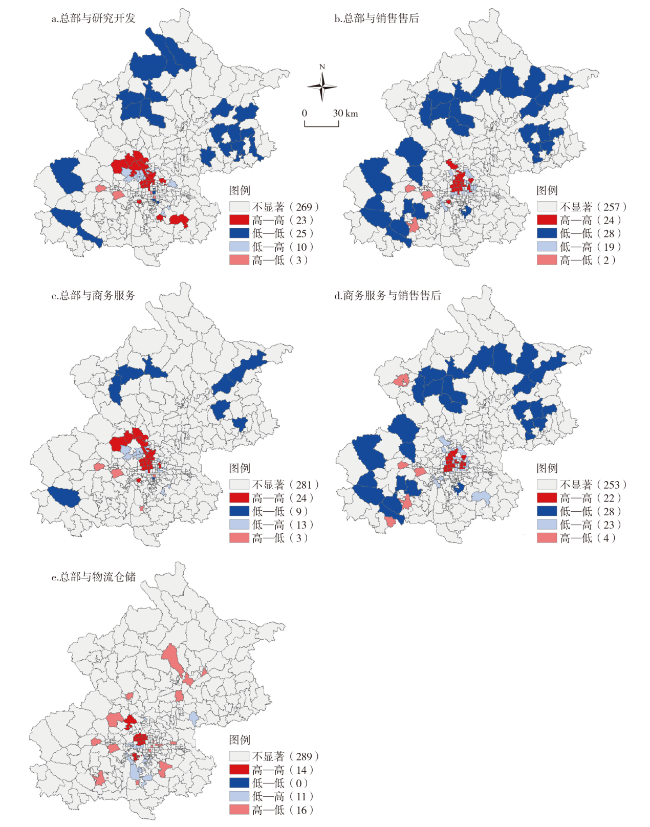
随着企业规模扩大,功能环节出现分化,不同功能环节有不同的区位偏好,在空间分布上具有不同特征。文章基于2021年北京市上市公司及其子公司的数据,利用双变量空间自相关、地理探测器等方法,分析了6个功能环节空间分布特征及相互空间关系。研究发现:①高级功能(总部、商务服务、研究开发功能)在北京的分布数量较多,低级功能(生产制造、物流仓储功能)在北京分布数量较少。②功能环节主要集中在清河街道、西北旺地区、北京经济技术开发区、中关村街道、花乡街道以及北太平庄街道,且高级功能环节分布较为相似,低级功能环节分布地区差别较大。③功能环节呈现“同功能集聚”现象:各个功能均为集聚分布,其中研发功能集聚程度最明显;高级功能主要呈带状分布,低级功能则呈团块状分布。④功能环节间呈现“异功能共聚”现象:两两功能均共聚,其中总部与研究开发功能共聚最明显;而低级功能对于高级功能具有空间相随性。
卢明华 , 尚子君 , 贺静怡 . 北京市上市公司的功能环节的空间分布特征[J]. 经济地理, 2024 , 44(8) : 77 -86 . DOI: 10.15957/j.cnki.jjdl.2024.08.010
With the expansion of enterprises and the occurrence of functional segmentation,different functions have different location preferences and exhibit distinct spatial distribution characteristics. Based on the data of listed companies and their subsidiaries in Beijing in 2021,this article uses the methods of dual variable spatial autocorrelation and geographic detector to analyze spatial distribution characteristics of six functional parts and their spatial relationships. It's found that: 1) The number of high-level functions (headquarters,business services,research and development) was relatively large in Beijing,and the number of low-level functions (manufacturing,logistics and warehousing) was relatively small in Beijing. 2) Six functional parts were mainly agglomerated in Qinghe Street,Xibeiwang,Beijing Economic and Technological Development Zone, Zhongguancun Street, Huaxiang Street, and north Taipingzhuang Street. The distribution of high-level functional parts was relatively similar, and the distribution of low-level functional parts was quite different. 3) Six functional parts exhibited a "same function agglomeration" phenomenon: all functions were agglomerated distribution,with the most obvious degree of agglomeration in R&D function. High-level functions exhibited a belt-like distribution,while low-level functions exhibited a block-like distribution. 4) Six functional parts exhibited an "hetero-function co-agglomeration" phenomenon: each pair of functions co-agglomerated,the degree of co-agglomeration between high-level functions was higher than that between low-level functions,therein the most obvious co-agglomeration between headquarters and research and development functions,while low-level functions exhibited spatial following to high-level functions.
表1 北京市上市公司的功能环节划分Tab.1 Division of functional parts of listed companies in Beijing |
| 功能环节 | 主营业务范围 | 数量(个) | 占比(%) |
|---|---|---|---|
| 总部 | 包括决策、行政、财务、人事、法务等企业管理功能 | 388 | 14.96 |
| 商务服务 | 包括货币金融服务、资本市场服务、资产管理、信息咨询、互联网和相关服务、软件和信息技术服务等 | 371 | 14.31 |
| 研究开发 | 包括基础研究、应用开发、设计、测试等 | 1009 | 38.91 |
| 生产制造 | 与产品实际生产有关的所有活动,包括生产、制造、建设、循环利用等 | 326 | 12.57 |
| 物流仓储 | 与货物运输有关的所有活动,包括运输、仓储、配送等 | 50 | 1.93 |
| 销售售后 | 包括销售、市场营销、贸易、客户服务、技术支持、维护、保养等 | 449 | 17.32 |
| 总计 | 2593 | 100.00 | |
表2 北京市分区域不同功能环节数量及占比(单位:个、%)Tab.2 Number and proportion of different functional parts in different regions of Beijing (unit: number,%) |
| 区域 | 全部 | 总部 | 商务服务 | 研究开发 | 生产制造 | 物流仓储 | 销售售后 | |||||||||||||
|---|---|---|---|---|---|---|---|---|---|---|---|---|---|---|---|---|---|---|---|---|
| 数量 | 占比 | 数量 | 占比 | 数量 | 占比 | 数量 | 占比 | 数量 | 占比 | 数量 | 占比 | 数量 | 占比 | |||||||
| 首都功能核心区 | 342 | 13.2 | 64 | 16.0 | 71 | 19.0 | 66 | 6.5 | 33 | 10.0 | 4 | 8.0 | 104 | 23.0 | ||||||
| 东城区 | 153 | 5.9 | 26 | 6.7 | 29 | 7.8 | 33 | 3.3 | 13 | 4.0 | 0 | 0.0 | 52 | 12.0 | ||||||
| 西城区 | 189 | 7.3 | 38 | 9.8 | 42 | 11.0 | 33 | 3.3 | 20 | 6.1 | 4 | 8.0 | 52 | 12.0 | ||||||
| 城市功能拓展区 | 1425 | 55.0 | 233 | 60.0 | 204 | 55.0 | 618 | 61.0 | 115 | 35.0 | 33 | 66.0 | 222 | 49.0 | ||||||
| 朝阳区 | 373 | 14.4 | 41 | 11.0 | 62 | 17.0 | 126 | 12.0 | 53 | 16.0 | 4 | 8.0 | 87 | 19.0 | ||||||
| 海淀区 | 831 | 32.0 | 158 | 41.0 | 108 | 29.0 | 417 | 41.0 | 42 | 13.0 | 19 | 38.0 | 87 | 19.0 | ||||||
| 丰台区 | 157 | 6.1 | 28 | 7.2 | 23 | 6.2 | 48 | 4.8 | 16 | 4.9 | 7 | 14.0 | 35 | 7.8 | ||||||
| 石景山区 | 64 | 2.5 | 6 | 1.6 | 11 | 3.0 | 27 | 2.7 | 4 | 1.2 | 3 | 6.0 | 13 | 2.9 | ||||||
| 城市发展新区 | 636 | 24.5 | 77 | 20.0 | 75 | 20.0 | 256 | 25.0 | 127 | 39.0 | 11 | 22.0 | 90 | 20.0 | ||||||
| 通州区 | 56 | 2.2 | 10 | 2.6 | 9 | 2.4 | 12 | 1.2 | 16 | 4.9 | 0 | 0.0 | 9 | 2.0 | ||||||
| 顺义区 | 136 | 5.2 | 15 | 3.9 | 14 | 3.8 | 37 | 3.7 | 38 | 12.0 | 4 | 8.0 | 28 | 6.2 | ||||||
| 大兴区 | 258 | 9.9 | 26 | 6.7 | 26 | 7.0 | 136 | 13.0 | 39 | 12.0 | 3 | 6.0 | 28 | 6.2 | ||||||
| 昌平区 | 131 | 5.1 | 20 | 5.2 | 13 | 3.5 | 55 | 5.5 | 24 | 7.4 | 3 | 6.0 | 16 | 3.6 | ||||||
| 房山区 | 55 | 2.1 | 6 | 1.6 | 13 | 3.5 | 16 | 1.6 | 10 | 3.1 | 1 | 2.0 | 9 | 2.0 | ||||||
| 生态涵养区 | 190 | 7.3 | 14 | 3.6 | 21 | 5.7 | 69 | 6.8 | 51 | 16.0 | 2 | 4.0 | 33 | 7.4 | ||||||
| 门头沟区 | 45 | 1.7 | 5 | 1.3 | 6 | 1.6 | 13 | 1.3 | 15 | 4.6 | 0 | 0.0 | 6 | 1.3 | ||||||
| 平谷区 | 14 | 0.5 | 0 | 0.0 | 1 | 0.3 | 4 | 0.4 | 6 | 1.8 | 1 | 2.0 | 2 | 0.5 | ||||||
| 怀柔区 | 69 | 2.7 | 5 | 1.3 | 7 | 1.9 | 25 | 2.5 | 16 | 4.9 | 1 | 2.0 | 15 | 3.3 | ||||||
| 密云区 | 49 | 1.9 | 3 | 0.8 | 5 | 1.4 | 21 | 2.1 | 11 | 3.4 | 0 | 0.0 | 9 | 2.0 | ||||||
| 延庆区 | 13 | 0.5 | 1 | 0.3 | 2 | 0.5 | 6 | 0.6 | 3 | 0.9 | 0 | 0 | 1 | 0.2 | ||||||
表3 北京市上市公司不同功能环节的平均最近邻指数值Tab.3 Average nearest neighbor index of different functional parts of listed companies in Beijing |
| 功能 | 样本平均 距离(m) | 随机模式下的期望距离(m) | 平均邻近 指数R | Z值 | P值 |
|---|---|---|---|---|---|
| 总部 | 6365.25 | 11275.50 | 0.56 | -16.41 | 0.00 |
| 商务服务 | 1049.35 | 2954.99 | 0.36 | -23.76 | 0.00 |
| 生产制造 | 1415.23 | 2913.66 | 0.49 | -17.76 | 0.00 |
| 物流仓储 | 4562.28 | 6428.61 | 0.71 | -3.93 | 0.00 |
| 销售售后 | 881.64 | 2442.56 | 0.36 | -25.91 | 0.00 |
| 研究开发 | 464.05 | 1804.25 | 0.26 | -45.14 | 0.00 |
图3 北京市上市公司功能环节间的双变量LISA图Fig.3 LISA map of dual variable spatial autocorrelation between functional parts of listed companies in Beijing |
表4 北京市上市公司功能环节间的双变量空间自相关莫兰指数Tab.4 Moran's index of dual variable spatial autocorrelation between functional parts of listed companies in Beijing |
| 总部 | 商务服务 | 研究开发 | 生产制造 | 物流仓储 | 销售售后 | |
|---|---|---|---|---|---|---|
| 商务服务 | 0.245***(0.001) | |||||
| 研究开发 | 0.262***(0.001) | 0.177***(0.001) | ||||
| 生产制造 | 0.130***(0.001) | 0.093***(0.004) | 0.100***(0.006) | |||
| 物流仓储 | 0.213***(0.001) | 0.163***(0.001) | 0.110***(0.001) | 0.076***(0.005) | ||
| 销售售后 | 0.258***(0.001) | 0.216***(0.001) | 0.141***(0.001) | 0.129***(0.001) | 0.176***(0.001) |
注:*** 表示在置信度为99%时显著相关。表5同。 |
表5 北京市上市公司不同功能环节的地理探测器结果Tab.5 Geo-detector results of different functional parts of listed companies in Beijing |
| 功能 | 总部 | 商务服务 | 研究开发 | 生产制造 | 物流仓储 | 销售售后 |
|---|---|---|---|---|---|---|
| 总部 | - | 0.623***(0.000) | 0.790***(0.000) | 0.305**(0.000) | 0.282***(0.000) | 0.559***(0.000) |
| 商务服务 | 0.710***(0.000) | - | 0.679***(0.000) | 0.286***(0.000) | 0.126***(0.000) | 0.517***(0.000) |
| 研究开发 | 0.767***(0.000) | 0.758***(0.000) | - | 0.360***(0.000) | 0.105***(0.000) | 0.452***(0.000) |
| 生产制造 | 0.322***(0.000) | 0.473***(0.000) | 0.567***(0.000) | - | 0.134***(0.000) | 0.422***(0.000) |
| 物流仓储 | 0.382***(0.000) | 0.340***(0.000) | 0.389***(0.000) | 0.182***(0.000) | - | 0.270***(0.000) |
| 销售售后 | 0.548***(0.000) | 0.563***(0.000) | 0.441***(0.000) | 0.269***(0.000) | 0.222***(0.000) | - |
| [1] |
|
| [2] |
|
| [3] |
|
| [4] |
|
| [5] |
|
| [6] |
|
| [7] |
朱彦刚, 贺灿飞, 刘作丽. 跨国公司的功能区位选择与城市功能专业化研究[J]. 中国软科学, 2010, 239(11):98-109.
|
| [8] |
贺灿飞, 肖晓俊. 跨国公司功能区位实证研究[J]. 地理学报, 2011, 66(12):1669-1681.
|
| [9] |
武前波, 宁越敏. 中国城市空间网络分析——基于电子信息企业生产网络视角[J]. 地理研究, 2012, 31(2):207-219.
|
| [10] |
李国平, 方晓晖. 基于价值链分工的跨国生物医药企业在华布局模式[J]. 地域研究与开发, 2016, 35(4):6-11.
|
| [11] |
王俊松, 颜燕. 在华跨国公司功能区位的时空演化研究[J]. 地理科学, 2016, 36(3):352-358.
|
| [12] |
卢明华. 区域新型产业分工论[M]. 北京: 科学出版社, 2016.
|
| [13] |
盛科荣, 王丽萍, 孙威. 中国城市价值链功能分工及其影响因素[J]. 地理研究, 2020, 39(12):2763-2778.
|
| [14] |
杨亮洁, 杨永春, 潘竟虎. 中国西部城市参与全球和全国竞争的时空格局及网络结构演化[J]. 经济地理, 2019, 39(10):43-53.
|
| [15] |
赵渺希, 师浩辰, 王慧芹. 大都市区功能性多中心的产业集聚检验——以珠三角企业网络为例[J]. 地理研究, 2021, 40(12):3437-3454.
|
| [16] |
|
| [17] |
|
| [18] |
|
| [19] |
林柄全, 谷人旭, 王俊松. 集聚经济与基于价值链的企业区位选择——重新发现内部集聚经济[J]. 经济地理, 2020, 40(4):56-64,74.
|
| [20] |
|
| [21] |
|
| [22] |
|
| [23] |
宁越敏. 从劳动分工到城市形态(一)──评艾伦·斯科特的区位论[J]. 城市问题, 1995(2):18-21.
|
| [24] |
李健. 从全球生产网络到大都市区生产空间组织[D]. 上海: 华东师范大学, 2008.
|
| [25] |
|
| [26] |
|
| [27] |
|
| [28] |
赵静平, 卢明华, 刘汉初. 北京上市公司总部空间分布特征及影响因素[J]. 经济地理, 2020, 40(1):12-20.
|
| [29] |
王俊松, 潘峰华, 郭洁. 上海市上市企业总部的区位分布与影响机制[J]. 地理研究, 2015, 34(10):1920-1932.
|
| [30] |
何舜辉, 杜德斌, 王俊松. 上海市外资研发机构的空间演化及区位因素[J]. 地理科学进展, 2018, 37(11):1555-1566.
|
| [31] |
樊杰, 王宏远, 陶岸君, 等. 工业企业区位与城镇体系布局的空间耦合分析——洛阳市大型工业企业区位选择因素的案例剖析[J]. 地理学报, 2009, 64(2):131-141.
|
| [32] |
李国平, 卢明华. 北京高科技产业价值链区域分工研究[J]. 地理研究, 2002, 21(2):228-238.
|
| [33] |
卢明华, 李丽. 北京电子信息产业及其价值链空间分布特征研究[J]. 地理研究, 2012, 31(10):1861-1871.
|
| [34] |
曹田敏达. 北京市日资企业区位选择研究——基于价值链环节视角[D]. 北京: 首都师范大学, 2019.
|
| [35] |
赵静平. 北京上市公司空间分布特征及影响因素[D]. 北京: 首都师范大学, 2019.
|
| [36] |
张可云, 裴相烨. 大城市制造业企业空间扩张模式及其对企业效率的影响——以北京市上市企业为例[J]. 地理科学进展, 2021, 40(10):1613-1625.
|
| [37] |
|
| [38] |
王劲峰, 徐成东. 地理探测器:原理与展望[J]. 地理学报, 2017, 72(1):116-134.
|
/
| 〈 |
|
〉 |