
普惠金融影响地方政府债务的作用机制及其时空效应
|
袁旭宏(1986—),男,博士后,讲师,硕士生导师,研究方向为金融经济与产业经济。E-mail:270155430@qq.com |
收稿日期: 2023-10-25
修回日期: 2024-06-29
网络出版日期: 2024-09-23
基金资助
湖南省社会科学基金一般项目(22YBA029)
Spatiotemporal Effects and Mechanisms of Inclusive Finance on Local Debt in China
Received date: 2023-10-25
Revised date: 2024-06-29
Online published: 2024-09-23
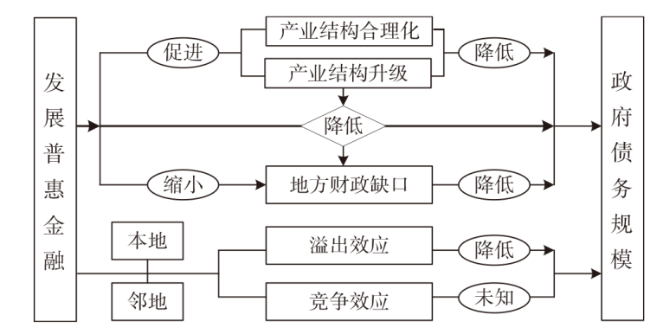
文章基于我国2011—2021年地级及以上市域面板数据,运用固定效应模型、分位数估计、空间滞后模型等方法,探讨了普惠金融影响地方政府债务规模的时空效应与作用机制,并对其稳定性进行了检验。结果表明:①从时序效应来看,发展普惠金融具有降低地方政府债务规模的效应,这种“降债”效应呈现出随着地方政府债务规模增加而减弱的特点,同时表现出人口流出地/流入地、城市区位、经济发展水平、城市商业水平方面的异质性;②从空间效应来看,发展普惠金融既产生了降低本地政府债务规模的直接效应,还产生了间接降低相邻地区政府债务规模的溢出效应,且直接效应大于间接效应;③机制分析发现,发展普惠金融通过促进地区产业结构升级、提升产业结构合理化、缩小地方财政缺口可以降低地方政府债务规模。未来,应强化金融有效服务实体经济发展的体制机制建设,发挥普惠金融有效减低地方政府债务规模的机制作用,共同促进经济高质量发展。
袁旭宏 , 张怀志 , 马超群 , 崔浩南 . 普惠金融影响地方政府债务的作用机制及其时空效应[J]. 经济地理, 2024 , 44(8) : 68 -76 . DOI: 10.15957/j.cnki.jjdl.2024.08.009
Based on the panel data of prefecture-level cities and above in China from 2011 to 2021, this study employs fixed effects models,quantile regression,and spatial lag models to analyze,examining the spatiotemporal effects and mechanisms of inclusive finance on the scale of local government debt. The findings are as follows: 1) In terms of temporal effect, the development of inclusive finance has the effect of reducing the scale of local government debt. This debt-reduction effect diminishes as the scale of local debt increases and exhibits heterogeneity based on factors such as population migration,urban location,economic development level, and urban commercial level. 2) In terms of spatial effect,the development of inclusive finance not only directly reduces the scale of local government debt, but also indirectly reduces the scale of government debt in neighboring regions through spillover effects,and the direct effect is more pronounced than the indirect effect. 3) The development of inclusive finance reduces local government debt by promoting industrial structure upgrades,enhancing the rationalization of industrial structures,and narrowing local fiscal gaps. It should focus on strengthening the institutional mechanisms that enable finance to effectively serve the real economy,leveraging the role of inclusive finance in reducing local government debt scales and jointly fostering high-quality economic development.
表1 基准回归及分位数回归Tab.1 Baseline regression and quantile regression |
| 变量 | (1)fe (ln debt) | (2)fe (ln debt) | (3)Q10 (ln debt) | (4)Q25 (ln debt) | (5)Q50 (ln debt) | (6)Q75 (ln debt) | (7)Q90 (ln debt) |
|---|---|---|---|---|---|---|---|
| lnifi | -0.345***(0.0786) | -0.245***(0.0774) | -0.369***(0.0455) | -0.290***(0.0233) | -0.317***(0.0206) | -0.250***(0.00701) | -0.237***(0.0134) |
| lnpai | 0.0848**(0.0389) | 0.276***(0.0382) | 0.230***(0.0403) | 0.302***(0.0598) | 0.270***(0.0711) | 0.293***(0.0581) | |
| lngong | 0.400***(0.0540) | 0.543***(0.0870) | 0.476***(0.0555) | 0.363***(0.0460) | 0.415***(0.0808) | 0.388***(0.0605) | |
| lnkexue | 0.247***(0.0221) | 0.343***(0.0403) | 0.347***(0.0132) | 0.402***(0.0108) | 0.391***(0.00483) | 0.392***(0.00310) | |
| lnxue | 0.0396(0.0900) | 0.237***(0.0737) | 0.201**(0.0815) | 0.268***(0.0412) | 0.278***(0.0592) | 0.209***(0.00293) | |
| lnrbo | -0.242***(0.0425) | -0.0498(0.0496) | -0.0463***0.0150) | -0.0625***(0.0160) | -0.0741***.00219) | -0.0856***0.00638) | |
| lnryi | 0.165(0.106) | 0.670***(0.0652) | 0.658***(0.0672) | 0.823***(0.125) | 0.933***(0.0639) | 0.946***(0.0489) | |
| Yh | -31.78***(9.774) | -0.356***(0.0499) | -0.438***(0.0686) | -0.483***(0.0336) | -0.503***(0.0493) | -0.480***(0.0181) | |
| 经度 | -19.70***(7.255) | -0.495(0.460) | 1.174***(0.156) | 0.997***(0.130) | 1.294***(0.392) | 0.818***(0.0900) | |
| 纬度 | -37.17***(12.89) | -0.770***(0.150) | -0.757***(0.0667) | -0.571***(0.101) | -0.728***(0.0154) | -0.642***(0.0860) |
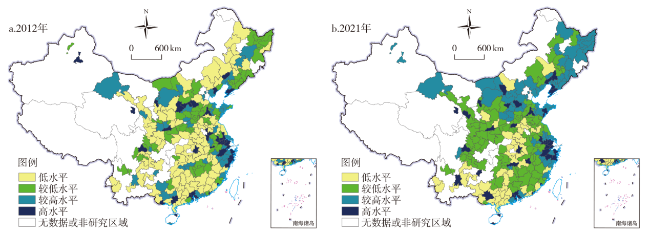
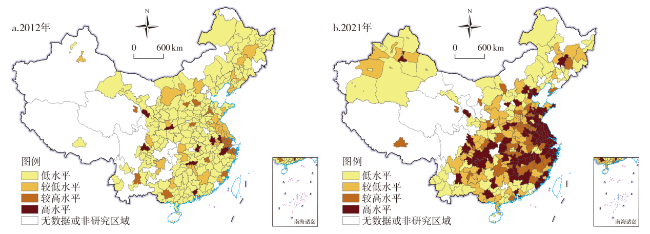
图2 地级及以上城市普惠金融发展指数的时空演化注:基于自然资源部标准地图服务网站下载的审图号为GS(2023)2767号的标准地图制作,底图无修改。图3同。 Fig.2 Spatiotemporal evolution of inclusive finance development index in prefecture-level cities and above |
表2 莫兰指数Tab.2 Moran index |
| 年份 | lndebt | lnifi | |||||
|---|---|---|---|---|---|---|---|
| Moranindex | Z值 | P值 | Moranindex | Z值 | P值 | ||
| 2012 | 0.0969 | 1.8066 | 0.0708 | 0.1735 | 3.2641 | 0.0011 | |
| 2013 | 0.0611 | 1.1764 | 0.2394 | 0.2269 | 4.2175 | 0.0000 | |
| 2014 | 0.0914 | 1.7088 | 0.0875 | 0.3757 | 6.7858 | 0.0000 | |
| 2015 | 0.0966 | 1.8002 | 0.0718 | 0.3260 | 5.9739 | 0.0000 | |
| 2016 | 0.1167 | 2.1531 | 0.0313 | 0.4453 | 8.0565 | 0.0000 | |
| 2017 | 0.1583 | 2.8842 | 0.0039 | 0.5066 | 9.1119 | 0.0000 | |
| 2018 | 0.1950 | 3.5302 | 0.0004 | 0.4158 | 7.5697 | 0.0000 | |
表3 空间估计结果与空间效应分解Tab.3 Spatial estimation results and spatial effect decomposition |
| (1) SAR | (2) Direct | (3) Indirect | (4) Total | (5) SAR | (6) Direct | (7) Indirect | (8) Total | |
|---|---|---|---|---|---|---|---|---|
| lnifi | -4.576**(1.870) | -4.585**(1.952) | -1.375**(0.633) | -5.960**(2.545) | -3.845**(1.883) | -3.847*(1.969) | -1.210*(0.656) | -5.057*(2.594) |
| 控制变量 | Y | Y | Y | Y | Y | Y | Y | Y |
| rho | 0.243***(0.0323) | 0.252***(0.0322) | ||||||
| sigma2_e | 0.114***(0.00460) | 0.115***(0.00467) | ||||||
| N | 1239 | 1239 | ||||||
| R2 | 0.420 | 0.328 | ||||||
| 时点固定 | Y | Y | ||||||
| 个体固定 | Y | Y | ||||||
| hausman | 412.95*** | 189.6*** | ||||||
表4 机制检验Tab.4 Mechanism test |
| (1) lnCaiq | (2) lndebt | (3) lnTs | (4) lndebt | (5) lnTl | (6) lndebt | (7) lnCaiq | |
|---|---|---|---|---|---|---|---|
| lnifi | -0.0799*** | -0.2274*** | 0.113*** | -0.229*** | 0.0215* | -0.241*** | -0.0565** |
| (-2.8239) | (-2.9211) | (0.0196) | (0.0777) | (0.0129) | (0.0849) | (0.0282) | |
| lnTs | -0.140* | -0.208*** | |||||
| (0.0720) | (0.0281) | ||||||
| lnCaiq | 0.1726*** | ||||||
| (3.7667) | |||||||
| lnTl | -1.107*** | ||||||
| (0.154) | |||||||
| 控制变量 | Y | Y | Y | Y | Y | Y | Y |
| _cons | 13.043*** | -7.2667*** | 1.336*** | -4.879*** | -0.00721 | -2.593* | 13.31*** |
| (29.1873) | (-5.7129) | (0.309) | (1.110) | (0.235) | (1.380) | (0.444) | |
| N | 2854 | 2480 | 2880 | 2507 | 2067 | 1762 | 2852 |
| R2 | 0.8938 | 0.8835 | 0.8817 | 0.8860 | 0.8323 | 0.9078 | 0.8960 |
| Hausman | 793.25*** | 65.10*** | 911.19*** | 257.65*** | 82.00*** | 367.18*** | 6729.86*** |
| sobel检验 | -0.1805***(-6.539) | -0.0212***(-2.721) | -0.038**(z=-2.215) | -0.0246*(-1.648) | |||
| Goodman 1 | -0.1805***(-6.532) | -0.0212***(-2.683) | -0.038**(z=-2.198) | -0.0246*(-1.646) | |||
| Goodman 2 | -0.1805***(-6.547) | -0.0212***(-2.761) | -0.038**(z=-2.233) | -0.0246*(-1.649) | |||
| 中介效应 | -0.1805***(-6.539) | -0.0212***(-2.721) | -0.038**(z=-2.215) | -0.0246***(-1.652) | |||
| 直接效应 | -0.0512***(-0.720) | -0.2126***(-3.209) | -0.190**(z=-2.23) | -0.7549***(-21.876) | |||
| 总效应 | -0.2317***(-3.471) | -0.2338***(-3.521) | -0.228***(z=-2.64) | -0.7795***(-20.750) | |||
| 占比 | 0.7790 | 0.0908 | 0.1685 | 0.0316 | |||
表5 分区域与经济水平的异质性检验Tab.5 Heterogeneity test in different region and based on the economic level |
| 变量 | (1) 人口流入 | (2) 人口流出 | (3) 东部 | (4) 中部 | (5) 西部 | (6) 高于人均GDP | (7) 低于人均GDP | (8) 一线城市 | (9) 二线城市 | (10) 其他城市 |
|---|---|---|---|---|---|---|---|---|---|---|
| lnifi | -0.295***(0.0875) | -0.103(0.216) | -0.307*(0.166) | -0.281**(0.112) | -0.235*(0.134) | -0.168 (0.151) | -0.263***(0.0934) | 2.362***(0.555) | 0.132 (0.390) | -0.263***(0.0832) |
| _cons | -6.589***(1.410) | -5.439**(2.263) | 0.0799(2.190) | 0.00924(1.776) | -8.257***(1.832) | -4.423** (1.755) | -6.964***(1.527) | 15.55***(4.451) | 6.735*(3.896) | -6.522***(1.235) |
| N | 1760 | 748 | 893 | 943 | 672 | 1013 | 1495 | 149 | 306 | 2053 |
| R2 | 0.8176 | 0.9161 | 0.9034 | 0.8911 | 0.8734 | 0.9103 | 0.8068 | 0.9593 | 0.9192 | 0.8253 |
| Hausman | 35.84*** | 53.82*** | 1682.7*** | 266.85*** | 69.86*** | 300.50*** | 98.33*** | 14.38** | 157.54*** | 46.13*** |
| [1] |
余海跃, 康书隆. 地方政府债务扩张、企业融资成本与投资挤出效应[J]. 世界经济, 2020, 43(7):49-72.
|
| [2] |
赵文举, 张曾莲. 地方政府债务风险会加剧区域性金融风险聚集吗[J]. 当代财经, 2021(6):38-50.
|
| [3] |
杜晓山. 小额信贷的发展与普惠性金融体系框架[J]. 中国农村经济, 2006(8):70-73,78.
|
| [4] |
欧理平. 普惠金融对商业银行盈利可持续性的影响研究[J]. 学术论坛, 2016, 39(4):41-45.
|
| [5] |
梁榜, 张建华. 中国普惠金融创新能否缓解中小企业的融资约束[J]. 中国科技论坛, 2018(11):94-105.
|
| [6] |
欧卫东, 李殿相, 李秋然, 等. 浅论金融深化对中国税收增长的影响[J]. 税务研究, 2019(4):98-103.
|
| [7] |
张曾莲, 王莹. 地方政府债务、支出效率与金融稳定的互动关系研究——基于中国30个省份样本的实证分析[J]. 软科学, 2021, 35(9):1-7.
|
| [8] |
刘勇政, 冯海波. 腐败、公共支出效率与长期经济增长[J]. 经济研究, 2011, 46(9):17-28.
|
| [9] |
张珍花, 杨朝晖. 数字普惠金融对经济高质量增长影响研究——基于政府参与视角[J]. 华东经济管理, 2022, 36(4):71-78.
|
| [10] |
黎翠梅, 周莹. 数字普惠金融对农村消费的影响研究——基于空间计量模型[J]. 经济地理, 2021, 41(12):177-186.
|
| [11] |
王秋颖, 赵德海. 农村普惠金融供给侧改革的现实困境与破解路径[J]. 现代经济探讨, 2020(10):76-81,125.
|
| [12] |
李爱真, 苏治, 付红妍. 金融发展、技术创新与产业升级关系的实证研究——基于中国277个地级市面板数据[J]. 经济纵横, 2022(5):39-51.
|
| [13] |
郑录军, 韩庆潇, 王兆旭. 金融科技、目标相容与小微信贷供给——基于区域问卷调查的微观银行证据[J]. 国际金融研究, 2023(3):50-60.
|
| [14] |
邹伟, 凌江怀. 普惠金融与中小微企业融资约束——来自中国中小微企业的经验证据[J]. 财经论丛, 2018(6):34-45.
|
| [15] |
梁晓琴. 数字普惠金融对地方税收影响的实证研究[J]. 审计与经济研究, 2020, 35(5):96-104.
|
| [16] |
随力瑞, 金浩. 普惠金融对产业结构升级的作用机制与效应研究[J]. 审计与经济研究, 2022, 37(4):110-118.
|
| [17] |
唐文进, 李爽, 陶云清. 数字普惠金融发展与产业结构升级——来自283个城市的经验证据[J]. 广东财经大学学报, 2019, 34(6):35-49.
|
| [18] |
王正新, 李丹丹, 张翔宇. 特色小镇建设对县域经济高质量发展的影响——以浙江为例的准自然实验研究[J]. 数量经济研究, 2022, 13(4):53-70.
|
| [19] |
肖叶. 财政支出偏向促进了城投债发行吗——基于新口径的实证分析[J]. 山西财经大学学报, 2020, 42(8):43-55.
|
| [20] |
吕健. 影子银行推动地方政府债务增长了吗[J]. 财贸经济, 2014(8):38-48.
|
| [21] |
黄春元, 毛捷. 财政状况与地方债务规模——基于转移支付视角的新发现[J]. 财贸经济, 2015(6):18-31.
|
| [22] |
陈瑞, 卞洋, 齐天翔. 房价波动对地方债规模的影响——基于省级数据的实证研究[J]. 财政研究, 2016(6):86-94.
|
| [23] |
蒲丹琳, 王善平. 官员晋升激励、经济责任审计与地方政府投融资平台债务[J]. 会计研究, 2014(5):88-93,95.
|
| [24] |
彭文斌, 曹笑天. 城市更新作用下生态韧性时空分异及其影响效应——以环长株潭城市群为例[J]. 经济地理, 2023, 43(10):44-52.
|
| [25] |
袁航, 朱承亮. 国家高新区推动了中国产业结构转型升级吗[J]. 中国工业经济, 2018(8):60-77.
|
| [26] |
|
| [27] |
|
/
| 〈 |
|
〉 |