
内陆开放型经济—出境交通复合系统的脆弱性及影响机理
|
李杰梅(1975—),女,博士,教授,硕士生导师,研究方向为交通运输经济地理、城市与区域发展。E-mail:lijiemei@kust.edu.cn |
收稿日期: 2023-12-14
修回日期: 2024-04-08
网络出版日期: 2024-09-23
基金资助
国家自然科学基金项目(72263022)
国家自然科学基金项目(71764013)
Vulnerability and Influencing Mechanism of Open Economy-Outbound Traffic Composite System in Chinese Mainland
Received date: 2023-12-14
Revised date: 2024-04-08
Online published: 2024-09-23
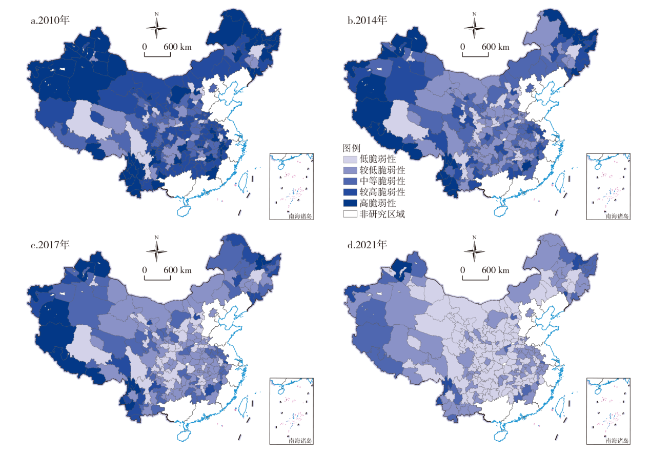
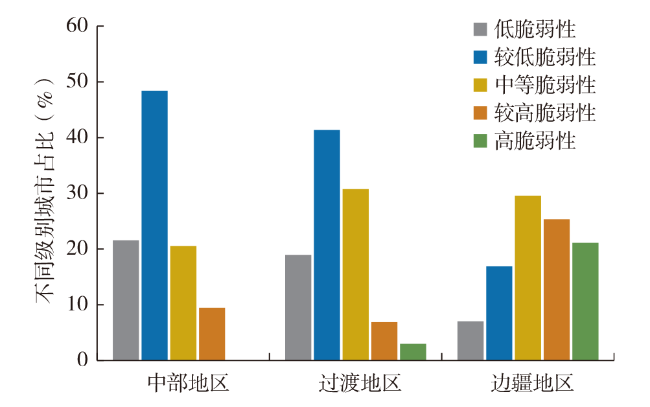
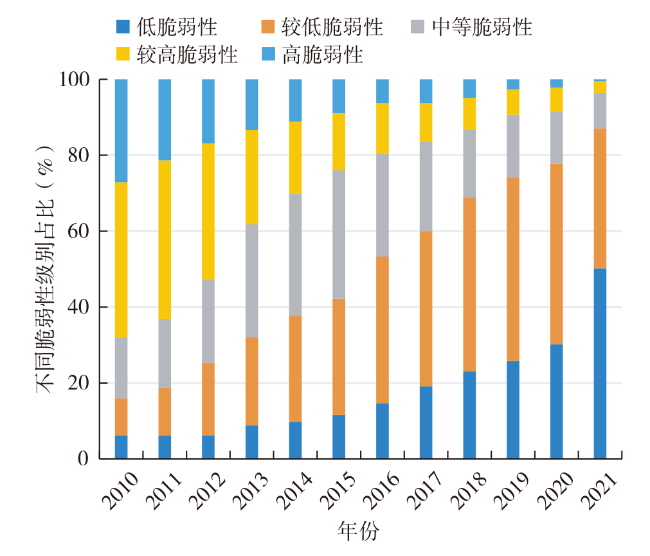
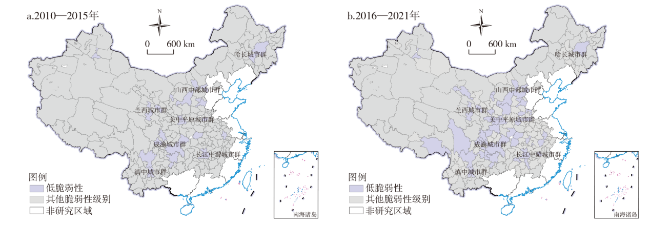
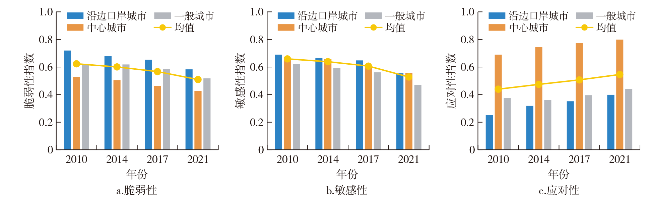
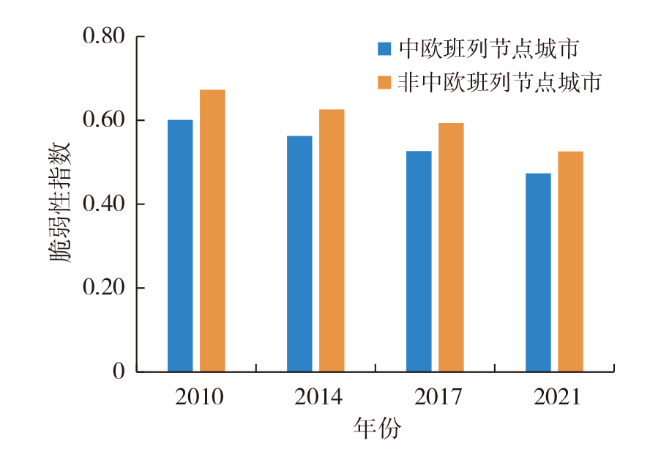
在依托国际互联互通交通基础设施扩大内陆开放的大背景下,文章从敏感性和应对性2个维度构建开放型经济—出境交通复合系统脆弱性评价指标体系,采用集对分析法测算脆弱性,并运用泰尔指数、空间马尔科夫链及障碍度模型分析其空间差异特征、空间溢出效应及障碍因子。结果表明:①我国内陆地区开放型经济—出境交通复合系统脆弱性呈以中部地区为核心向边疆地区逐渐增大的圈层结构。低脆弱城市呈以城市群为中心的“群”状分布特征;中心城市脆弱性最低,沿边口岸城市脆弱性最高;且随时间演化系统脆弱性逐年降低。②系统脆弱性的空间差异逐年上升,省内差异贡献大于省际差异,西藏、云南、黑龙江、四川等是差异主要来源地。③脆弱性类型趋向于保持不变,低脆弱性城市具有显著的正向空间溢出效应。④外贸和外资依存度、出境交通最短旅行时间、货运周转量、进出口贸易总额等是脆弱性降低的主要障碍因子。
李杰梅 , 张远雄 , 许文娟 . 内陆开放型经济—出境交通复合系统的脆弱性及影响机理[J]. 经济地理, 2024 , 44(8) : 37 -47 . DOI: 10.15957/j.cnki.jjdl.2024.08.006
Under the background of expanding opening-up of Chinese mainland through international interconnection and transportation infrastructure,this paper constructs the vulnerability evaluation index system of open economy-outbound transportation system from the two dimensions of sensitivity and responsiveness,uses set pair analysis method to measure its vulnerability,and uses Theil index, spatial Markov chain and obstacle degree model to analyze its spatial difference characteristics, spillover effect and obstacle factors. The results show that: 1) The vulnerability of the coupling system between the open economy and outbound traffic in Chinese mainland shows a circle structure with the central region as the core and gradually increasing along the border areas. The low-vulnerable cities show the characteristics of "cluster" distribution centered on urban agglomerations. The vulnerability of the central cities is the lowest, and the vulnerability of the border port cities is the highest. The vulnerability of the system decreases year by year. 2) The spatial difference of system vulnerability is increasing year by year,and the contribution of intra-provincial difference is greater than that of inter-provincial difference. 3) The type of vulnerability tends to remain the same,and the low-vulnerability cities have a significant positive spatial spillover effect. 4) Dependence on foreign trade and foreign capital, minimum travel time of outbound transportation, freight turnover, total import and export trade are the main obstacles to reduce vulnerability. The research conclusions can provide decision-making reference for Chinese mainland to achieve high-quality and sustainable development of open economy by relying on the opening channel.
表1 内陆开放型经济—出境交通复合系统脆弱性评价指标体系Tab.1 Vulnerability evaluation index system of open economy-outbound traffic composite system in Chinese mainland |
| 目标层 | 准则层 | 结构层 | 指标层 | 指标含义与属性 | 权重 |
|---|---|---|---|---|---|
| 开 放 型 经 济 子 系 统 | 敏 感 性 指 标 | 国际开放依赖度 | S11外贸依存度 | 反映经济活动对外贸的依赖程度(+) | 0.0995 |
| S12外资依存度 | 反映经济活动受外资影响程度(+) | 0.0764 | |||
| S13外商经济贡献度 | 反映外商经济扰动影响程度(+) | 0.0663 | |||
| S14国际旅游开放度 | 反映国际旅游创收外汇影响程度(+) | 0.0701 | |||
| 国内开放依赖度 | S15内贸依存度 | 反映国内消费市场的占比影响(-) | 0.0302 | ||
| S16内资依存度 | 反映内资实际利用情况(-) | 0.0304 | |||
| S17国内旅游开放度 | 反映国内旅游收入的占比影响(-) | 0.0203 | |||
| 应 对 性 指 标 | 宏观经济基础 | R11人均GDP | 反映宏观经济基础(+) | 0.0151 | |
| R12产业结构指数 | 反映地区产业发展水平(+) | 0.0176 | |||
| R13金融发展规模 | 反映地区融资机会和供给能力(+) | 0.0119 | |||
| R14大专及以上在校学生数占比 | 反映人力资本水平 (+) | 0.0051 | |||
| 政府调控 | R15人均固定资产投资 | 反映经济发展动力(+) | 0.0233 | ||
| R16科技支出占GDP比重 | 反映地区技术创新投入(+) | 0.0082 | |||
| R17国家级经济技术开发区数量 | 反映开放型经济质量(+) | 0.0249 | |||
| 出 境 通 道 子 系 统 | 敏 感 性 指 标 | 关键路径通行时长 | S21内陆—口岸公路最短旅行时间 | 反映内陆—口岸间的公路可达性(+) | 0.0445 |
| S22内陆—口岸铁路最短旅行时间 | 反映内陆—口岸间的铁路可达性(+) | 0.0345 | |||
| 运输通道质量 | S23铁路技术水平 | 反映铁路发展水平(-) | 0.0221 | ||
| S24高速公路通车里程 | 反映公路发展水平(-) | 0.0209 | |||
| S25民航及通用机场数量 | 反映航空发展水平(-) | 0.0168 | |||
| 货运需求 | S26货运周转量 | 反映地区货运总需求(+) | 0.1098 | ||
| S27进出口贸易额 | 反映出境货运需求(+) | 0.1190 | |||
| 应 对 性 指 标 | 政府干预 | R21交通运输、仓储邮政业固定资产投资比重 | 反映交通基础设施建设水平(+) | 0.0172 | |
| 交通供给能力 | R22城市交通枢纽等级 | 反映国家对交通战略支持力度(+) | 0.0294 | ||
| R23公路网密度 | 反映城市内部交通的发展程度(+) | 0.0209 | |||
| R24城市连接度 | 反映城市对外交通联系便利程度(+) | 0.0363 | |||
| R25交通工具拥有数 | 反映城市交通工具供给情况(+) | 0.0114 | |||
| 运输服务能力 | R26交通运输、仓储邮政业从业人员数 | 反映交通运输业人力供给水平(+) | 0.0111 | ||
| R27互联网普及率 | 反映交通信息化水平(+) | 0.0065 |
注:表1中的28个指标分别从正负两方面反映其对系统敏感性和应对性的影响,敏感性指标性质为正(+),说明指标值越大,系统敏感性越大,导致脆弱性也越大,反之则反;应对性指标性质为正(+),说明指标值越大,系统应对能力越强,使得脆弱性越小,反之则反。 |
图1 我国内陆地区开放型经济—出境交通复合系统脆弱性时空格局演变Fig.1 |
表2 开放型经济—出境交通复合系统脆弱性泰尔指数及贡献率变化Tab.2 Theil index and contribution rate of vulnerability of the open economy-outbound traffic coupling system |
| 差异类型 | 2010年 | 2014年 | 2017年 | 2021年 |
|---|---|---|---|---|
| 总体差异 | 0.0067 | 0.0073 | 0.0086 | 0.0104 |
| 省际差异 | 0.0015(22.62%) | 0.0017(23.42%) | 0.0020(23.20%) | 0.0027(25.87%) |
| 省内差异 | 0.0052(77.23%) | 0.0056(76.44%) | 0.0066(76.80%) | 0.0077(74.13%) |
| 北京 | 0.0001(0.01%) | 0.0001(0.01%) | 0.0001(0.01%) | 0.0001(0.001%) |
| 山西 | 0.0074(5.03%) | 0.0052(3.23%) | 0.0063(3.36%) | 0.0062(2.75%) |
| 内蒙古 | 0.00340(3.13%) | 0.0053(3.73%) | 0.0051(3.06%) | 0.0067(3.35%) |
| 吉林 | 0.0046(2.81%) | 0.0040(2.31%) | 0.0046(2.26%) | 0.0038(1.61%) |
| 黑龙江 | 0.0082(7.64%) | 0.0068(5.86%) | 0.0082(6.03%) | 0.0069(4.33%) |
| 安徽 | 0.0038(4.09%) | 0.0038(3.87%) | 0.0049(4.15%) | 0.0051(3.67%) |
| 江西 | 0.0020(1.52%) | 0.0029(2.02%) | 0.0045(2.60%) | 0.0061(3.03%) |
| 河南 | 0.0035(3.77%) | 0.0025(2.50%) | 0.0029(2.41%) | 0.0049(3.51%) |
| 湖北 | 0.0016(1.72%) | 0.0029(2.71%) | 0.0017(1.32%) | 0.0031(2.06%) |
| 湖南 | 0.0061(5.56%) | 0.0087(7.22%) | 0.0095(6.62%) | 0.0102(5.80%) |
| 重庆 | 0.0001(0.01%) | 0.0001(0.01%) | 0.0001(0.00%) | 0.0001(0.00%) |
| 四川 | 0.0054(7.27%) | 0.0042(5.21%) | 0.0051(5.22%) | 0.0082(6.90%) |
| 贵州 | 0.0041(2.49%) | 0.0031(1.69%) | 0.0060(2.72%) | 0.0048(1.80%) |
| 云南 | 0.0052(5.96%) | 0.0075(8.04%) | 0.0110(10.06%) | 0.0093(7.02%) |
| 西藏 | 0.0109(4.72%) | 0.0149(6.68%) | 0.0154(6.04%) | 0.0068(2.19%) |
| 陕西 | 0.0053(3.27%) | 0.0046(2.55%) | 0.0042(1.97%) | 0.0098(3.74%) |
| 甘肃 | 0.0109(9.70%) | 0.0118(9.45%) | 0.0126(8.82%) | 0.0130(7.28%) |
| 青海 | 0.0063(3.08%) | 0.0072(3.35%) | 0.0078(3.13%) | 0.0096(3.10%) |
| 宁夏 | 0.0040(1.30%) | 0.0034(0.98%) | 0.0056(1.36%) | 0.0145(2.71%) |
| 新疆 | 0.0041(4.27%) | 0.0055(5.11%) | 0.0071(5.67%) | 0.0144(9.32%) |
注:表中小数为泰尔指数,括号内百分数为贡献率。 |
表3 开放型经济—出境交通复合系统脆弱性类型的马尔科夫转移概率矩阵Tab.3 Markov transition probability matrix of vulnerability types of the open economy-outbound traffic system |
| 年份 | 类型 | D | L | M | H | G |
|---|---|---|---|---|---|---|
| 2010—2021 | D | 0.973 | 0.027 | 0.000 | 0.000 | 0.000 |
| L | 0.139 | 0.837 | 0.023 | 0.000 | 0.000 | |
| M | 0.005 | 0.287 | 0.697 | 0.011 | 0.000 | |
| H | 0.000 | 0.030 | 0.265 | 0.695 | 0.010 | |
| G | 0.000 | 0.000 | 0.015 | 0.228 | 0.757 | |
| 2010—2014 | D | 0.952 | 0.048 | 0.000 | 0.000 | 0.000 |
| L | 0.069 | 0.876 | 0.048 | 0.000 | 0.007 | |
| M | 0.005 | 0.222 | 0.751 | 0.021 | 0.000 | |
| H | 0.000 | 0.043 | 0.226 | 0.715 | 0.015 | |
| G | 0.000 | 0.000 | 0.017 | 0.220 | 0.763 | |
| 2015—2017 | D | 0.982 | 0.018 | 0.000 | 0.000 | 0.000 |
| L | 0.110 | 0.877 | 0.013 | 0.000 | 0.000 | |
| M | 0.000 | 0.307 | 0.686 | 0.007 | 0.000 | |
| H | 0.000 | 0.000 | 0.290 | 0.710 | 0.000 | |
| G | 0.000 | 0.000 | 0.000 | 0.276 | 0.724 | |
| 2017—2021 | D | 0.997 | 0.003 | 0.000 | 0.000 | 0.000 |
| L | 0.203 | 0.782 | 0.016 | 0.000 | 0.000 | |
| M | 0.019 | 0.398 | 0.574 | 0.009 | 0.000 | |
| H | 0.000 | 0.021 | 0.438 | 0.542 | 0.000 | |
| G | 0.000 | 0.000 | 0.045 | 0.409 | 0.545 |
注:D-低脆弱性、L-较低脆弱性、M-中等脆弱性、H-较高脆弱性、G-高脆弱性。表4同。 |
表4 2010—2021年开放型经济—出境交通复合系统脆弱性类型的空间马尔科夫转移概率矩阵Tab.4 Spatial Markov transition probability matrix of vulnerability types of the open economy-outbound traffic coupling system in 2010-2021 |
| 邻接类型 | 类型 | D | L | M | H | G |
|---|---|---|---|---|---|---|
| D | D | 1.000 | 0.000 | 0.000 | 0.000 | 0.000 |
| L | 0.261 | 0.728 | 0.011 | 0.000 | 0.000 | |
| M | 0.000 | 0.407 | 0.593 | 0.000 | 0.000 | |
| H | 0.000 | 0.000 | 0.333 | 0.667 | 0.000 | |
| G | 0.000 | 0.000 | 0.031 | 0.318 | 0.651 | |
| L | D | 1.000 | 0.000 | 0.000 | 0.000 | 0.000 |
| L | 0.132 | 0.851 | 0.017 | 0.000 | 0.000 | |
| M | 0.011 | 0.309 | 0.669 | 0.011 | 0.000 | |
| H | 0.000 | 0.018 | 0.321 | 0.661 | 0.000 | |
| G | 0.000 | 0.000 | 0.000 | 0.308 | 0.692 | |
| M | D | 0.952 | 0.048 | 0.000 | 0.000 | 0.000 |
| L | 0.084 | 0.864 | 0.052 | 0.000 | 0.000 | |
| M | 0.000 | 0.247 | 0.742 | 0.011 | 0.000 | |
| H | 0.000 | 0.044 | 0.301 | 0.642 | 0.013 | |
| G | 0.000 | 0.000 | 0.026 | 0.364 | 0.610 | |
| H | D | 0.980 | 0.020 | 0.000 | 0.000 | 0.000 |
| L | 0.079 | 0.868 | 0.026 | 0.000 | 0.026 | |
| M | 0.000 | 0.275 | 0.706 | 0.020 | 0.000 | |
| H | 0.000 | 0.022 | 0.159 | 0.812 | 0.007 | |
| G | 0.000 | 0.000 | 0.000 | 0.189 | 0.811 | |
| G | D | 0.960 | 0.040 | 0.000 | 0.000 | 0.000 |
| L | 0.062 | 0.876 | 0.062 | 0.000 | 0.000 | |
| M | 0.000 | 0.167 | 0.833 | 0.000 | 0.000 | |
| H | 0.000 | 0.000 | 0.163 | 0.784 | 0.053 | |
| G | 0.000 | 0.000 | 0.026 | 0.132 | 0.842 |
表5 开放型经济—出境交通复合系统脆弱性结构层障碍度(%)Tab.5 Obstacle degree of vulnerability structure layer of the open economy-outbound traffic composite system(%) |
| 结构层 | 2010年 | 2014年 | 2017年 | 2021年 |
|---|---|---|---|---|
| 国际开放依赖度 | 27.97 | 27.70 | 27.79 | 27.50 |
| 货运需求 | 22.97 | 22.86 | 22.79 | 22.61 |
| 关键路径通行时间 | 9.13 | 10.32 | 11.15 | 12.28 |
| 宏观经济基础 | 10.30 | 10.28 | 10.18 | 10.04 |
| 交通供给能力 | 10.50 | 10.27 | 10.04 | 9.62 |
| 政府交通调控 | 7.36 | 7.36 | 7.28 | 7.20 |
| 政府经济调控 | 7.62 | 7.23 | 7.10 | 6.94 |
| 运输服务能力 | 2.69 | 2.64 | 2.58 | 2.40 |
| 运输通道质量 | 0.57 | 0.83 | 1.07 | 1.68 |
| 国内开放依赖度 | 0.35 | 0.37 | 0.37 | 0.44 |
表6 开放型经济—出境交通复合系统脆弱性指标层前六位显著障碍因子及障碍度(%)Tab.6 Top six significant obstacle factors and obstacle degrees in the vulnerability index layer of the open economy-outbound traffic coupling system (%) |
| 年份 | 第一障碍因子(S11) | 第二障碍因子(S26) | 第三障碍因子(S27) | 第四障碍因子(S12) | 第五障碍因子(S21) | 第六障碍因子(R24) |
|---|---|---|---|---|---|---|
| 2010 | 12.97 | 12.00 | 10.97 | 8.35 | 5.06 | 5.54 |
| 2014 | 12.95 | 11.89 | 10.96 | 8.02 | 5.55 | 5.18 |
| 2017 | 13.12 | 11.81 | 10.98 | 7.98 | 5.85 | 4.87 |
| 2021 | 13.02 | 11.70 | 10.90 | 7.79 | 6.25 | 4.36 |
注:S11为外贸依存度、S26为货运周转量、S27为进出口贸易总额、S12为外资依存度、S21为内陆—口岸最短旅行时间、R24为城市连接度。 |
| [1] |
|
| [2] |
|
| [3] |
|
| [4] |
|
| [5] |
|
| [6] |
|
| [7] |
杨懿, 田里. 经济脆弱性内涵演变与评价范式[J]. 学术探索, 2015(6):68-72.
|
| [8] |
袁海红, 牛方曲, 高晓路. 城市经济脆弱性模拟评估系统的构建及其应用[J]. 地理学报, 2015, 70(2):271-282.
|
| [9] |
武剑, 杨爱婷. 基于SPA的广东省区域经济脆弱性及障碍因素研究[J]. 经济地理, 2012, 32(9):32-38.
|
| [10] |
李鹤, 张平宇. 矿业城市经济脆弱性演变过程及应对时机选择研究——以东北三省为例[J]. 经济地理, 2014, 34(1):82-88.
|
| [11] |
杨友宝, 王荣成. 边境民族地区旅游经济系统脆弱性评价及其优化路径——以延边朝鲜族自治州为例[J]. 地域研究与开发, 2015, 34(6):104-109.
|
| [12] |
|
| [13] |
|
| [14] |
佟家栋, 李胜旗. 贸易政策不确定性对出口企业产品创新的影响研究[J]. 国际贸易问题, 2015(6):25-32.
|
| [15] |
蒋冠宏. 不确定性、企业出口与直接投资的选择:来自中国企业的理论和证据[J]. 世界经济研究, 2019(4):29-46.
|
| [16] |
钱学锋, 龚联梅. 贸易政策不确定性、区域贸易协定与中国制造业出口[J]. 中国工业经济, 2017(10):81-98.
|
| [17] |
杜德斌, 段德忠, 杨文龙. 中国经济权力空间格局演化研究——基于国家间相互依存的敏感性与脆弱性分析[J]. 地理学报, 2016, 71(10):1741-1751.
|
| [18] |
|
| [19] |
|
| [20] |
|
| [21] |
|
| [22] |
史培军, 王静爱, 陈婧. 当代地理学之人地相互作用研究的趋向——全球变化人类行为计划(IHDP)第六届开放会议透视[J]. 地理学报, 2006(2):115-126.
|
| [23] |
王超, 李一帆, 顾永恒. 中国内陆港建设对亚欧通道运输服务贸易脆弱性影响研究[J]. 长安大学学报:社会科学版, 2022, 24(2):69-77.
|
| [24] |
王玲, 刘维林, 陈华倩. 交通强国战略下我国运输服务贸易的网络地位评估与提升策略——基于全球价值链视角[J]. 软科学, 2021, 35(3):15-21.
|
| [25] |
陈秀莲, 陈兰舟, 于吉梅. “一带一路”倡议下中国-东盟贸易和投资依赖敏感性与脆弱性研究[J]. 亚太经济, 2020(2):91-99.
|
| [26] |
许娇, 陈坤铭, 杨书菲. “一带一路”交通基础设施建设的国际经贸效应[J]. 亚太经济, 2016(3):3-11.
|
| [27] |
全毅. 中国高水平开放型经济新体制框架与构建路径[J]. 世界经济研究, 2006(10):13-24,135.
|
| [28] |
郭爱君, 朱瑜珂, 钟方雷. “一带一路”倡议对我国沿线地区开放型经济发展水平的影响效应评估——基于“准自然实验”分析[J]. 经济问题探索, 2019(9):59-71.
|
| [29] |
张晶. 中国开放型经济发展水平测度及空间格局分析[J]. 统计与决策, 2021, 37(13):100-104.
|
| [30] |
王少剑, 高爽, 黄永源. 基于超效率SBM模型的中国城市碳排放绩效时空演变格局及预测[J]. 地理学报, 2020, 75(6):1316-1330.
|
| [31] |
陈明华, 张晓萌, 刘玉鑫, 等. 绿色TFP增长的动态演进及趋势预测——基于中国五大城市群的实证研究[J]. 南开经济研究, 2020(1):20-44.
|
| [32] |
高升, 孙会荟, 刘伟. 基于熵权TOPSIS模型的海洋经济系统脆弱性评价与障碍度分析[J]. 生态经济, 2021, 37(10):77-83.
|
| [33] |
苏飞, 张平宇. 基于集对分析的大庆市经济系统脆弱性评价[J]. 地理学报, 2019, 65(4):454-464.
|
/
| 〈 |
|
〉 |