×
模态框(Modal)标题
在这里添加一些文本
Close
Close
Submit
Cancel
Confirm
×
模态框(Modal)标题
×
Journal
Article
Figure
Search
EN
中文
Home
About Journal
About Journal
Indexed in
Awards
Editorial Board
Guide for Authors
Browse
Current Issue
Online First
Archive
Highlights
Topic
Archive by Subject
Most Viewed
Most Download
Most Cited
E-mail Alert
RSS
Subscribe
Advertisement
Contact us
EN
中文
Figure/Table detail
Spatiotemporal Changes of Ecosystem Service Value and Its Driving Factors in the Middle Reaches of the Yangtze River Urban Agglomeration
LIU Zhifei, LUO Xinyi, LIU Anni, LI Han
Economic geograph
, 2025, 45(
11
): 213-222. DOI:
10.15957/j.cnki.jjdl.2025.11.021
研究时期
ESV
动态度(%)
耕地
林地
草地
水域
建设用地
未利用地
2010—2015
-0.30
-0.12
0.37
0.13
0
-0.96
2015—2020
-0.53
0.07
-0.31
-0.03
0
0.72
2020—2023
-0.18
-0.06
-0.07
-0.34
0
5.67
2010—2023
-0.36
-0.03
0.01
-0.04
0
1.18
Tab.3
Dynamic degree of
ESV
of different land types in the middle reaches of the Yangtze River Urban Agglomeration
Other figure/table from this article
Fig.1
Location of the study area
Tab.1
Ecosystem service value coefficient table of the middle reaches of the Yangtze River Urban Agglomeration(yuan/hm
2
)
Tab.2
Changes in
ESV
of various land types in the middle reaches of the Yangtze River Urban Agglomeration (2010-2023)
Tab.4
Changes in the value of individual services of the land ecosystem in the middle reaches of the Yangtze River Urban Agglomeration in 2010-2023
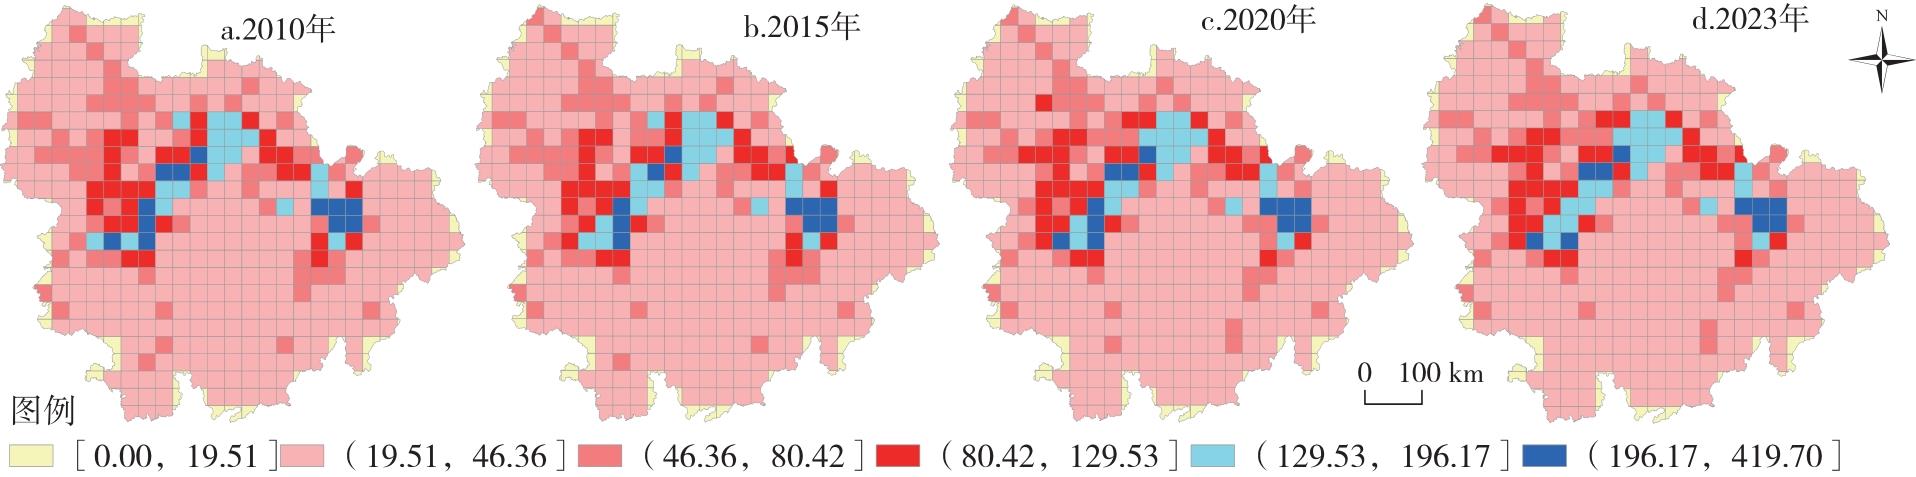
Fig.2
Spatial distribution of
ESV
in the middle reaches of the Yangtze River Urban Agglomeration
Tab.5
Annual Moran's
I
statistical values of
ESV
in the middle reaches of the Yangtze River Urban Agglomeration
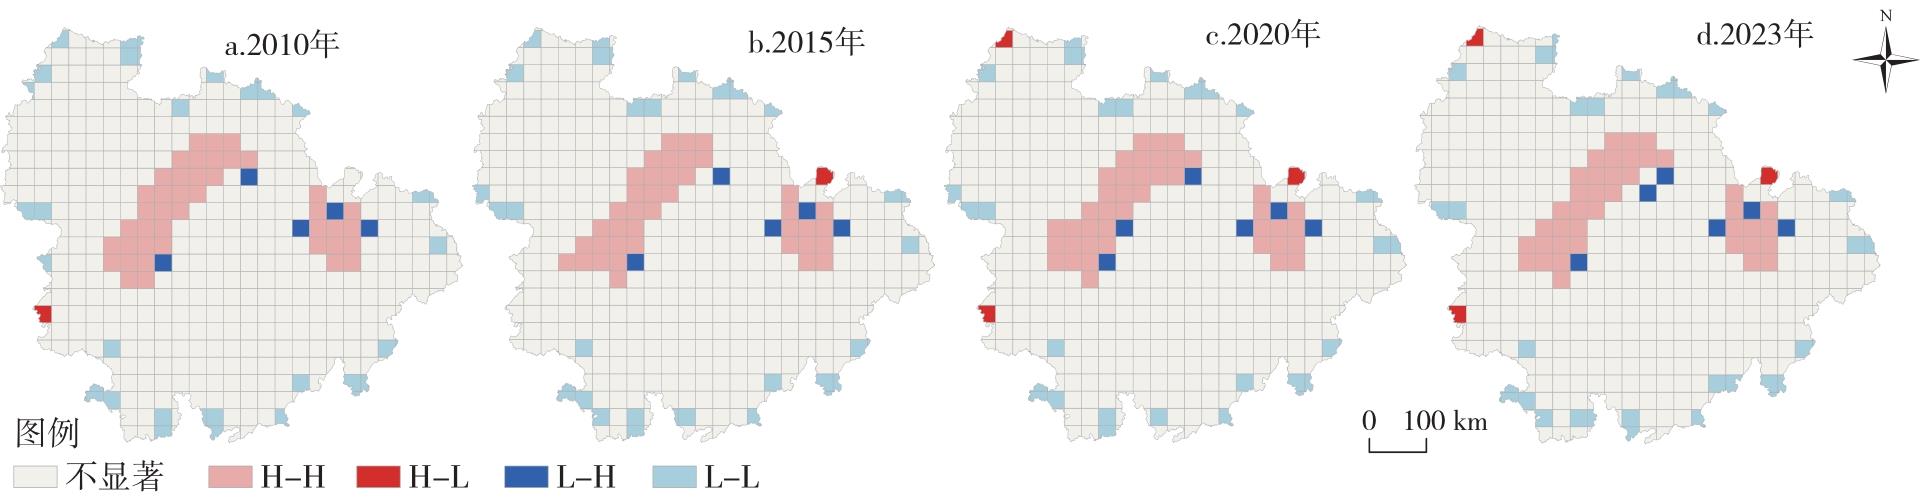
Fig.3
LISA cluster diagram of
ESV
in the middle reaches of the Yangtze River Urban Agglomeration
Tab.6
Factor detection of spatial differentiation in
ESV
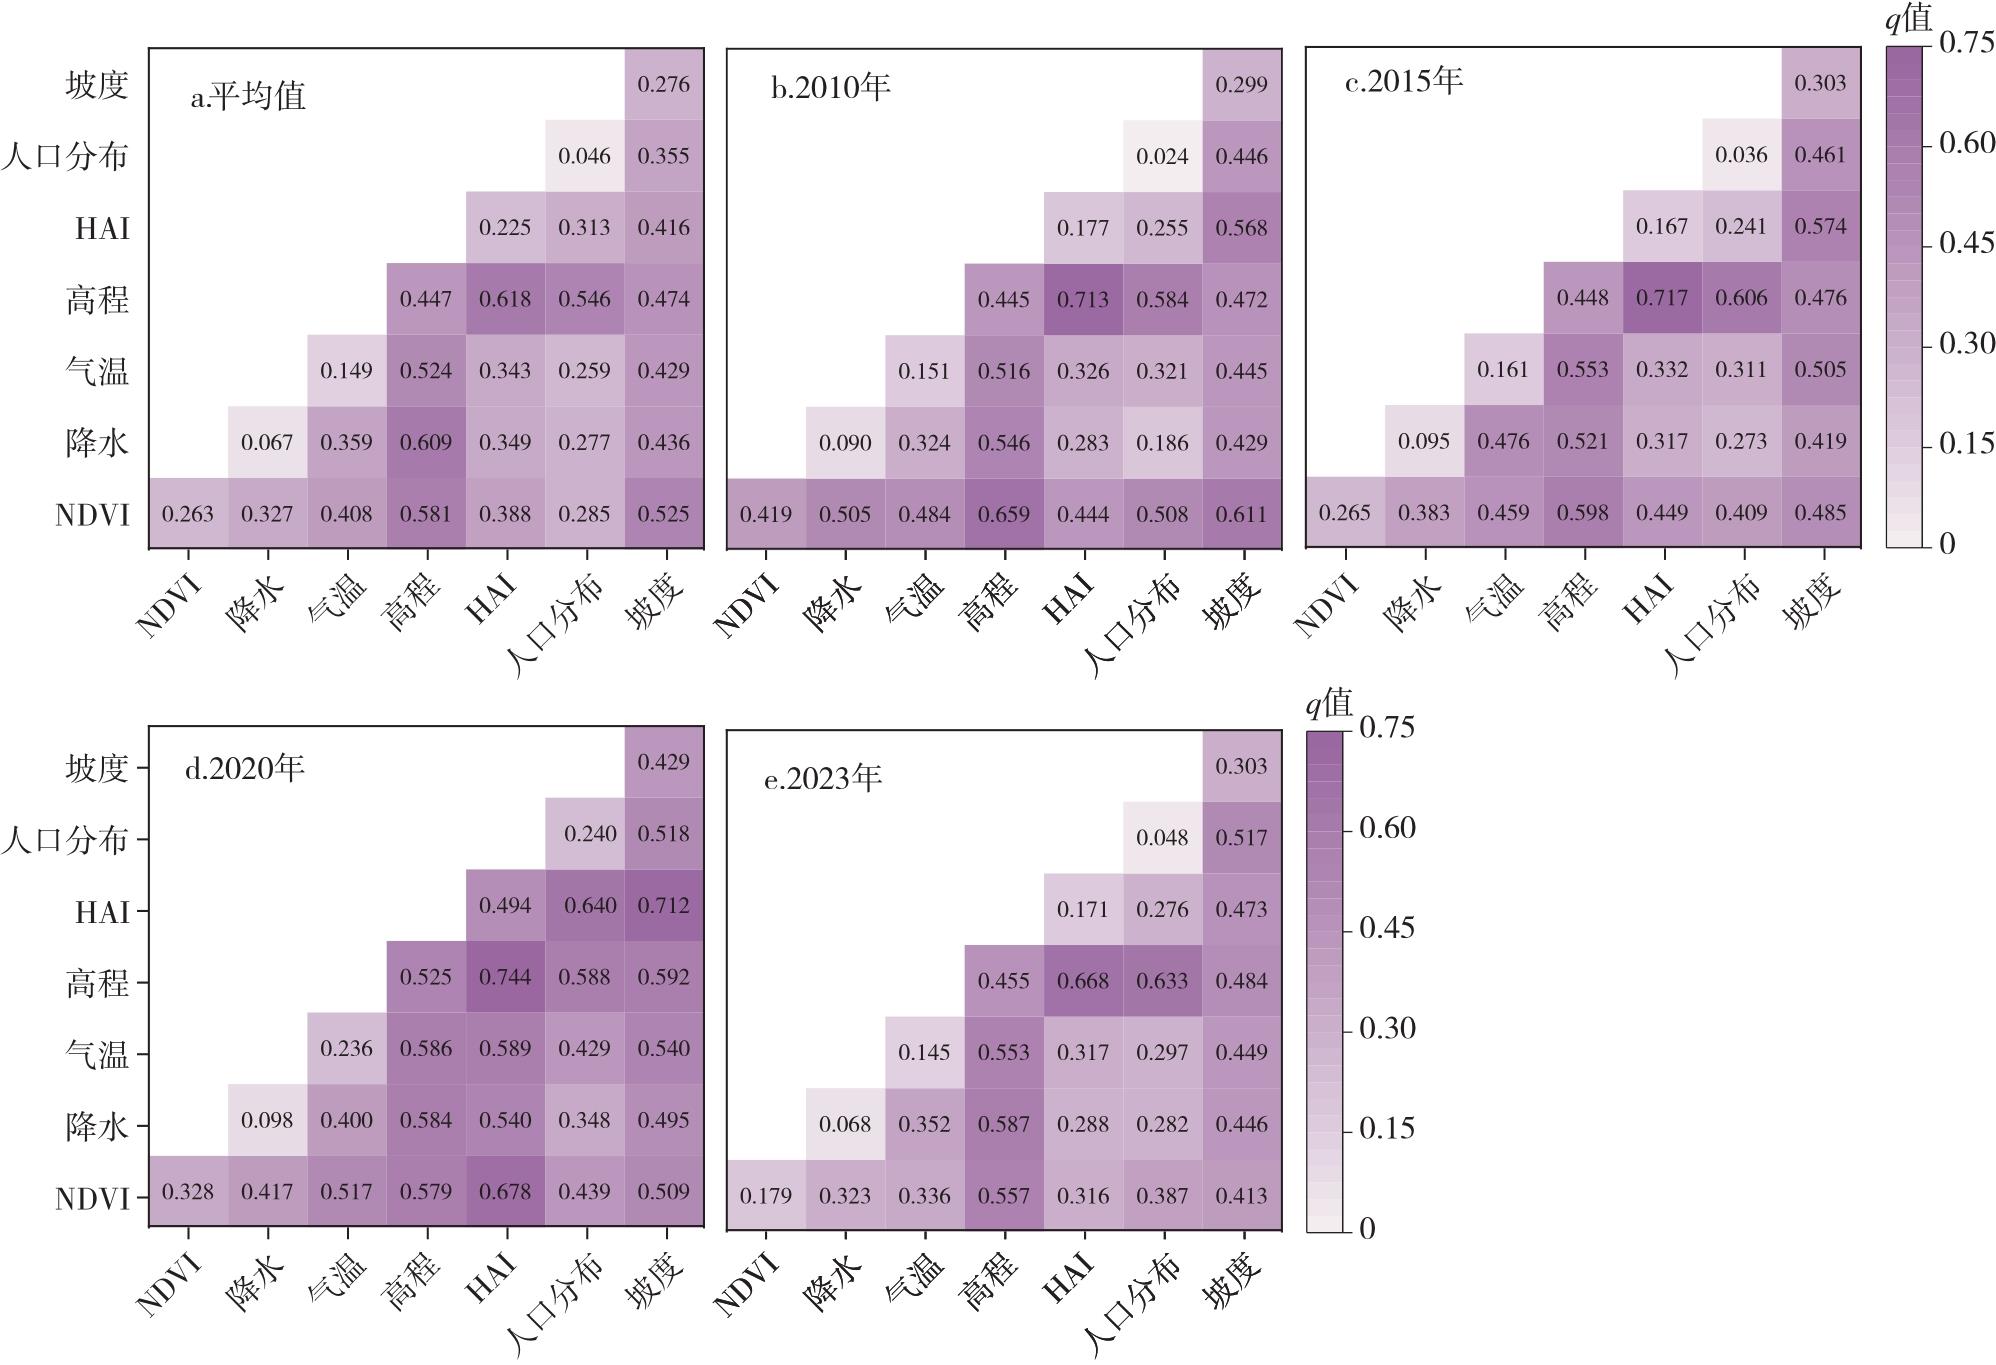
Fig.4
Factor interaction detection of
ESV
spatial differentiation in the middle reaches of the Yangtze River Urban Agglomeration
Fig.5
Mechanism diagram of driving factors