×
模态框(Modal)标题
在这里添加一些文本
Close
Close
Submit
Cancel
Confirm
×
模态框(Modal)标题
×
Journal
Article
Figure
Search
EN
中文
Home
About Journal
About Journal
Indexed in
Awards
Editorial Board
Guide for Authors
Browse
Current Issue
Online First
Archive
Highlights
Topic
Archive by Subject
Most Viewed
Most Download
Most Cited
E-mail Alert
RSS
Subscribe
Advertisement
Contact us
EN
中文
Figure/Table detail
Measurement and Spatiotemporal Differences of Tourism Industry Activity in Hainan Island
LI Sihan, ZHENG Rumin, MEI Lin
Economic geograph
, 2024, 44(
10
): 224-231. DOI:
10.15957/j.cnki.jjdl.2024.10.023
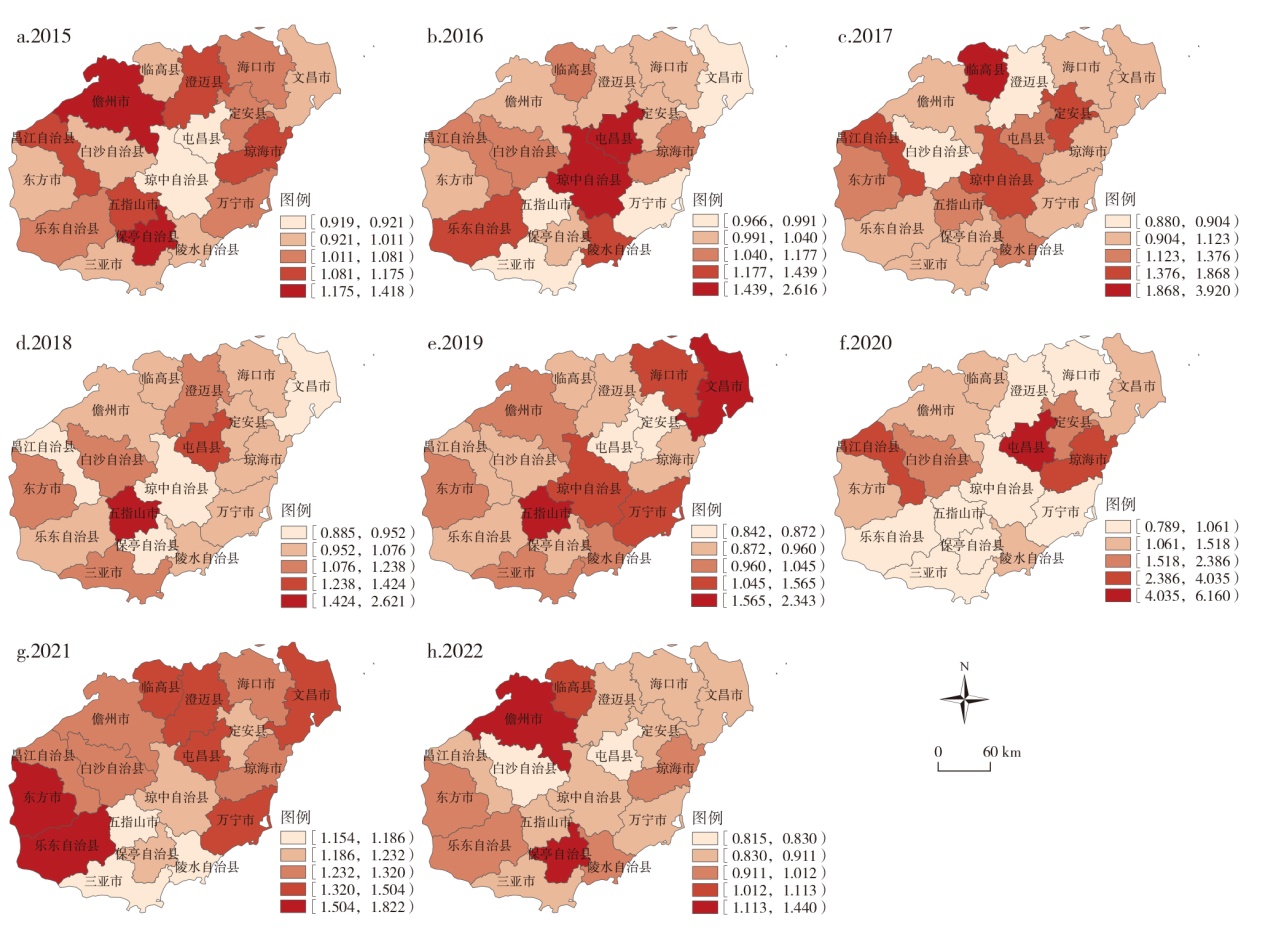
Fig.3
Spatial characteristics of tourism industry activity of Hainan Island from 2015 to 2022
Other figure/table from this article
Tab.1
Index system and explanation of regional tourism industry activity
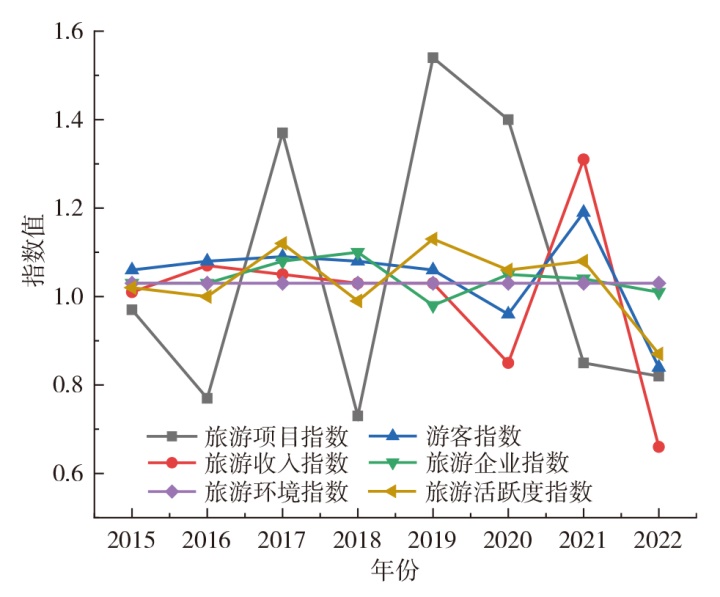
Fig.1
Trend of tourism industry activity index and sub-indices in Hainan Island from 2015 to 2022
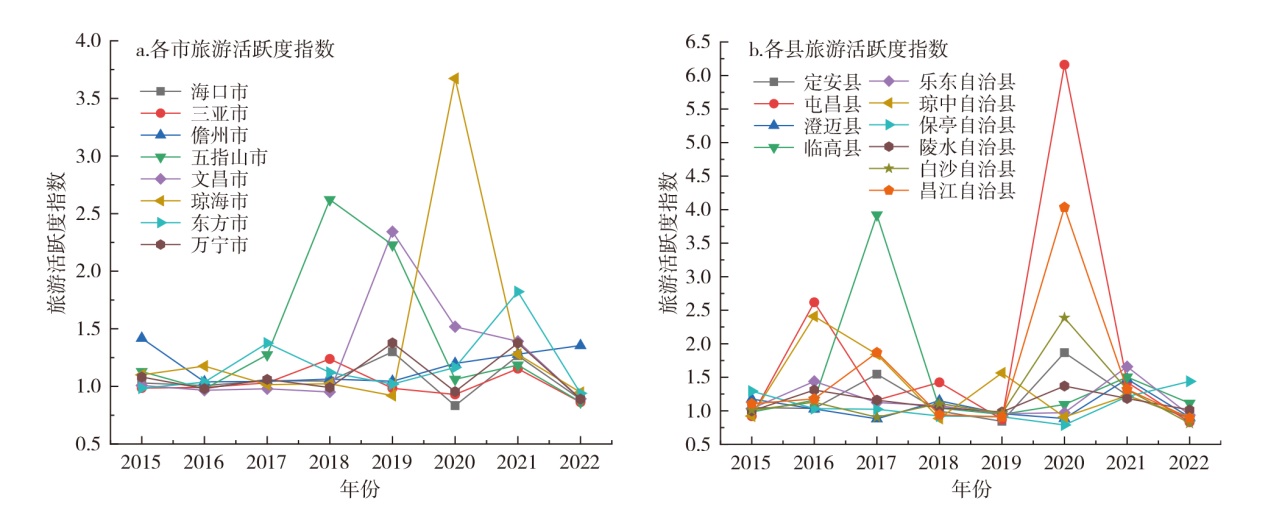
Fig.2
Trend of tourism industry activity index in 18 cities and counties of Hainan Island from 2015 to 2022
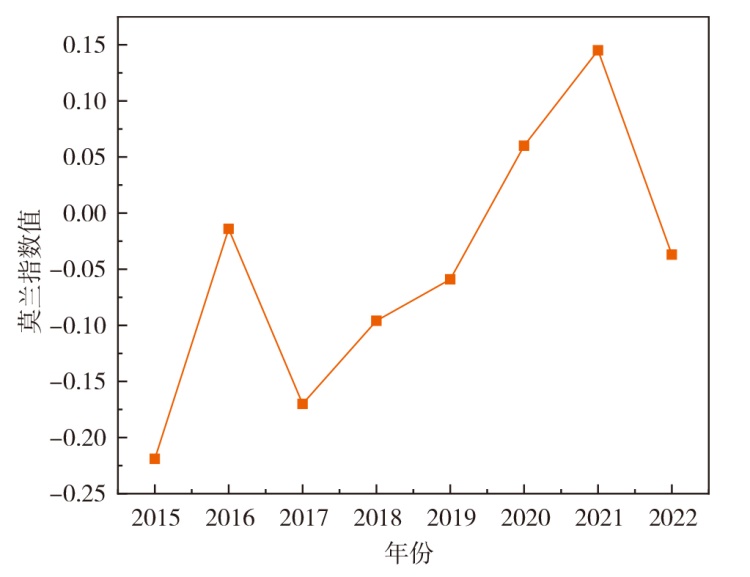
Fig.4
Trends of Moran's index of tourism industry activity in Hainan Island from 2015 to 2022
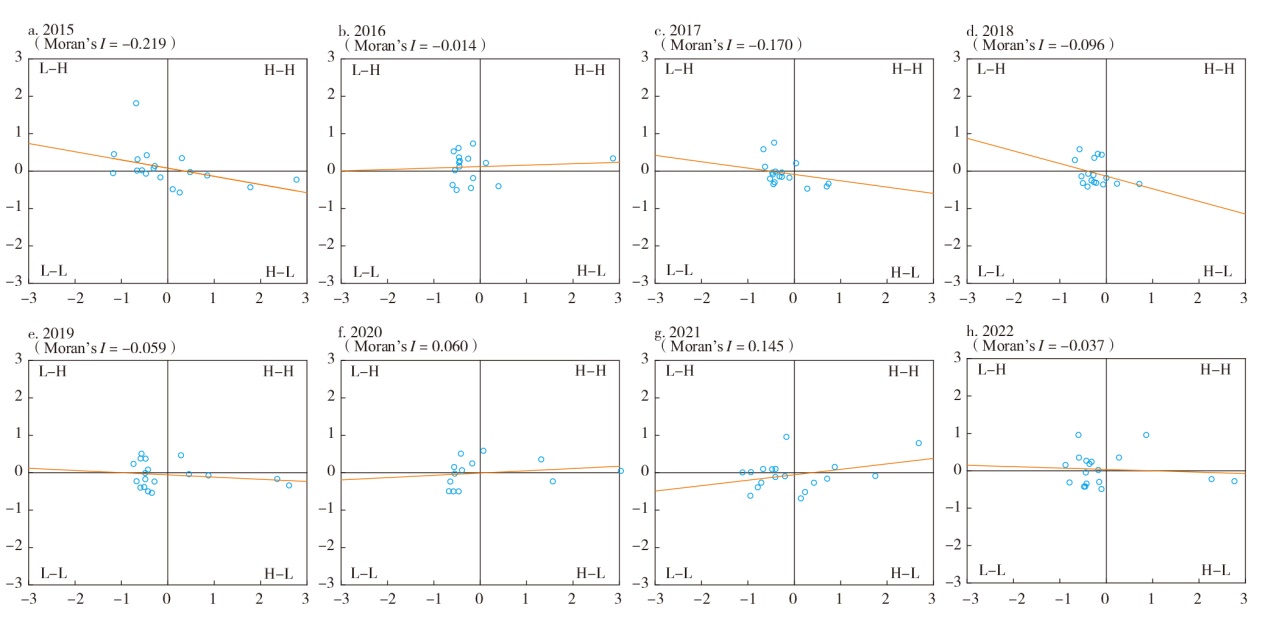
Fig.5
Moran scatter plot of tourism industry activity in Hainan Island from 2015 to 2022
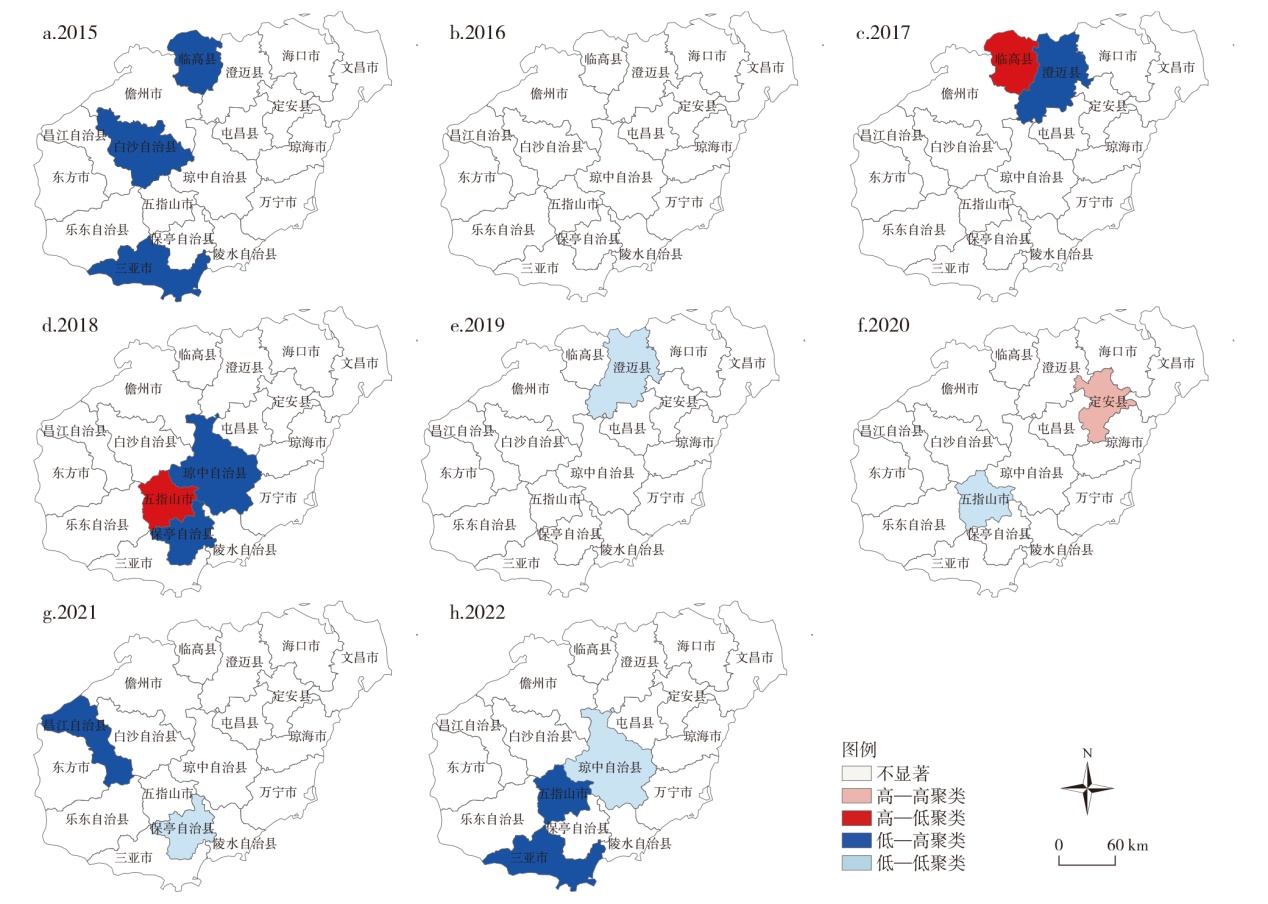
Fig.6
High-low agglomeration of tourism industry activity in Hainan Island from 2015 to 2022