×
模态框(Modal)标题
在这里添加一些文本
Close
Close
Submit
Cancel
Confirm
×
模态框(Modal)标题
×
Journal
Article
Figure
Search
EN
中文
Home
About Journal
About Journal
Indexed in
Awards
Editorial Board
Guide for Authors
Browse
Current Issue
Online First
Archive
Highlights
Topic
Archive by Subject
Most Viewed
Most Download
Most Cited
E-mail Alert
RSS
Subscribe
Advertisement
Contact us
EN
中文
Figure/Table detail
Spatial Structure of Urban Subway and Layout Optimization of Station Parking Lots:A Case Study of Nanjing
YIN Yue, LU Yuqi
Economic geograph
, 2020, 40(
7
): 73-80. DOI:
10.15957/j.cnki.jjdl.2020.07.009
排名
城市
运营里程(km)
站点数(个)
线路(条)
建设时间(年)
1
上海
705
415
17
1993
2
北京
626
389
21
1971
3
广州
454
240
14
1997
4
南京
378
174
10
2005
5
重庆
316
181
10
2004
6
武汉
301
206
9
2004
7
深圳
286
199
8
2004
8
香港
228
93
11
1979
9
成都
226
156
6
2010
10
天津
220
153
6
1984
Tab.1
2018 top 10 cities in subway mileage in China
Other figure/table from this article
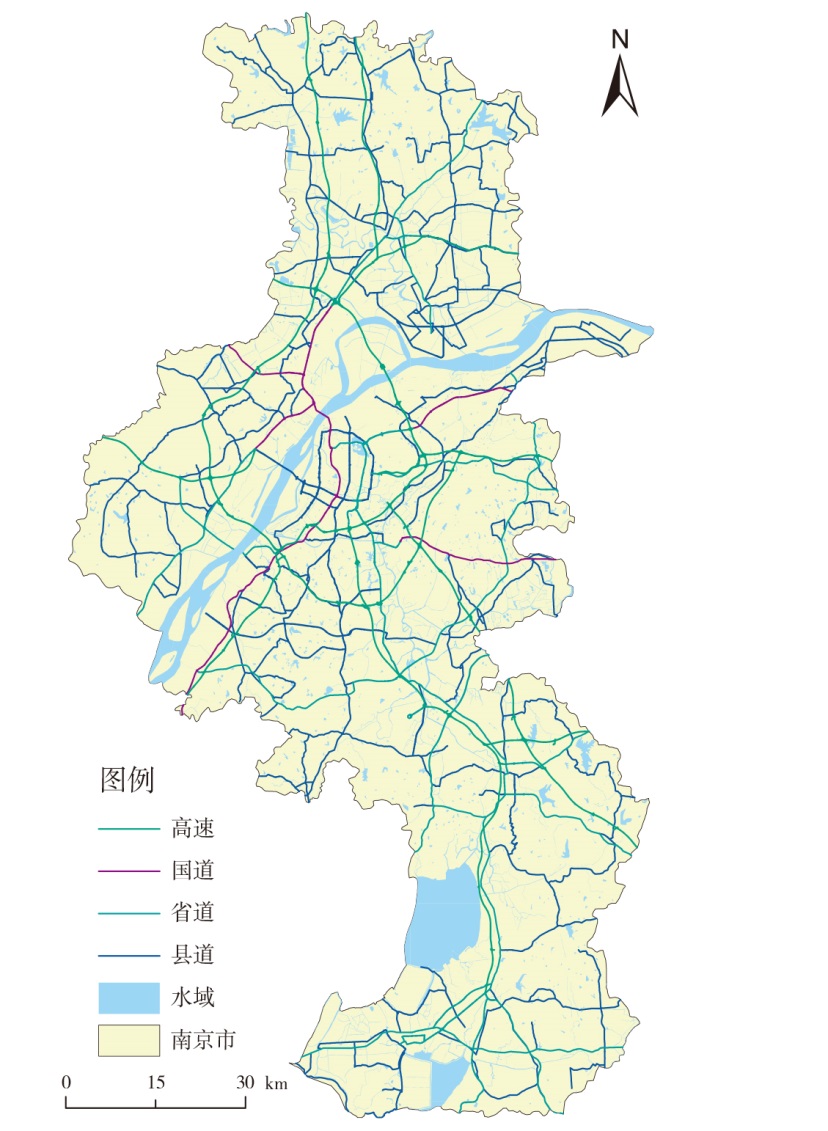
Fig.1
The map of the main traffic roads of Nanjing
Tab.2
Statistics of mass transit railway corporation's public parking lots
Tab.3
Speed assignments on roads and railways(km/h)
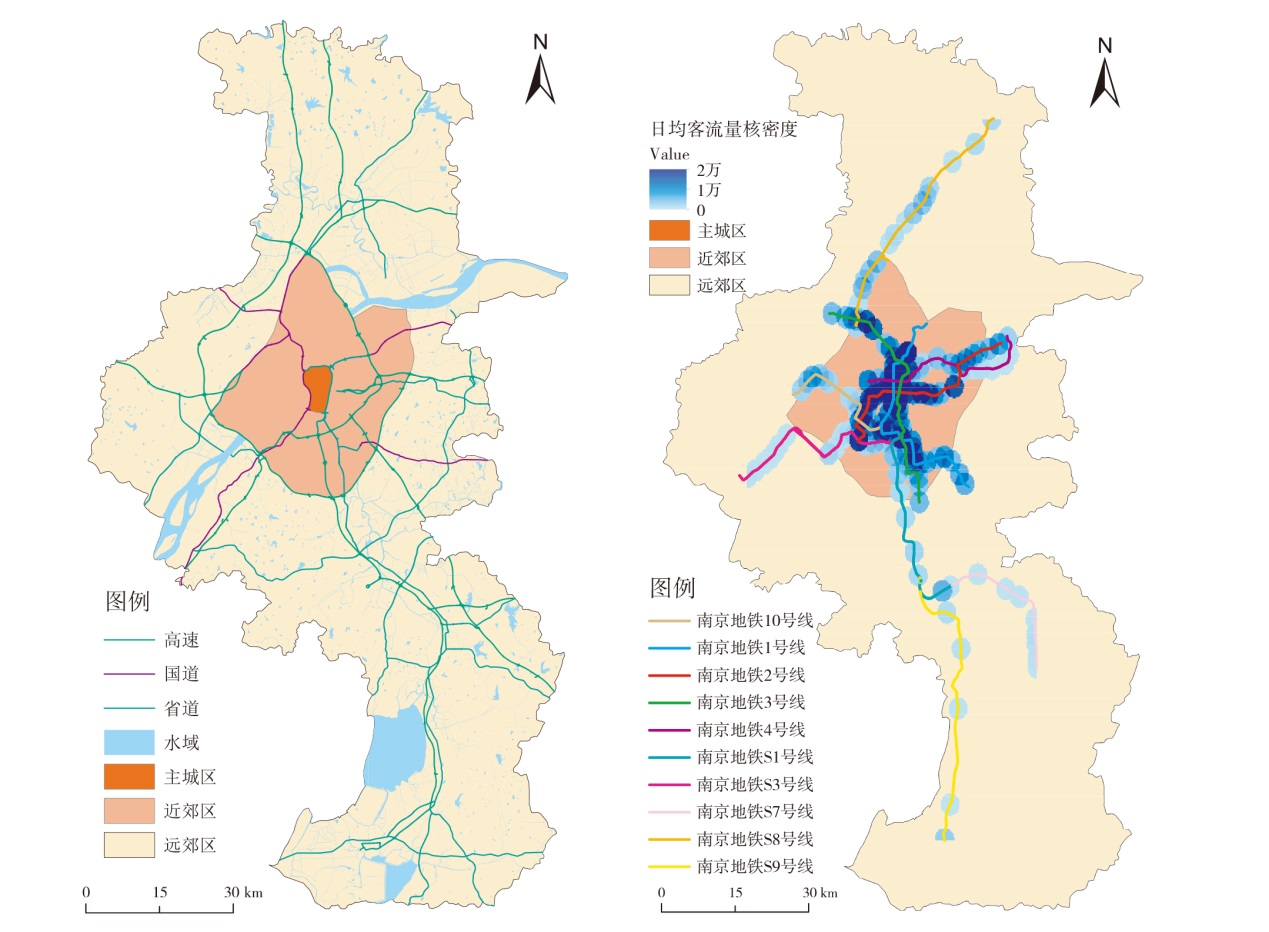
Fig.2
The ring structure of Nanjing
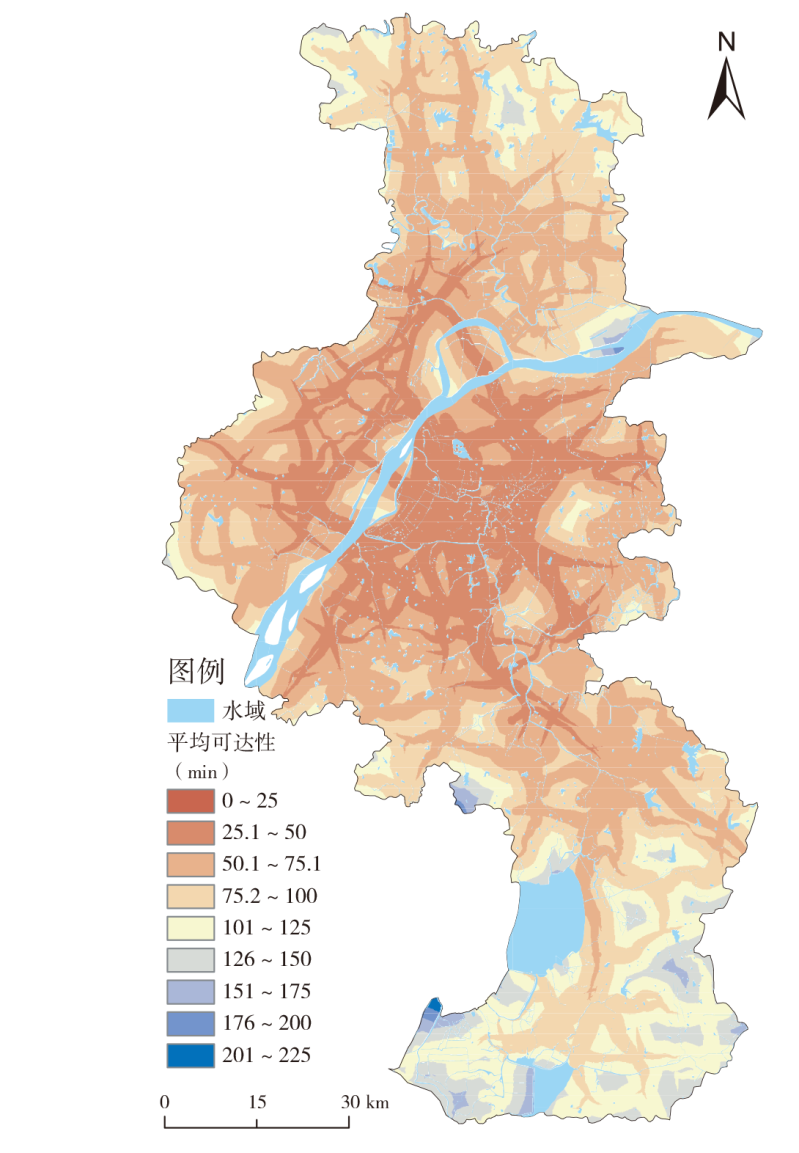
Fig.3
Accessibility of subway stations(Average time)
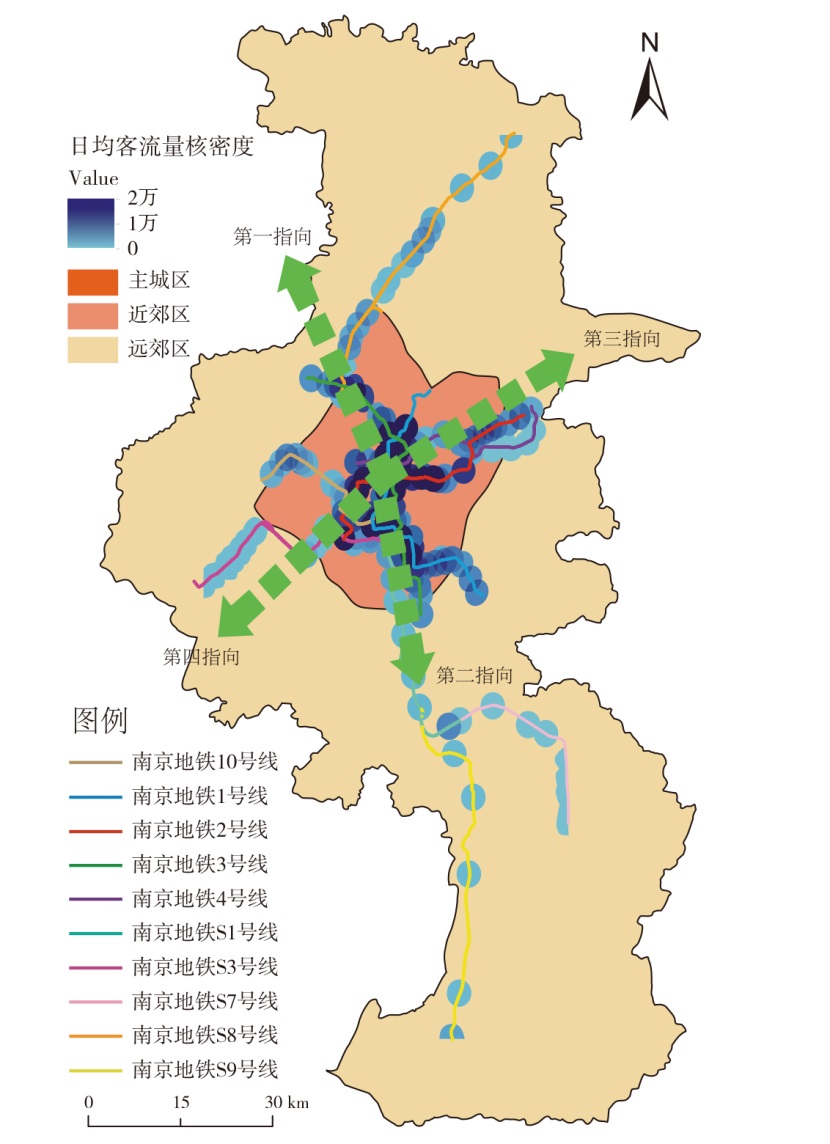
Fig.4
Cross structure of subway
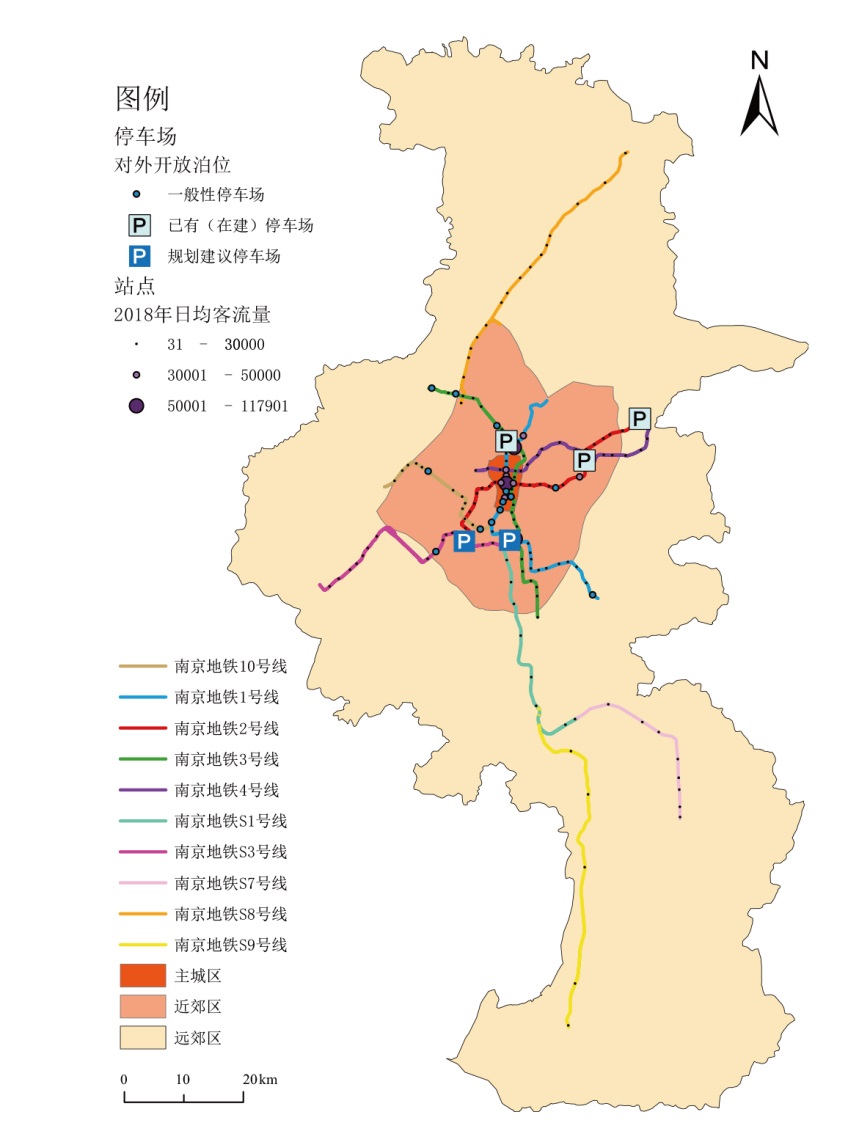
Fig.5
Suggestions on Nanjing metro parking lot