
Spatial and Industrial Effects of the Digital Inclusive Finance on the County-Level Economic Development in Henan Province
Received date: 2025-05-29
Revised date: 2025-11-27
Online published: 2026-04-29
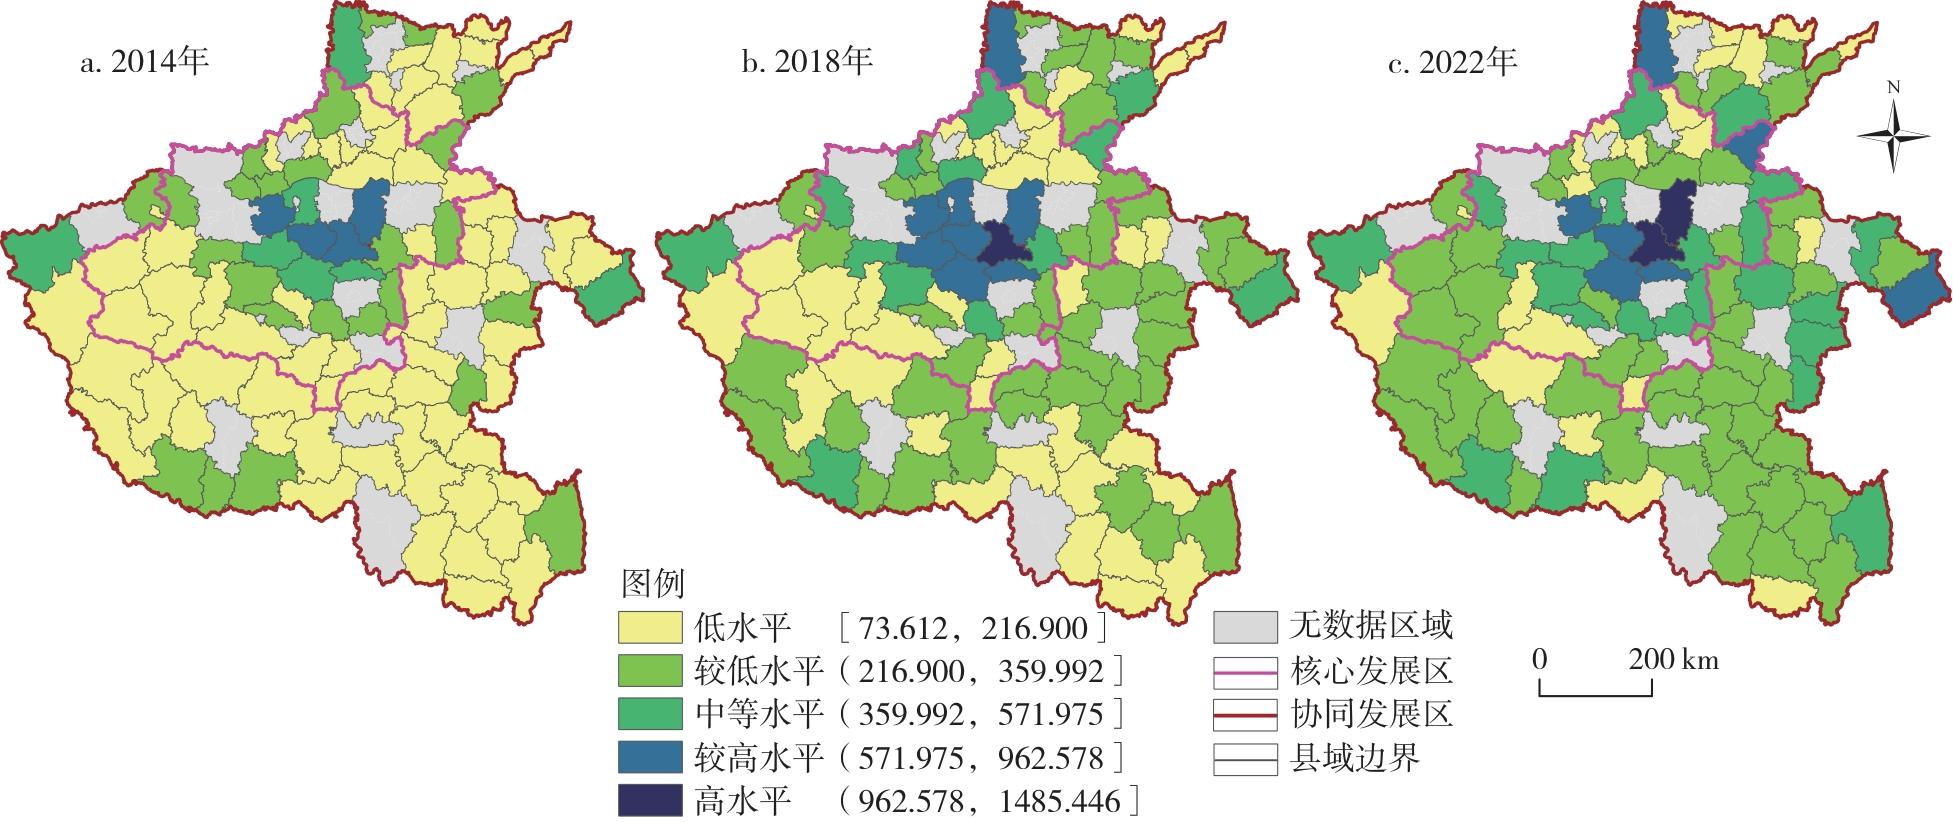
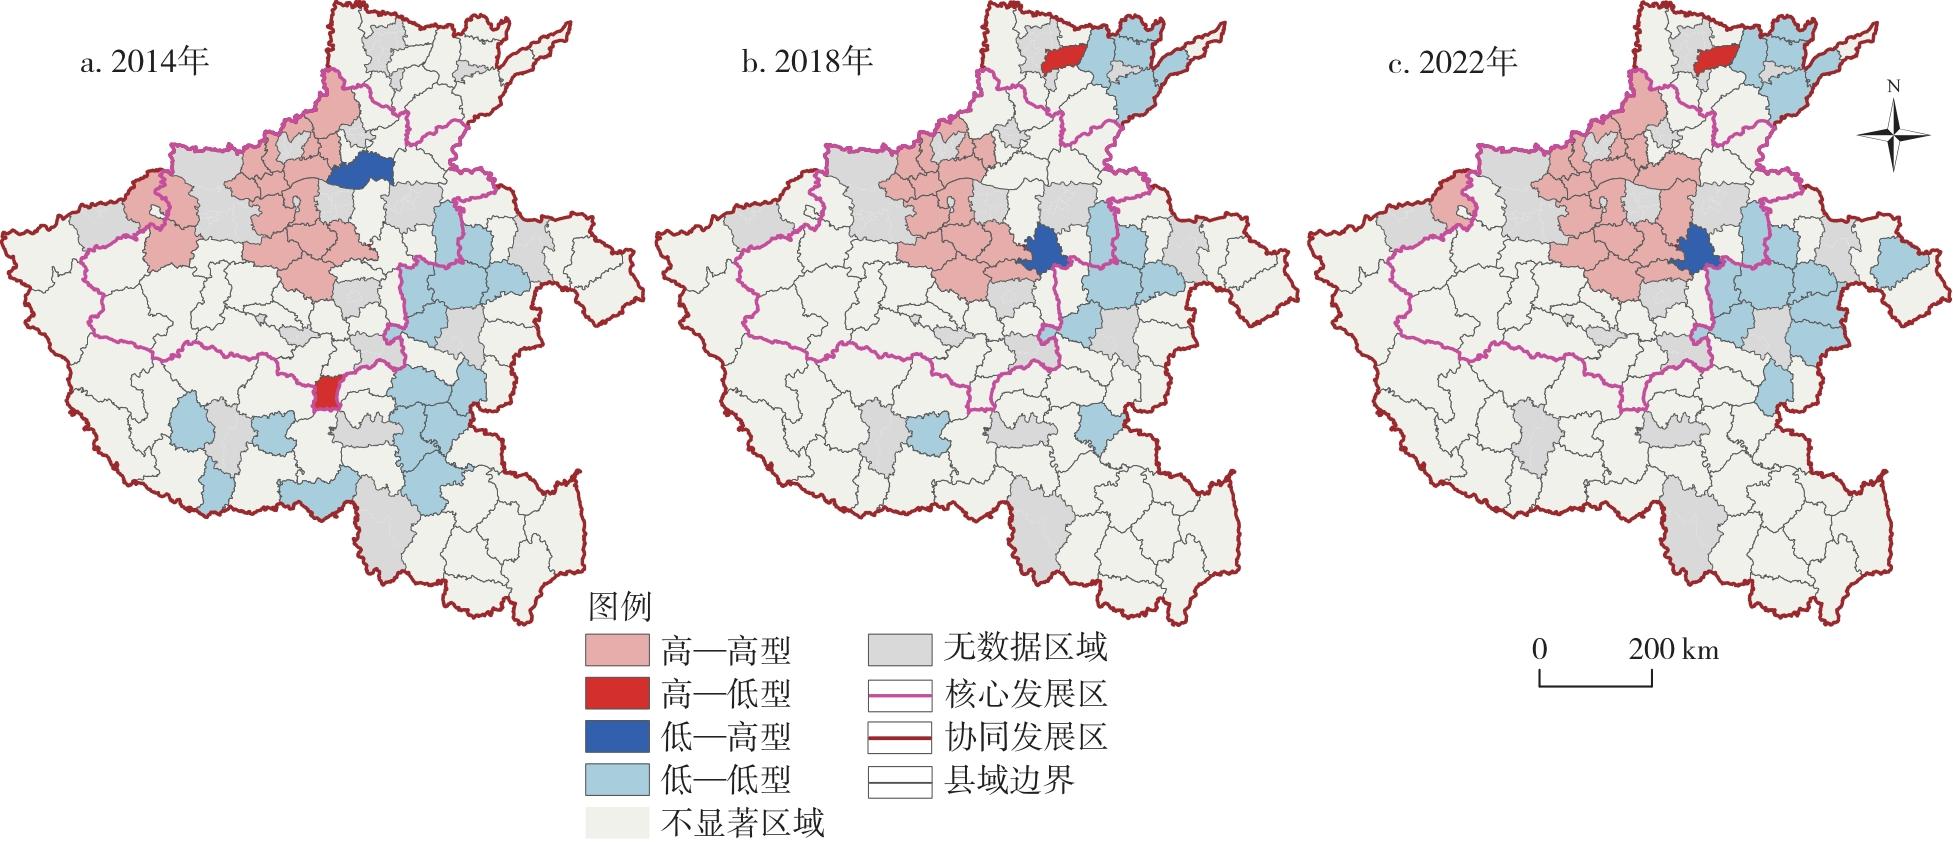
This study systematically examines the spatial mechanism of the digital inclusive finance on the county-level economic development in Henan Province. Using the panel data for 102 counties in Henan Province from 2014 to 2022, this paper uses the spatial Durbin model to explore the spatial and industrial effects of the digital inclusive finance on the county-level economic development. The findings are as follows: 1) Both the county-level economic development and the digital inclusive finance in Henan Province exhibit significant spatial agglomeration patterns, characterized by high clustering in core development zones and relatively low clustering in coordinated development zones. 2) The digital inclusive finance significantly boosts the economic development in both local counties and neighboring counties, demonstrating significant direct effects and indirect spatial spillover effects, with stronger effects in coordinated development zones than that in core development zones. 3) The indirect effects of the digital inclusive finance on the county-level economic development display a clear gradient characteristic, which is overall region (significant), coordinated development zones (significant), core development zones (insignificant) in descending order, indicating that the core development zones exert significant spatial spillover effects on the coordinated development zones. 4) The impacts of digital inclusive finance on the three industrial sectors show a descending pattern, which is secondary industry, tertiary industry, and primary industry respectively.

XU Jiawei , DU Jin , WANG Wenqi , WANG Qiwen . Spatial and Industrial Effects of the Digital Inclusive Finance on the County-Level Economic Development in Henan Province[J]. Economic geography, 2026 , 46(3) : 87 -96 . DOI: 10.15957/j.cnki.jjdl.2026.03.009
表1 变量选取及说明Tab.1 Selection and explanation of various variables |
| 变量 | 符号 | 变量说明 | |
|---|---|---|---|
| 被解释变量 | 经济发展水平 | GDP | GDP(亿元) |
| 第一产业经济发展水平 | FIP | 第一产业产值(亿元) | |
| 第二产业经济发展水平 | SIP | 第二产业产值(亿元) | |
| 第三产业经济发展水平 | TIP | 第三产业产值(亿元) | |
| 核心解释变量 | 数字普惠金融指数 | DFI | 北京大学数字金融研究中心测度的数字普惠金融指数 |
| 控制变量 | 人口规模 | PR | 常住人口(万人) |
| 城镇化水平 | UL | 城镇化率(%) | |
| 供给能力 | GN | 人均粮食产量(t/万人) | |
| 财政支持 | FD | 财政收入/财政支出(%) | |
| 公共服务 | PS | 每万人医疗机构医生数(个/万人) | |
| 金融条件 | FT | 金融机构存款余额/金融机构贷款余额(%) | |
| 消费水平 | CL | 每万人社会消费品零售总额(元/万人) |
表2 2014—2022年河南省县域经济发展描述性统计Tab.2 Descriptive statistics of the county-level economic development in Henan Province from 2014 to 2022 |
| 2014 | 2015 | 2016 | 2017 | 2018 | 2019 | 2020 | 2021 | 2022 | |
|---|---|---|---|---|---|---|---|---|---|
| 平均值 | 225.174 | 238.608 | 259.626 | 282.925 | 302.117 | 320.861 | 323.135 | 344.664 | 360.084 |
| 标准差 | 131.088 | 141.730 | 155.382 | 170.653 | 182.797 | 193.767 | 199.889 | 214.938 | 221.844 |
| 变异系数 | 0.582 | 0.594 | 0.598 | 0.603 | 0.605 | 0.604 | 0.619 | 0.624 | 0.616 |
| 峰度 | 3.806 | 5.425 | 5.842 | 6.120 | 7.186 | 9.471 | 10.491 | 11.174 | 10.855 |
| 偏度 | 1.937 | 2.164 | 2.213 | 2.245 | 2.385 | 2.672 | 2.845 | 2.941 | 2.913 |
表4 空间杜宾模型溢出效应分解结果Tab.4 Decomposition results of the spillover effect of the spatial Durbin model |
| 解释变量 | 邻接矩阵 | ||
|---|---|---|---|
| 直接效应 | 间接效应 | 总效应 | |
| DIF | 0.362*** | 0.361*** | 0.723*** |
| PR | 0.387*** | 0.124 | 0.511*** |
| UL | 0.194*** | 0.065 | 0.259** |
| GN | 0.179*** | 0.015 | 0.194** |
| FD | 0.046 | -0.124* | -0.078 |
| PS | 0.056** | 0.212*** | 0.268*** |
| FT | -0.007 | -0.038 | -0.045 |
| CL | 0.179*** | -0.023 | 0.157*** |
表5 核心发展区和协同发展区异质性回归结果Tab.5 Heterogeneity regression results for the core development areas and the coordinated development areas |
| 解释变量 | 邻接矩阵 | ||
|---|---|---|---|
| 河南省全域 | 核心发展区 | 协同发展区 | |
| DIF | 0.352***(6.266) | 0.268***(4.488) | 0.543***(4.494) |
| W·DIF | 0.290***(2.768) | 0.042(0.349) | 0.184*(1.790) |
| 直接效应 | 0.362***(6.290) | 0.270***(4.317) | 0.547***(4.390) |
| 间接效应 | 0.361***(3.276) | 0.000(0.004) | 0.173*(1.720) |
| 总效应 | 0.723***(5.687) | 0.270**(2.448) | 0.719***(4.649) |
表6 一二三产业异质性回归结果Tab.6 Heterogeneity regression results for primary industry, secondary industry, and tertiary industry |
| 解释变量 | 邻接矩阵 | ||
|---|---|---|---|
| FIP | SIP | TIP | |
| DIF | 0.154***(3.982) | 0.385***(4.756) | 0.191***(4.081) |
| W·DIF | 0.104(1.450) | 0.413***(2.758) | 0.241***(2.786) |
| 直接效应 | 0.153***(3.856) | 0.396***(4.760) | 0.194***(4.040) |
| 间接效应 | 0.095(1.421) | 0.473***(3.058) | 0.256***(2.983) |
| 总效应 | 0.248***(3.363) | 0.869***(4.902) | 0.450***(4.622) |
表7 稳健性检验Tab.7 Results of robustness test |
| 解释变量 | 模型1:邻接矩阵 (GDP) | 模型2:经济地理距离嵌套矩阵(GDP) | 模型3:邻接矩阵 (人均GDP) | 模型4:邻接矩阵 (夜间灯光值) | 模型5:邻接矩阵 (GDP)缩尾处理 | 模型6:邻接矩阵 (GDP)剔除郑州各县 |
|---|---|---|---|---|---|---|
| DIF | 0.352*** | 0.400*** | 0.408*** | 0.443*** | 0.396*** | 0.629*** |
| W·DIF | 0.290*** | 0.325* | 0.301*** | 0.215** | 0.293*** | 0.519* |
| 直接效应 | 0.362*** | 0.401*** | 0.417*** | 0.448*** | 0.407*** | 0.649*** |
| 间接效应 | 0.361*** | 0.324* | 0.370*** | 0.257*** | 0.365*** | 0.636** |
| 总效应 | 0.723*** | 0.725*** | 0.788*** | 0.706*** | 0.772*** | 1.285*** |

| [1] |
张佰发, 李晶晶, 胡志强, 等. 自然禀赋与政区类型对中国县域经济发展的影响[J]. 地理研究, 2021, 40(9):2508-2525.
|
| [2] |
胡雪瑶, 张子龙, 陈兴鹏, 等. 县域经济发展时空差异和影响因素的地理探测——以甘肃省为例[J]. 地理研究, 2019, 38(4):772-783.
|
| [3] |
魏建飞, 刘玖榕, 李强, 等. 河南省县域国土空间效率格局演变及关联网络特征[J]. 地域研究与开发, 2025, 44(1):54-61.
|
| [4] |
张佰发, 苗长虹, 冉钊, 等. 核心—边缘视角下的黄河流域县域经济差异研究[J]. 地理学报, 2023, 78(6):1355-1375.
|
| [5] |
郭峰, 王靖一, 王芳, 等. 测度中国数字普惠金融发展:指数编制与空间特征[J]. 经济学(季刊), 2020, 19(4):1401-1418.
|
| [6] |
刘伟, 戴冰清, 刘卫镇. 数字金融能驱动经济高质量发展吗?——基于2011-2017年中国省级面板数据的实证分析[J]. 经济社会体制比较, 2021(6):63-75.
|
| [7] |
于斌斌, 王志刚. 城市何以更加“韧性”——数字经济的赋能效应[J]. 地理研究, 2025, 44(2):378-399.
|
| [8] |
张勋, 杨桐, 汪晨, 等. 数字金融发展与居民消费增长:理论与中国实践[J]. 管理世界, 2020, 36(11):48-63.
|
| [9] |
杜锦, 苗长虹, 许家伟, 等. 中原城市群城市高质量发展时空格局与影响因素[J]. 经济地理, 2025, 45(1):67-76.
|
| [10] |
张英浩, 汪明峰, 刘婷婷. 数字经济对中国经济高质量发展的空间效应与影响路径[J]. 地理研究, 2022, 41(7):1826-1844.
|
| [11] |
张国俊, 梁真源, 吴宗书. 中国城市群数字普惠金融演化特征及其对高质量发展的效应分析[J]. 地理研究, 2024, 43(3):621-639.
|
| [12] |
钱海章, 陶云清, 曹松威, 等. 中国数字金融发展与经济增长的理论与实证[J]. 数量经济技术经济研究, 2020, 37(6):26-46.
|
| [13] |
唐文进, 李爽, 陶云清. 数字普惠金融发展与产业结构升级——来自283个城市的经验证据[J]. 广东财经大学学报, 2019, 34(6):35-49.
|
| [14] |
刘安乐, 杨承玥, 明庆忠, 等. 数字普惠金融对县域旅游经济增长的空间溢出效应及其时空异质性[J]. 世界地理研究, 2024, 34(4):111-126.
|
| [15] |
潘爽, 叶德珠, 叶显. 数字金融普惠了吗——来自城市创新的经验证据[J]. 经济学家, 2021(3):101-111.
|
| [16] |
肖威. 数字普惠金融能否改善不平衡不充分的发展局面?[J]. 经济评论, 2021(5):50-64.
|
| [17] |
田卡吨, 彭宝玉, 张博, 等. 黄河流域数字普惠金融的时空演变及影响因素分析[J]. 地域研究与开发, 2024, 43(2):35-40,55.
|
| [18] |
|
| [19] |
袁旭宏, 张怀志, 马超群, 等. 普惠金融影响地方政府债务的作用机制及其时空效应[J]. 经济地理, 2024, 44(8):68-76.
|
| [20] |
刘亦文, 丁李平, 李毅, 等. 中国普惠金融发展水平测度与经济增长效应[J]. 中国软科学, 2018(3):36-46.
|
| [21] |
王刚贞, 陈梦洁. 数字普惠金融影响经济高质量发展的渠道机理与异质特征[J]. 财贸研究, 2022, 33(10):45-56.
|
| [22] |
王耕南, 张国俊, 周春山. 珠三角数字普惠金融的时空演化特征及影响因子[J]. 地域研究与开发, 2022, 41(5):25-31.
|
| [23] |
|
| [24] |
刘海龙, 安芷萱, 王焕珂, 等. 京津冀城市群县域城市韧性与创新效率耦合协调时空演变及影响因素的空间异质性[J]. 地理研究, 2025, 44(2):577-602.
|
| [25] |
秦琳贵, 刘松岐, 王琬植, 等. 长江经济带数字普惠金融与农业新质生产力耦合协调关系研究[J]. 地域研究与开发, 2025, 44(3):16-24,32.
|
| [26] |
|
| [27] |
|
| [28] |
孙淑惠, 刘传明, 王菲, 等. 中国县域新型农村集体经济发展的时空演变及驱动机制[J]. 地理研究, 2025, 44(3):691-710.
|
| [29] |
周天芸, 岳科研, 张幸. 区域金融中心与区域经济增长的实证研究[J]. 经济地理, 2014, 34(1):114-120.
|
| [30] |
赵涛, 张智, 梁上坤. 数字经济、创业活跃度与高质量发展——来自中国城市的经验证据[J]. 管理世界, 2020, 36(10):65-76.
|
| [31] |
蒋国富, 刘长运. 河南省县域经济的空间分异[J]. 经济地理, 2008, 28(4):636-639.
|
| [32] |
李明贤, 郑洲舟, 陈铯. 县域数字普惠金融发展的空间格局演化与影响因素分析——以湖南省为例[J]. 经济地理, 2021, 41(8):136-143.
|
| [33] |
朱勤, 刘玥, 杨晶晶. 数字化转型促进区域贸易竞争力提升的空间效应[J]. 经济地理, 2023, 43(12):126-134.
|
| [34] |
张航, 郭雨臣, 张红娟, 等. 极端高温对黄河流域经济增长的时空影响探测[J]. 地理学报, 2025, 80(5):1353-1369.
|
/
| 〈 |
|
〉 |