
Spatiotemporal Evolution and Influencing Factors of the Agglomeration Development of China's Digital-driven Enterprise
Received date: 2025-07-25
Revised date: 2026-01-21
Online published: 2026-04-29
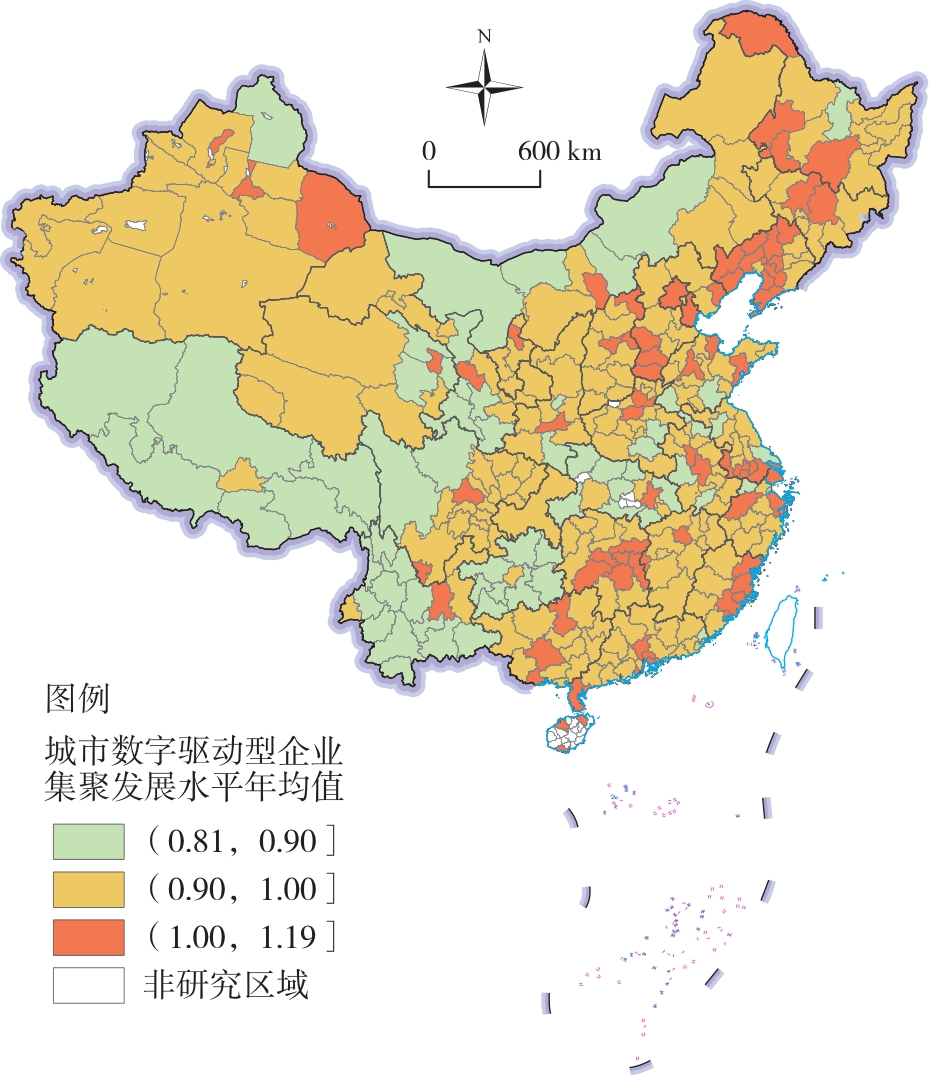
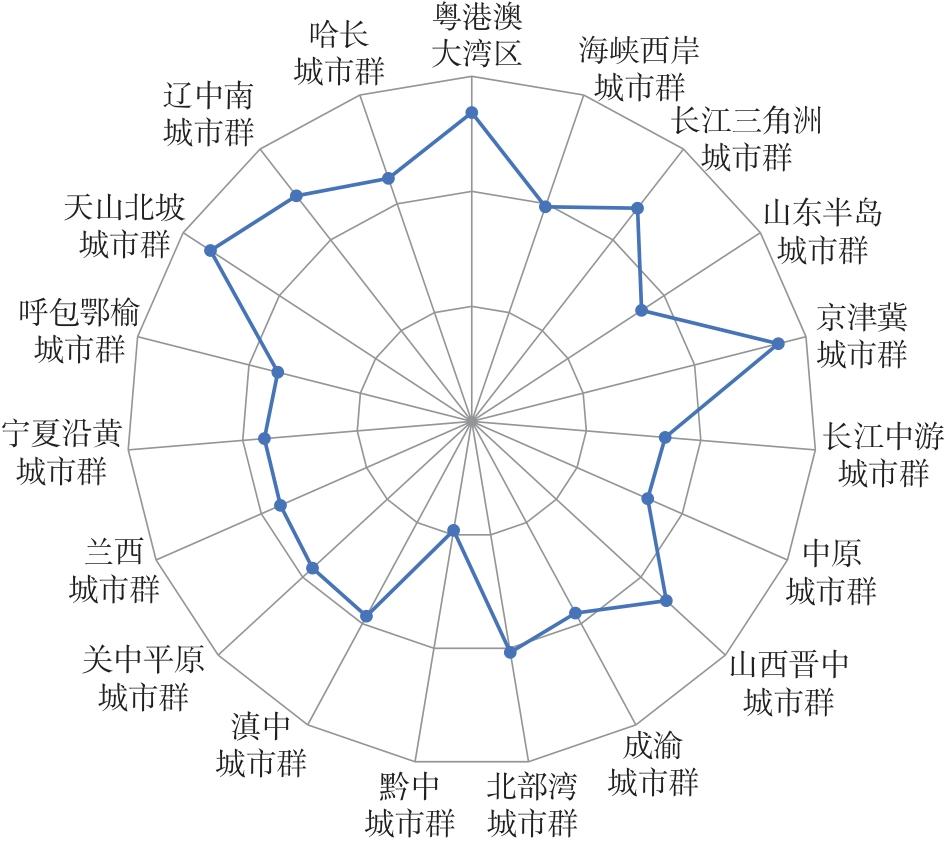
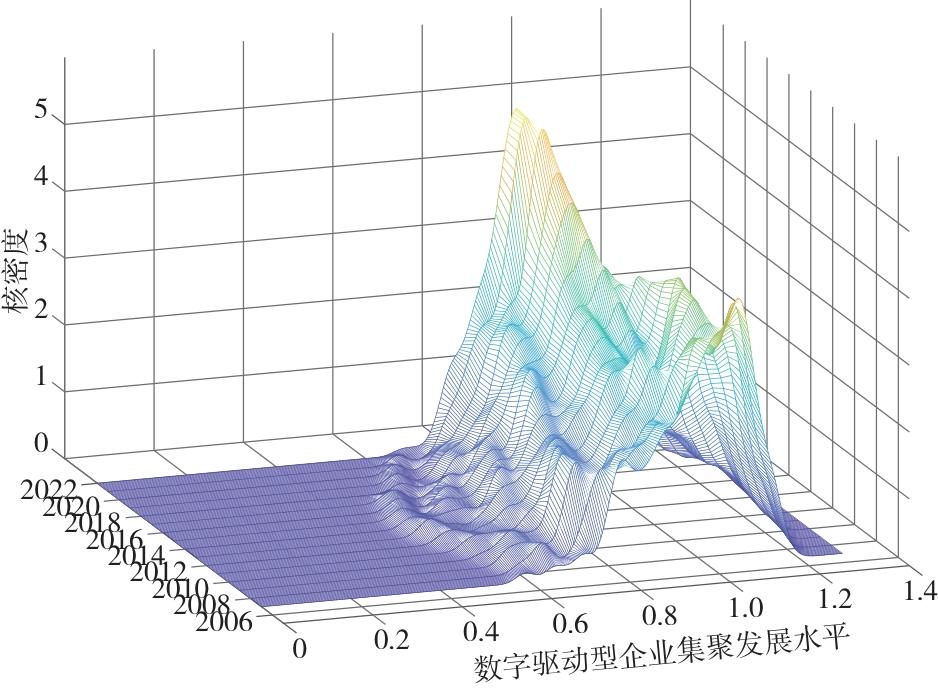
Based on the data from Chinese cities and enterprises, this study employs the methods of Dagum Gini coefficient, Moran index, and Markov chain analysis to reveal the spatiotemporal evolution and influencing factors of the agglomeration development of digital-driven enterprise in China. The key findings are that: 1) Overall, China's digital-driven enterprises exhibit distinct distribution characteristics in 2007-2022. High-agglomeration areas are concentrated in four types of economic functional core zones: national core hubs, coastal gateways for opening up, heavy industry transformation cities, and inland regional centers. Medium-agglomeration areas are radially distributed around high-agglomeration cities. Low-agglomeration areas are mainly located in the four provinces of Yunnan, Guizhou, Tibet, Gansu, as well as some cities of Hubei, exhibiting positive spatial autocorrelation. 2) From a regional perspective, it shows significant disparities in the agglomeration development level of digital-driven enterprise among China's 19 major urban agglomerations. The Guangdong-Hong Kong-Macao Greater Bay Area, the Yangtze River Delta, the Beijing-Tianjin-Hebei, the Northern Slope of Tianshan Mountains, the Central and Southern Liaoning, the Harbin-Changchun, and the Jinzhong urban agglomerations exhibit relatively higher agglomeration development levels. These urban agglomerations act as the main source of overall spatial differences. 3) In terms of dynamic evolution, the agglomeration development of digital-driven enterprise shows a "gradient solidification" feature in 2007-2022. The main peak of the kernel density curve shifts slightly left. The peak value first decreases and then increases. The curve narrows with a left tail, and its shape changes from a flat shape to a steep one. 4) The seven influencing factors of agglomeration development of digital-driven enterprise can be divided into three tiers by impact intensity. Economic development level and human capital level are in the strong tier. Digital innovation level, government intervention level, and financial development level are moderate. Digital infrastructure and economic openness level are weak.
SONG Pei , LI Lin , ZHU Qing , AI Yang . Spatiotemporal Evolution and Influencing Factors of the Agglomeration Development of China's Digital-driven Enterprise[J]. Economic geography, 2026 , 46(3) : 118 -126 . DOI: 10.15957/j.cnki.jjdl.2026.03.012
表1 中国数字驱动型企业集聚发展水平全局莫兰指数Tab.1 Global Moran index of the agglomeration development level of China's digital-driven enterprise |
| 年份 | 数字驱动型企业集聚发展水平 | |||||
|---|---|---|---|---|---|---|
| 空间邻接矩阵 | 空间地理矩阵 | 空间经济地理矩阵 | ||||
| Moran's I | Z值 | Moran's I | Z值 | Moran's I | Z值 | |
| 2007 | 0.310*** | 7.564 | 0.073*** | 14.495 | 0.083*** | 2.800 |
| 2008 | 0.319*** | 7.779 | 0.072*** | 14.446 | 0.088*** | 2.979 |
| 2009 | 0.343*** | 8.358 | 0.077*** | 15.216 | 0.115*** | 3.847 |
| 2010 | 0.374*** | 9.090 | 0.079*** | 15.762 | 0.128*** | 4.270 |
| 2011 | 0.392*** | 9.537 | 0.081*** | 16.079 | 0.131*** | 4.383 |
| 2012 | 0.407*** | 9.903 | 0.083*** | 16.416 | 0.139*** | 4.642 |
| 2013 | 0.414*** | 10.075 | 0.082*** | 16.194 | 0.151*** | 5.011 |
| 2014 | 0.411*** | 9.989 | 0.078*** | 15.514 | 0.165*** | 5.481 |
| 2015 | 0.410*** | 9.963 | 0.079*** | 15.657 | 0.181*** | 6.010 |
| 2016 | 0.402*** | 9.790 | 0.080*** | 15.906 | 0.207*** | 6.854 |
| 2017 | 0.399*** | 9.704 | 0.080*** | 15.897 | 0.231*** | 7.625 |
| 2018 | 0.387*** | 9.408 | 0.076*** | 15.205 | 0.255*** | 8.411 |
| 2019 | 0.373*** | 9.093 | 0.073*** | 14.564 | 0.269*** | 8.864 |
| 2020 | 0.386*** | 9.388 | 0.074*** | 14.699 | 0.302*** | 9.935 |
| 2021 | 0.370*** | 9.011 | 0.072*** | 14.425 | 0.301*** | 9.902 |
| 2022 | 0.361*** | 7.564 | 0.073*** | 14.594 | 0.324*** | 10.639 |
表2 Markov转移概率矩阵结果Tab.2 Markov transfer probability matrix |
| Markov 链类型 | 空间滞后类型 | t/t+1 | Ⅰ | Ⅱ | Ⅲ | Ⅳ |
|---|---|---|---|---|---|---|
| 传统 | 无滞后 | Ⅰ | 0.949 | 0.051 | 0.000 | 0.000 |
| Ⅱ | 0.055 | 0.894 | 0.048 | 0.004 | ||
| Ⅲ | 0.002 | 0.103 | 0.849 | 0.046 | ||
| Ⅳ | 0.000 | 0.000 | 0.091 | 0.909 | ||
| 空间 | 邻近程度低 | Ⅰ | 0.992 | 0.004 | 0.000 | 0.004 |
| Ⅱ | 0.200 | 0.667 | 0.133 | 0.000 | ||
| Ⅲ | 0.000 | 0.375 | 0.500 | 0.125 | ||
| Ⅳ | 0.000 | 0.000 | 0.020 | 0.980 | ||
| 邻近程度较低 | Ⅰ | 0.976 | 0.015 | 0.004 | 0.004 | |
| Ⅱ | 0.273 | 0.545 | 0.152 | 0.030 | ||
| Ⅲ | 0.152 | 0.333 | 0.303 | 0.212 | ||
| Ⅳ | 0.004 | 0.013 | 0.069 | 0.914 | ||
| 邻近程度较高 | Ⅰ | 0.939 | 0.041 | 0.014 | 0.006 | |
| Ⅱ | 0.352 | 0.338 | 0.268 | 0.042 | ||
| Ⅲ | 0.074 | 0.263 | 0.421 | 0.242 | ||
| Ⅳ | 0.012 | 0.005 | 0.054 | 0.929 | ||
| 邻近程度高 | Ⅰ | 0.903 | 0.073 | 0.019 | 0.004 | |
| Ⅱ | 0.315 | 0.356 | 0.274 | 0.055 | ||
| Ⅲ | 0.078 | 0.252 | 0.515 | 0.155 | ||
| Ⅳ | 0.003 | 0.007 | 0.029 | 0.961 |
表3 中国19个城市群数字驱动型企业集聚发展的分布及特征Tab.3 Distribution characteristics of the agglomeration development of digital-driven enterprise in 19 urban agglomerations of China |
| 城市群 | 分布位置 | 主峰分布形态 | 分布延展性 | 波峰数目 |
|---|---|---|---|---|
| 粤港澳大湾区 | 右移 | 高度先上升后下降,宽度变大 | 左拖尾,延展收敛 | 双峰、多峰 |
| 海峡西岸 | 左移 | 高度先上升后下降,宽度先变大后变小 | 左拖尾,延展收敛 | 双峰、多峰 |
| 长江三角洲 | 右移 | 高度先下降后上升,宽度先变小后变大 | 左拖尾,延展收敛 | 多峰 |
| 山东半岛 | 左移 | 高度先下降后上升,宽度变大 | 左拖尾,延展收敛 | 双峰、多峰 |
| 京津冀 | 左移 | 高度先下降后上升,宽度先变小后变大 | 左拖尾,延展收敛 | 多峰 |
| 长江中游 | 右移 | 高度先下降后上升,宽度变大 | 左拖尾,延展收敛 | 多峰 |
| 中原 | 右移 | 高度先下降后上升,宽度先变小后变大 | 左拖尾,延展收敛 | 多峰 |
| 山西晋中 | 左移 | 高度先下降后上升,宽度先变小后变大 | 左拖尾,延展收敛 | 双峰、多峰 |
| 成渝 | 左移 | 高度先下降后上升,宽度变小 | 左拖尾,延展收敛 | 多峰 |
| 北部湾 | 右移 | 高度上升,宽度变大 | 左拖尾,延展收敛 | 双峰、多峰 |
| 黔中 | 右移 | 高度上升,宽度变大 | 左拖尾,延展收敛 | 双峰 |
| 滇中 | 左移 | 高度先上升后下降,宽度不变 | 左拖尾,延展收敛 | 双峰、多峰 |
| 关中平原 | 右移 | 高度先上升后下降,宽度先变小后变大 | 左拖尾,延展收敛 | 双峰、多峰 |
| 兰西 | 左移 | 高度先下降后上升,宽度变小 | 左拖尾,延展收敛 | 单峰、双峰 |
| 宁夏沿黄 | 右移 | 高度先上升后下降,宽度变大 | 左拖尾,延展收敛 | 双峰、多峰 |
| 呼包鄂榆 | 左移 | 高度先下降后上升,宽度不变 | 左拖尾,延展收敛 | 双峰 |
| 天山北坡 | 右移 | 高度不变,宽度变大 | 左拖尾,延展收敛 | 单峰 |
| 辽中南 | 左移 | 高度先下降后上升,宽度变大 | 左拖尾,延展收敛 | 单峰、双峰 |
| 哈长 | 左移 | 高度先下降后上升,宽度先变小后变大 | 左拖尾,延展收敛 | 单峰、双峰、多峰 |
表4 变量的相关系数检验结果Tab.4 Test results of the correlation coefficients of variables |
| 变量 | LQ | Open | Gov | Fin | Human | Pgdp | Dig | Patent |
|---|---|---|---|---|---|---|---|---|
| LQ | 1.000 | |||||||
| Open | 0.190*** | 1.000 | ||||||
| Gov | -0.245*** | -0.122*** | 1.000 | |||||
| Fin | 0.270*** | 0.171*** | 0.122*** | 1.000 | ||||
| Human | 0.408*** | 0.203*** | -0.250*** | 0.633*** | 1.000 | |||
| Pgdp | 0.301*** | 0.216*** | -0.332*** | 0.396*** | 0.470*** | 1.000 | ||
| Dig | 0.070*** | 0.046*** | 0.078*** | 0.012 | -0.023 | -0.333*** | 1.000 | |
| Patent | 0.214*** | 0.161*** | -0.054*** | 0.263*** | 0.227*** | 0.279*** | -0.039** | 1.000 |
注:为节省版面,标准误不显示。表5同。 |
表5 七大影响因素的回归结果Tab.5 Regression results of seven major influencing factors |
| 变量 | (1) | (2) | (3) | (4) | (5) | (6) | (7) |
|---|---|---|---|---|---|---|---|
| Open | 0.045*** | 0.039*** | 0.026*** | 0.023*** | 0.021*** | 0.018*** | 0.016*** |
| Gov | -0.303*** | -0.358*** | -0.234*** | -0.202*** | -0.191*** | -0.192*** | |
| Fin | 0.059*** | 0.020*** | 0.015*** | 0.011*** | 0.008* | ||
| Human | 1.478*** | 1.406*** | 1.360*** | 1.350*** | |||
| Pgdp | 0.015*** | 0.026*** | 0.022*** | ||||
| Dig | 0.903*** | 0.888*** | |||||
| Patent | 0.065*** | ||||||
| 常数项 | 0.948*** | 1.006*** | 0.960*** | 0.948*** | 0.793*** | 0.656*** | 0.698*** |
表6 空间分异因子探测结果Tab.6 Spatial differentiation factor detection results |
| 影响因子 | 2007 | 2012 | 2017 | 2022 | |||||||
|---|---|---|---|---|---|---|---|---|---|---|---|
| q值 | p值 | q值 | p值 | q值 | p值 | q值 | p值 | ||||
| Open | 0.040 | 0.046 | 0.057 | 0.006 | 0.143 | 0.000 | 0.278 | 0.000 | |||
| Gov | 0.044 | 0.031 | 0.086 | 0.000 | 0.081 | 0.000 | 0.215 | 0.000 | |||
| Fin | 0.062 | 0.005 | 0.072 | 0.000 | 0.189 | 0.000 | 0.184 | 0.000 | |||
| Human | 0.153 | 0.000 | 0.131 | 0.000 | 0.221 | 0.000 | 0.260 | 0.000 | |||
| Pgdp | 0.075 | 0.000 | 0.155 | 0.000 | 0.190 | 0.000 | 0.297 | 0.000 | |||
| Dig | 0.013 | 0.529 | 0.009 | 0.696 | 0.010 | 0.630 | 0.036 | 0.062 | |||
| Patent | 0.071 | 0.000 | 0.092 | 0.000 | 0.149 | 0.000 | 0.288 | 0.000 | |||
| [1] |
屠西伟, 史丹. 数字产业集聚与企业能源效率改进[J]. 数量经济技术经济研究, 2025, 42(10):70-89.
|
| [2] |
刘修岩, 张学良. 集聚经济与企业区位选择——基于中国地级区域企业数据的实证研究[J]. 财经研究, 2010, 36(11):83-92.
|
| [3] |
陈肖飞, 韩腾腾, 栾俊婉, 等. 新创企业的时空分异与区位选择——基于中国汽车制造业的实证研究[J]. 地理研究, 2021, 40(6):1749-1767.
|
| [4] |
范剑勇. 产业集聚与地区间劳动生产率差异[J]. 经济研究, 2006(11):72-81.
|
| [5] |
盛天翔, 许润韬, 范从来, 等. 中国金融科技公司时空格局及其影响因素[J]. 经济地理, 2025, 45(3):119-128.
|
| [6] |
唐晓华, 陈阳, 张欣钰. 中国制造业集聚程度演变趋势及时空特征研究[J]. 经济问题探索, 2017(5):172-181.
|
| [7] |
胡霞. 中国城市服务业空间集聚变动趋势研究[J]. 财贸经济, 2008(6):103-107,129.
|
| [8] |
|
| [9] |
范剑勇, 刘念, 刘莹莹. 地理距离、投入产出关系与产业集聚[J]. 经济研究, 2021, 56(10):138-154.
|
| [10] |
赵放, 张淼, 金雨晴. 数字产业集聚能否带动人口集聚——基于劳动力市场分割与预期收入双重视角[J]. 人口学刊, 2025, 47(4):113-128.
|
| [11] |
郭峰, 王靖一, 王芳, 等. 测度中国数字普惠金融发展:指数编制与空间特征[J]. 经济学(季刊), 2020, 19(4):1401-1418.
|
| [12] |
胡金焱, 郭太然, 张博. 金融发展与制造业集聚——基于专业化与多元化集聚的双重视角[J]. 财贸经济, 2025, 46(7):106-123.
|
| [13] |
刘奕, 夏杰长, 李垚. 生产性服务业集聚与制造业升级[J]. 中国工业经济, 2017(7):24-42.
|
| [14] |
韩峰, 阳立高. 生产性服务业集聚如何影响制造业结构升级?——一个集聚经济与熊彼特内生增长理论的综合框架[J]. 管理世界, 2020, 36(2):72-94,219.
|
| [15] |
王彬燕, 田俊峰, 程利莎, 等. 中国数字经济空间分异及影响因素[J]. 地理科学, 2018, 38(6):859-868.
|
| [16] |
王军, 朱杰, 罗茜. 中国数字经济发展水平及演变测度[J] .数量经济技术经济研究, 2021, 38(7):26-42.
|
| [17] |
|
| [18] |
姚冲, 甄峰, 席广亮, 等. 江苏省数字经济高质量发展的空间格局及影响要素[J]. 资源科学, 2025, 47(2):268-280.
|
| [19] |
杨承佳. 中国制造业智能化水平、区域差异及分布动态演进[J]. 统计与决策, 2024, 40(6):104-109.
|
| [20] |
|
| [21] |
李健旋. 中国制造业智能化程度评价及其影响因素研究[J]. 中国软科学, 2020(1):154-163.
|
| [22] |
|
| [23] |
|
| [24] |
刘修岩, 王雨昕. 城市群尺度下中国数字企业的时空分布格局演变特征分析[J]. 经济与管理评论, 2025, 41(3):5-17.
|
| [25] |
封进, 李雨婷. 人口老龄化与企业进入:基于中国地级市的研究[J]. 世界经济, 2023, 46(4):170-191.
|
/
| 〈 |
|
〉 |
