
Spatiotemporal Differentiation of Land Use Carbon Emissions in Counties of Wuhan Urban Circle and Its Influencing Factors
Received date: 2023-06-20
Revised date: 2025-01-23
Online published: 2026-04-10
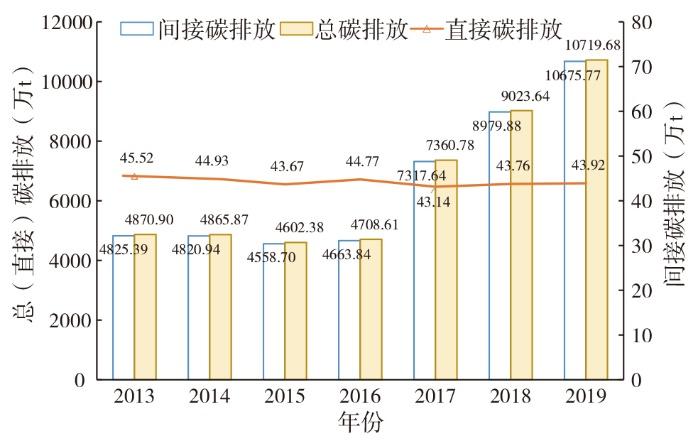
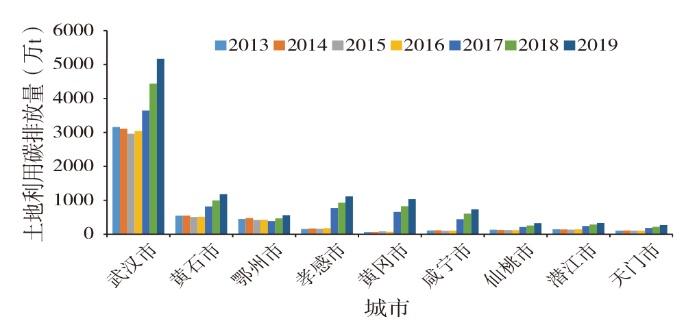
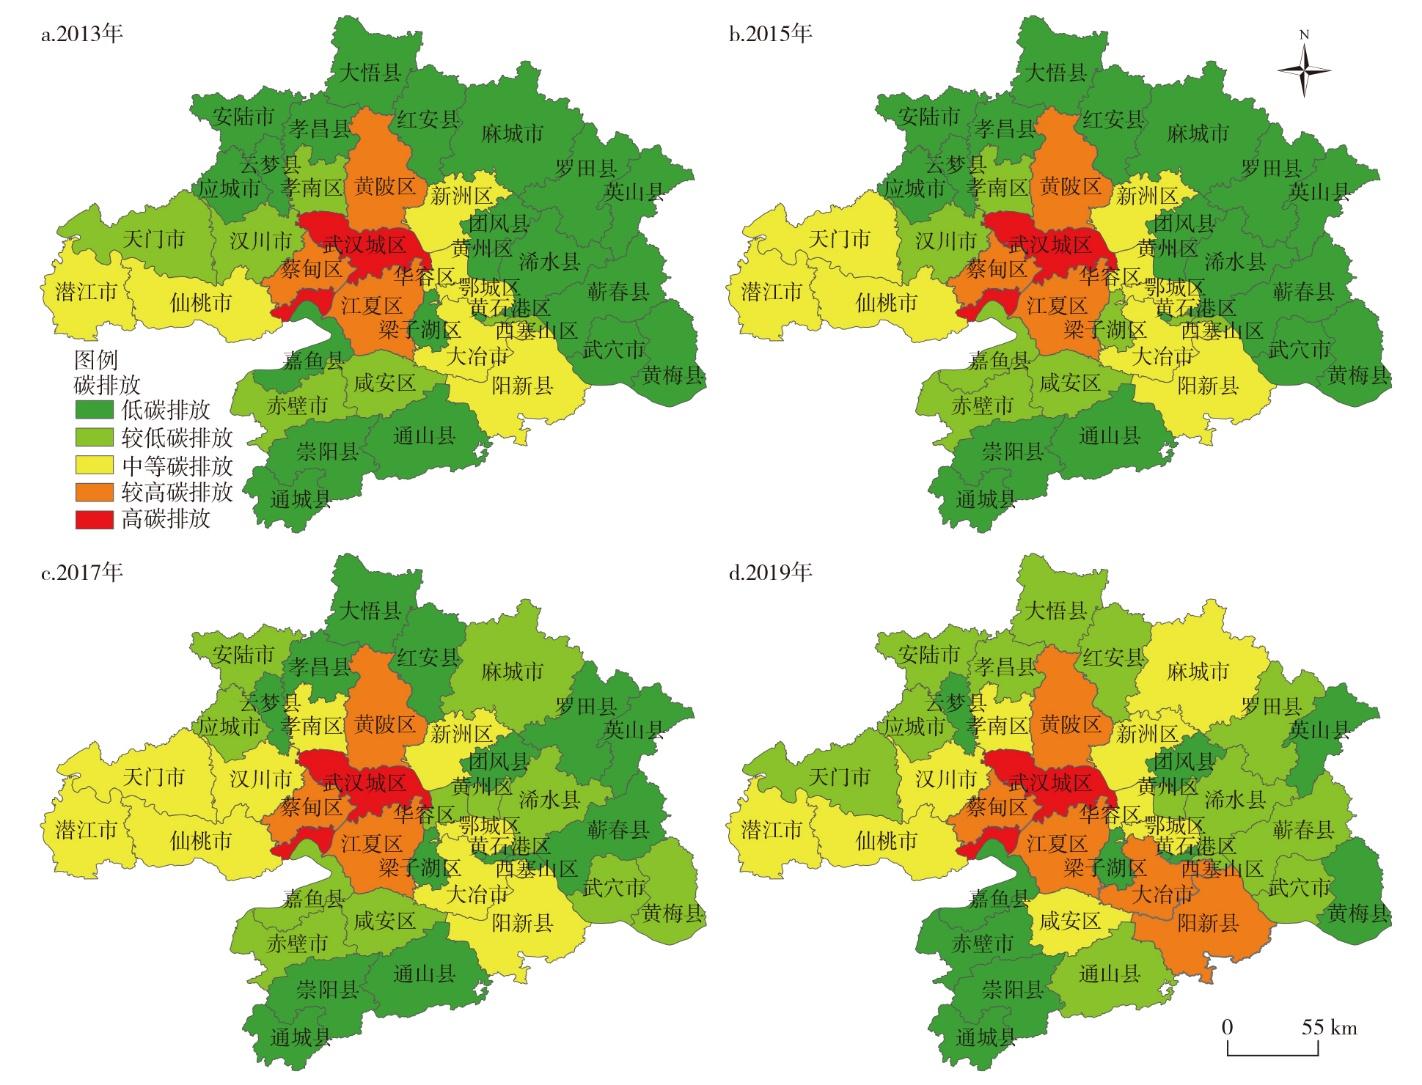
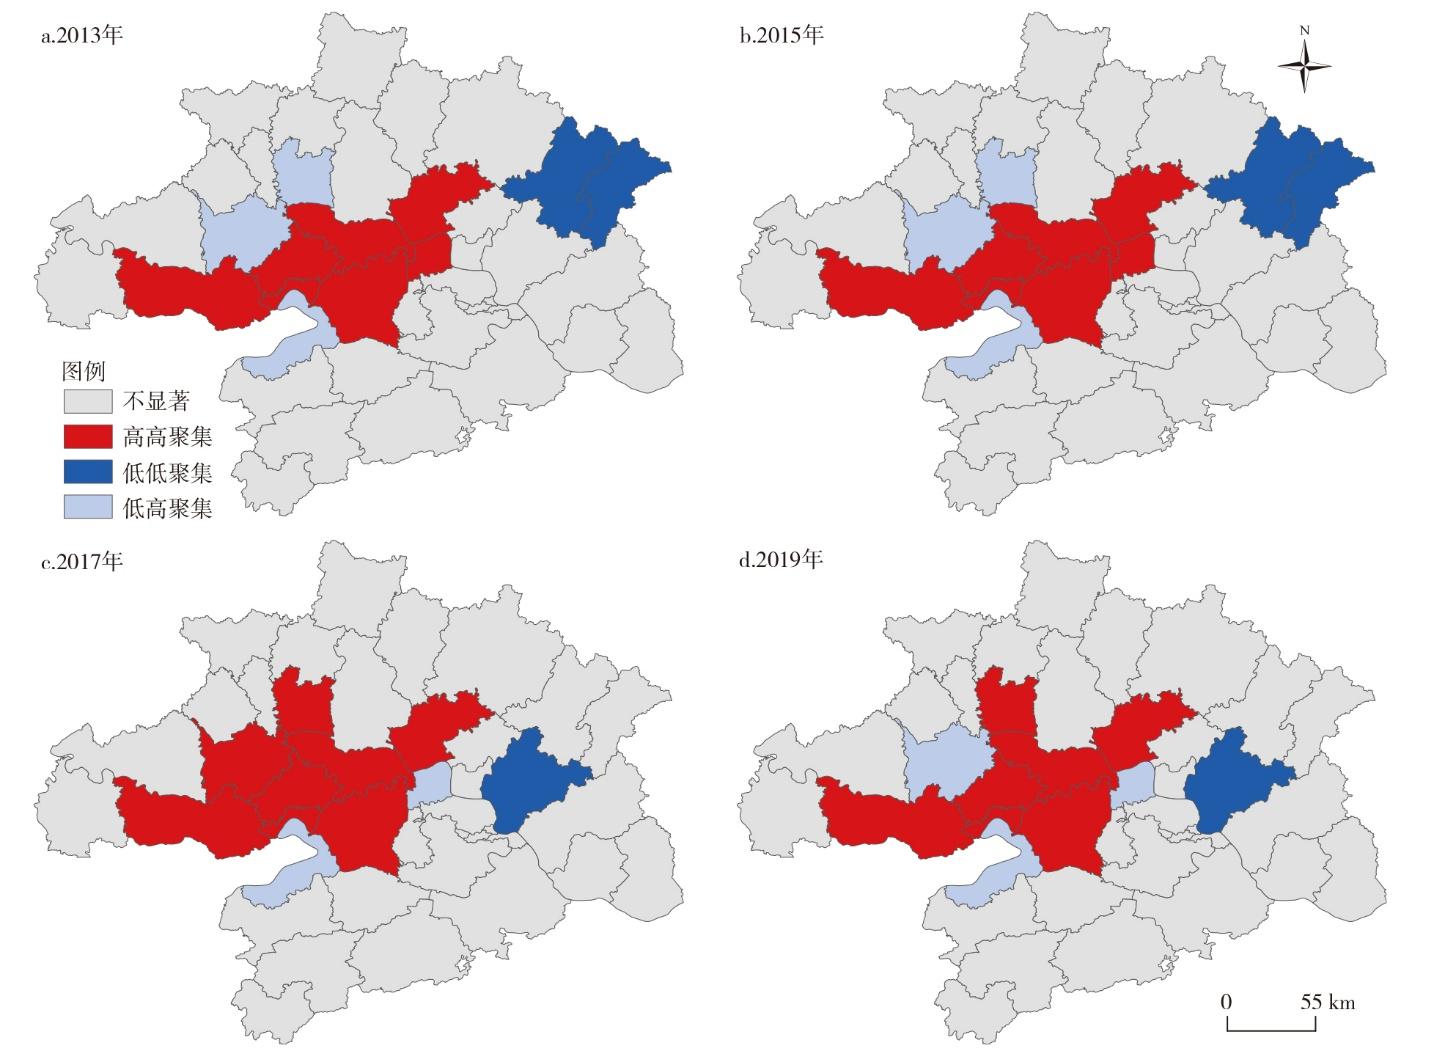
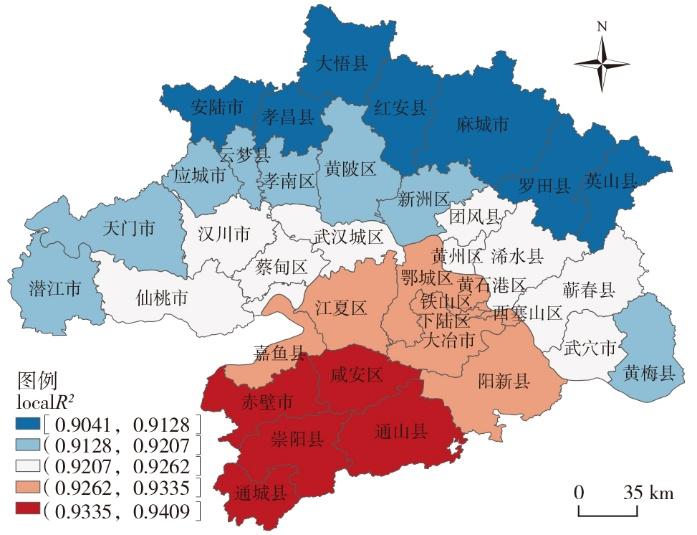
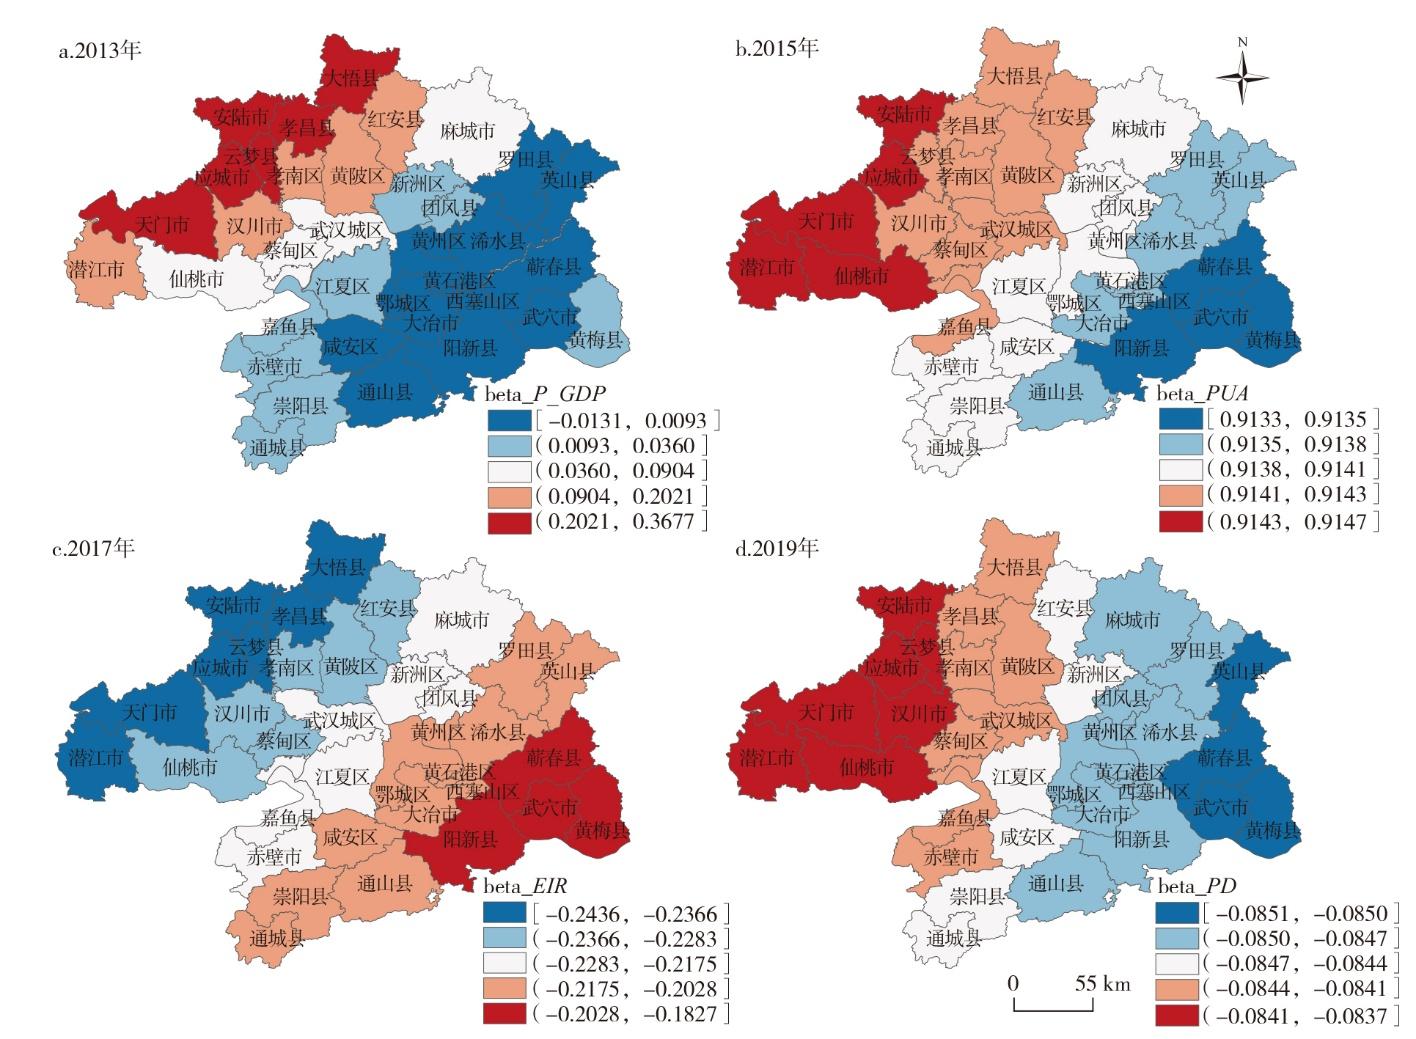
Based on the direct and indirect carbon emission measurement models, this article estimates the land use carbon emissions in Wuhan urban circle at county level from 2013 to 2019, and analyzes the spatial and temporal differentiation characteristics and influencing factors of land use carbon emissions using spatial exploratory analysis tools, multi-scale geographically-weighted regression model (MGWR), and NPP-VIIRS nighttime light data. The empirical results show that: 1) Carbon emissions from land use in Wuhan urban circle declined slightly each year from 2013 to 2015, increased slightly in 2016, and have been increasing significantly each year since 2017. 2) The overall land use carbon emissions in the Wuhan urban circle exhibit a pattern which is higher in the central region and lower in the surrounding areas, with Wuhan, Huangshi and Xiaogan as the main sources of carbon emissions. 3) There is a significant positive correlation in the spatial distribution of land use carbon emissions across the study areas, and the correlation strength increases year by year, forming the spatial characteristics of high-high agglomeration centered on the main urban area of Wuhan City and low-low agglomeration centered on Huanggang City. 4) Among the four main factors influencing land use carbon emissions, the level of economic development and the degree of land construction and development have a positive influence, while energy efficiency and population density have a negative influence.

TANG Wenbin , LIU Huiqin , LIU Ye . Spatiotemporal Differentiation of Land Use Carbon Emissions in Counties of Wuhan Urban Circle and Its Influencing Factors[J]. Economic geography, 2026 , 46(2) : 92 -102 . DOI: 10.15957/j.cnki.jjdl.2026.02.009
表1 能源及土地利用类型碳排放系数Tab.1 Carbon emission coefficients for energy and land use types |
| 能源消耗类型 | 标准煤折算系数 | 碳排放系数 | 土地利用类型 | 碳排放系数 |
|---|---|---|---|---|
| 原煤 | 0.7143(kgce/kg) | 0.7559(kgC/kgce) | 耕地 | 0.0479[kgC/(m2·a)] |
| 煤油 | 1.4286(kgce/kg) | 0.5714(kgC/kgce) | 林地 | -0.0644[kgC/(m2·a)] |
| 液化石油气 | 1.7132(kgce/kg) | 0.5042(kgC/kgce) | 草地 | -0.0210[kgC/(m2·a)] |
| 天然气 | 1.3300(kgce/m3) | 0.4483(kgC/kgce) | 水域 | -0.0253[kgC/(m2·a)] |
| 电力 | 0.1230(kgce/kW·h) | 0.9372(kgC/kgce) | 未利用地 | -0.0005[kgC/(m2·a)] |
| 热力 | 0.0341(kgce/MJ) | 1.8350(kgC/kgce) |
表2 武汉城市圈2013—2019年碳排放量(万t)Tab.2 Carbon emissions in Wuhan urban circle from 2013 to 2019(10000 tons) |
| 年份 | 耕地 | 建设用地 | 碳源 | 林地 | 草地 | 水域 | 未利用地 | 碳汇 | 合计 |
|---|---|---|---|---|---|---|---|---|---|
| 2013 | 164.0657 | 4825.3864 | 4989.4521 | -108.0390 | -0.1070 | -10.4026 | -0.0002 | -118.5504 | 4870.9035 |
| 2014 | 163.6684 | 4820.9446 | 4984.6130 | -108.2500 | -0.0934 | -10.3950 | -0.0002 | -118.7398 | 4865.8746 |
| 2015 | 162.8155 | 4558.7049 | 4721.5204 | -108.5882 | -0.0817 | -10.4719 | -0.0002 | -119.1432 | 4602.3786 |
| 2016 | 163.1262 | 4663.8373 | 4826.9635 | -108.0313 | -0.0710 | -10.2482 | -0.0002 | -118.3520 | 4708.6130 |
| 2017 | 162.1552 | 7317.6362 | 7479.7914 | -108.7294 | -0.0679 | -10.2167 | -0.0002 | -119.0155 | 7360.7774 |
| 2018 | 162.4079 | 8979.8756 | 9142.2835 | -108.7529 | -0.0656 | -9.8267 | -0.0002 | -118.6466 | 9023.6383 |
| 2019 | 162.4189 | 10675.766 | 10838.1844 | -108.7618 | -0.0590 | -9.6804 | -0.0002 | -118.5028 | 10719.6837 |
表3 武汉城市圈城市间接碳排放拟合方程Tab.3 Fitting equation of indirect carbon emissions of cities in Wuhan urban circle |
| 城市 | 回归方程 | R² |
|---|---|---|
| 孝感 | y=0.03395x-1884 | 0.9512*** |
| 黄冈 | y=0.02898x-2208 | 0.9861*** |
| 咸宁 | y=0.02974x-1084 | 0.9801*** |
| 黄石 | y=0.06148x-2370 | 0.9027*** |
| 仙桃 | y=0.02742x-278.5 | 0.9775*** |
| 潜江 | y=0.03209x-406.5 | 0.9783*** |
| 天门 | y=0.02791x-237.3 | 0.9840*** |
| 鄂州 | y=0.06150x-2370 | 0.9030*** |
| 武汉 | y=0.03869x-4408 | 0.8611** |
注:y代表拟合的能源消耗碳排放量,x代表市域TDN值,***和**分别表示在1%和5%水平下通过显著性检验。 |
表4 武汉城市圈县域碳排放空间自相关莫兰指数Tab.4 Moran's index of spatial autocorrelation of carbon emissions in Wuhan urban circle at county level |
| 年份 | 2013 | 2014 | 2015 | 2016 | 2017 | 2018 | 2019 |
|---|---|---|---|---|---|---|---|
| Moran's I | 0.2234 | 0.2240 | 0.2240 | 0.2273 | 0.2529 | 0.2563 | 0.2687 |
| Z值 | 3.1770 | 3.1600 | 3.1945 | 3.2626 | 3.5037 | 3.4793 | 3.5454 |
| P值 | 0.0014 | 0.0015 | 0.0014 | -0.0011 | 0.0004 | 0.0005 | 0.0003 |
表5 相关变量定义及其统计性描述Tab.5 Definition of relevant variables and their statistical descriptions |
| 变量 | 含义 | 单位 | VIF |
|---|---|---|---|
| C | 碳排放量 | 万t | - |
| P_GDP | 人均GDP | 亿元/万人 | 1.1724 |
| PUA | 建设用地面积占总面积的比例 | % | 1.2624 |
| PD | 单位面积人口数量 | 人/km2 | 1.3320 |
| EIR | 单位能源消耗量所产生的GDP | 万元/t 标准煤 | 1.1859 |
表6 碳排放回归分析结果对比Tab.6 Comparison of carbon emission regression results |
| 变量 | 总碳排放 | 直接碳排放 | 间接碳排放 | ||||||||
|---|---|---|---|---|---|---|---|---|---|---|---|
| 回归系数 | P值 | AICc | 回归系数 | P值 | AICc | 回归系数 | P值 | AICc | |||
| P_GDP | 0.0740 | 0.0020 | 28.4400 | 0.0680 | 0.0000 | 78.3390 | 0.0730 | 0.0020 | 28.9250 | ||
| EIR | -0.2200 | 0.0150 | -0.2020 | 0.2630 | -0.2170 | 0.0220 | |||||
| PUA | 0.9140 | 0.0000 | 0.4210 | 0.0000 | 0.9150 | 0.0000 | |||||
| PD | -0.0840 | 0.0030 | -0.0660 | 1.4360 | -0.0850 | 0.0030 | |||||
| [1] |
杜海波, 魏伟, 张学渊, 等. 黄河流域能源消费碳排放时空格局演变及影响因素——基于DMSP/OLS与NPP/VIIRS夜间灯光数据[J]. 地理研究, 2021, 40(7):2051-2065.
|
| [2] |
|
| [3] |
|
| [4] |
|
| [5] |
吉雪强, 刘慧敏, 张跃松. 中国省际土地利用碳排放空间关联网络结构演化及驱动因素[J]. 经济地理, 2023, 43(2):190-200.
|
| [6] |
|
| [7] |
吴志强. 国土空间规划的五个哲学问题[J]. 城市规划学刊, 2020(6):7-10.
|
| [8] |
王睿, 张赫, 冯兰萌. 中国县域规模结构对居民生活碳排放的影响关系研究——关键要素及代表性指标[J]. 现代城市研究, 2021(2):126-132.
|
| [9] |
|
| [10] |
苏泳娴, 陈修治, 叶玉瑶, 等. 基于夜间灯光数据的中国能源消费碳排放特征及机理[J]. 地理学报, 2013, 68(11):1513-1526.
|
| [11] |
|
| [12] |
|
| [13] |
易丹, 欧名豪, 郭杰, 等. 土地利用碳排放及低碳优化研究进展与趋势展望[J]. 资源科学, 2022, 44(8):1545-1559.
|
| [14] |
陈瑞敏, 马晓君, 李宜良. 黄河流域五大增长极碳排放脱钩效应——基于GDIM的因素分解[J]. 中国环境科学, 2024, 44(5):2853-2866.
|
| [15] |
|
| [16] |
|
| [17] |
刘天蔚, 边晓燕, 吴珊, 等. 电力系统碳排放核算综述与展望[J]. 电力系统保护与控制, 2024, 52(4):176-187.
|
| [18] |
|
| [19] |
牛亚文, 赵先超, 胡艺觉. 基于NPP-VIIRS夜间灯光的长株潭地区县域土地利用碳排放空间分异研究[J]. 环境科学学报, 2021, 41(9):3847-3856.
|
| [20] |
王少剑, 谢紫寒, 王泽宏. 中国县域碳排放的时空演变及影响因素[J]. 地理学报, 2021, 76(12):3103-3118.
|
| [21] |
孙彩凤, 姜巍, 高卫东. 山东省土地利用碳排放变化的时空特征及影响因素分析[J]. 环境科学, 2025, 46(1):30-40.
|
| [22] |
高国力, 文扬, 王丽, 等. 基于碳排放影响因素的城市群碳达峰研究[J]. 经济管理, 2023, 45(2):39-58.
|
| [23] |
陈帝伯, 魏伟, 周俊菊, 等. 中国省域碳源/碳汇强度及碳盈亏的空间演变[J]. 经济地理, 2023, 43(1):159-168.
|
| [24] |
|
| [25] |
沈体雁, 于瀚辰, 周麟, 等. 北京市二手住宅价格影响机制——基于多尺度地理加权回归模型(MGWR)的研究[J]. 经济地理, 2020, 40(3):75-83.
|
| [26] |
|
| [27] |
孙赫, 梁红梅, 常学礼, 等. 中国土地利用碳排放及其空间关联[J]. 经济地理, 2015, 35(3):154-162.
|
| [28] |
苑韶峰, 唐奕钰. 低碳视角下长江经济带土地利用碳排放的空间分异[J]. 经济地理, 2019, 39(2):190-198.
|
| [29] |
张润森, 濮励杰, 文继群, 等. 建设用地扩张与碳排放效应的库兹涅茨曲线假说及验证[J]. 自然资源学报, 2012, 27(5):723-733.
|
| [30] |
范建双, 虞晓芬, 周琳. 南京市土地利用结构碳排放效率增长及其空间相关性[J]. 地理研究, 2018, 37(11):2177-2192.
|
| [31] |
孙贤斌. 安徽省会经济圈土地利用变化的碳排放效益[J]. 自然资源学报, 2012, 27(3):394-401.
|
| [32] |
杨武, 王贲, 项定先, 等. 武汉市能源消费碳排放因素分解与低碳发展研究[J]. 中国人口·资源与环境, 2018, 28(S1):13-16.
|
| [33] |
董捷, 魏旭华, 陈恩. 土地利用碳排放地域差异下减排责任分摊研究——以武汉城市圈为例[J]. 长江流域资源与环境, 2019, 28(4):872-882.
|
| [34] |
|
| [35] |
|
| [36] |
|
| [37] |
|
| [38] |
魏俊超, 梅志雄, 马君杰, 等. 广州市土地利用碳排放时空演变及影响因素[J]. 水土保持研究, 2024, 31(4):298-307.
|
/
| 〈 |
|
〉 |