
Spatiotemporal Characteristics and Formation Mechanism of Population Shrinkage in Zhejiang Province
Received date: 2024-10-23
Revised date: 2025-07-23
Online published: 2026-04-10
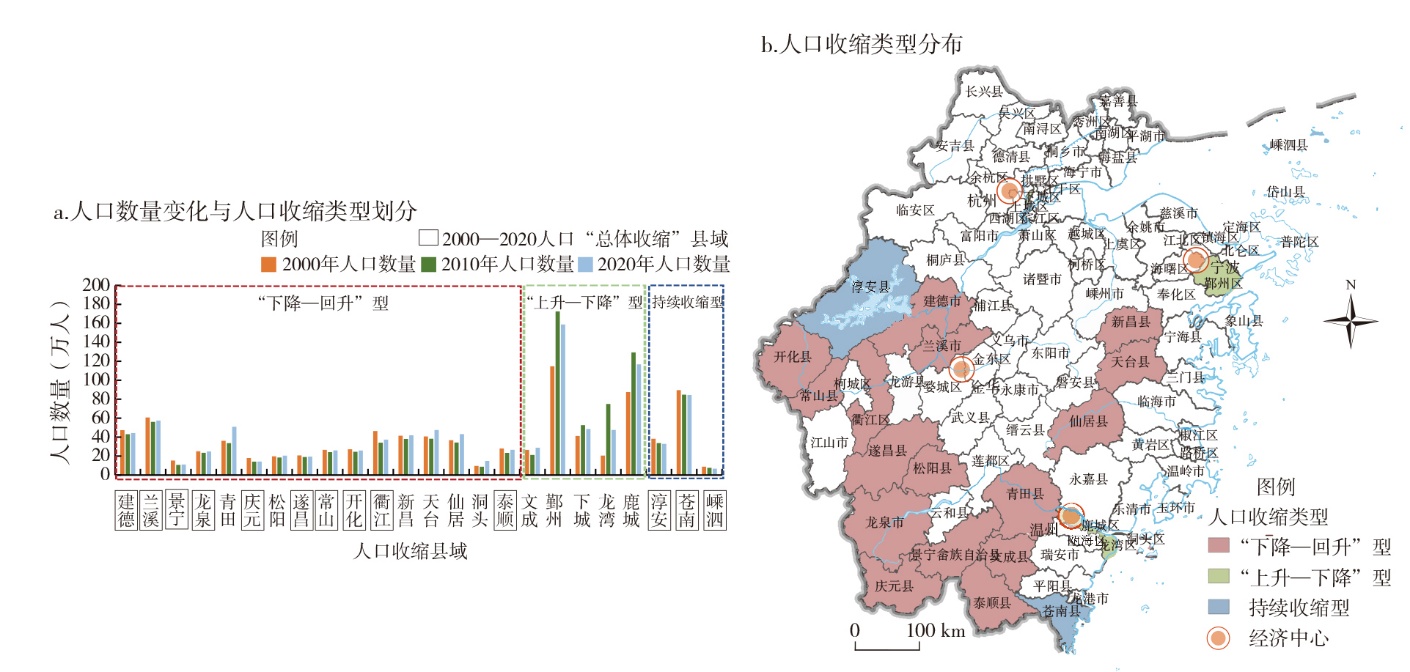
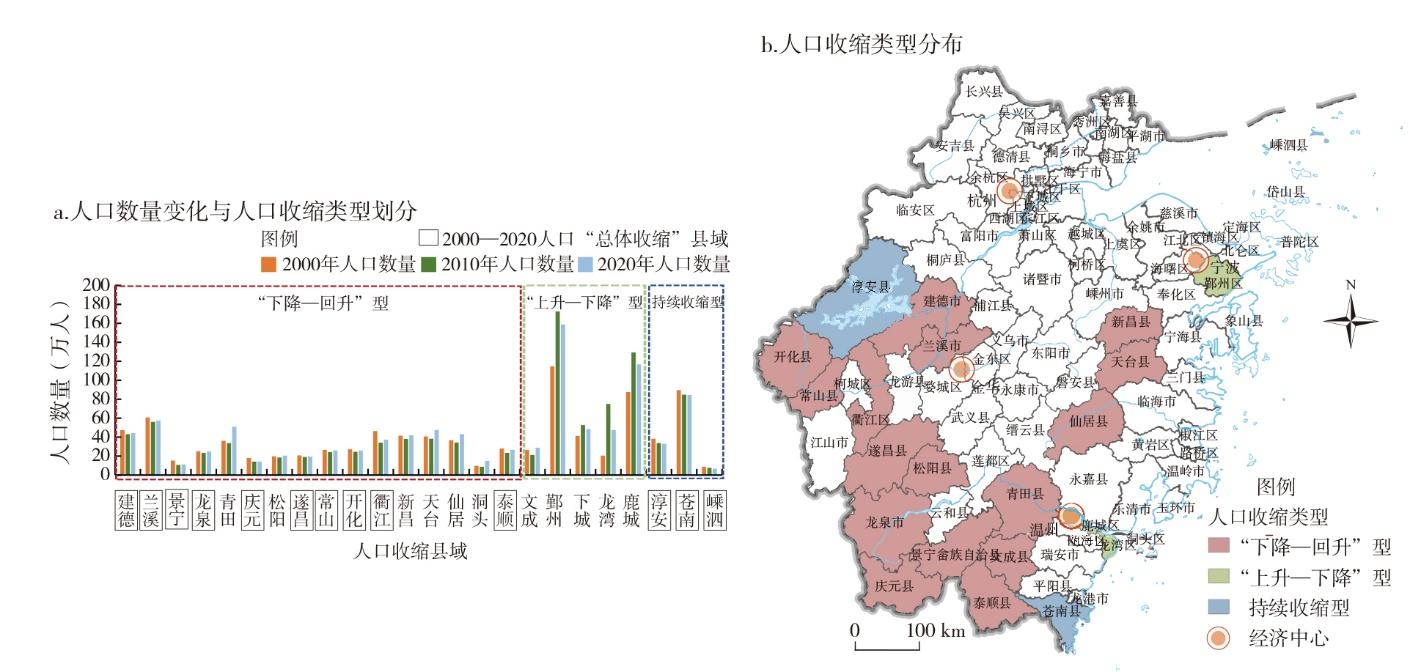
Based on the analysis of the 5th, 6th, and 7th National Population Census and the corresponding panel data, this research analyzes the spatial process and type characteristics of the population shrinkage in Zhejiang Province at the provincial, prefecture, and county levels. On the basis of the above, it applied the methods of multiple linear regression analysis and gravity model to identify the influence mechanism and potential problems of population shrinkage. It's found that: 1) From 2000 to 2020, the population shrinkage of Zhejiang Province increased significantly, the population shrinkage was not obvious at the prefecture level and the county level was the main spatial unit scale reflecting population shrinkage, with significant regional linkage characteristics. Economic, social, and environmental factors jointly constituted the "push force" at the county level and "pull force" at the regional center level that affect population shrinkage. 2) The types of population shrinkage of the counties were mainly categorized into two types: continuous shrinkage and fluctuating shrinkage. Fluctuating shrinkage can be divided into up-down type and down-up type. 3) The main causes of population shrinkage vary among different types of counties. The continuous shrinkage is caused by the superimposed effects of the long-term "push" of ecological protection. For counties with fluctuating population shrinkage, the combined effect of "push" and "pull" factors shows certain regional differences, and the stage characteristics of the industrial development of the counties themselves have an important influence on the fluctuation of population shrinkage. In the process of territorial space planning in developed regions, it is necessary to pay attention to the differentiated population shrinkage characteristics of counties and carry out targeted resource allocation. At the same time, the complementary deployment of county economy, ecological environment and land resources within the region should be carried out in order to realize the adaptive allocation of human and land resources.
LI Zijia , WANG Jiwu , WANG Chenhao . Spatiotemporal Characteristics and Formation Mechanism of Population Shrinkage in Zhejiang Province[J]. Economic geography, 2026 , 46(2) : 70 -79 . DOI: 10.15957/j.cnki.jjdl.2026.02.007
表1 数据类型及来源Tab.1 Type and source and data |
| 数据 | 类型 | 数据来源 | |
|---|---|---|---|
| 人口数据 | 人口数据 | 统计数据 | 2020年“五普”、2010年“六普”、2020年“七普” |
| 社会经济数据 | 社会经济 | 统计数据 | 浙江省、各市、各县域历年统计年鉴以及统计公报数据 |
| 用地数据 | 土地利用 | 栅格数据 | 自然资源部土地覆被数据CLCD |
| 建设用地 | 栅格数据 | 利用ArcGIS交集制表工具,从自然资源部土地覆被数据CLCD提取 | |
| DEM | 栅格数据 | 国家地球系统科学数据共享服务平台 | |
| 行政区划 | 矢量数据 | 自然资源部标准地图服务网站 |
注:根据国家统计局《总人口的数据来源和计算方法》规定,总人口基础数据的取得有人口普查、1%人口调查和人口变动情况抽样调查3个类型,为确保多尺度研究数据的精准性,本文选取“人口普查”类作为基础数据。人口普查是精确的全数调查,指在国家统一规定的时间内,按照统一方法、统一项目、统一普查表和统一标准时点,对全国人口普遍地、逐户逐人地进行的一次性调查登记。 |
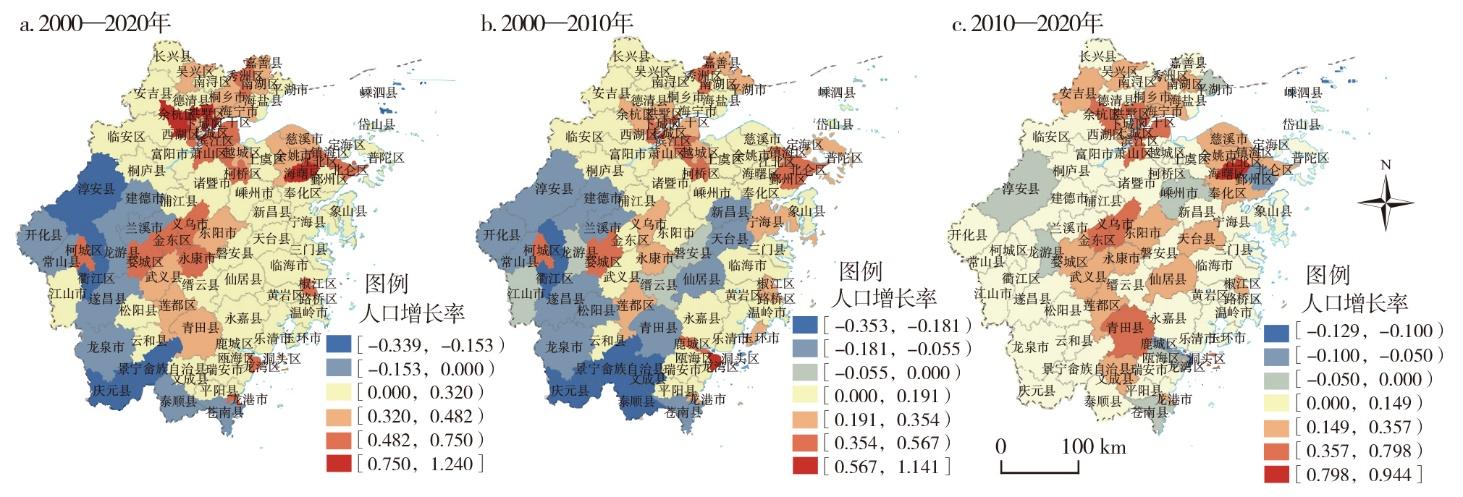
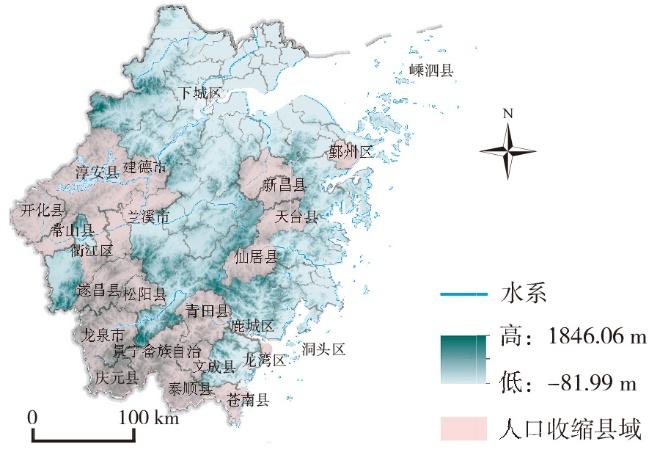
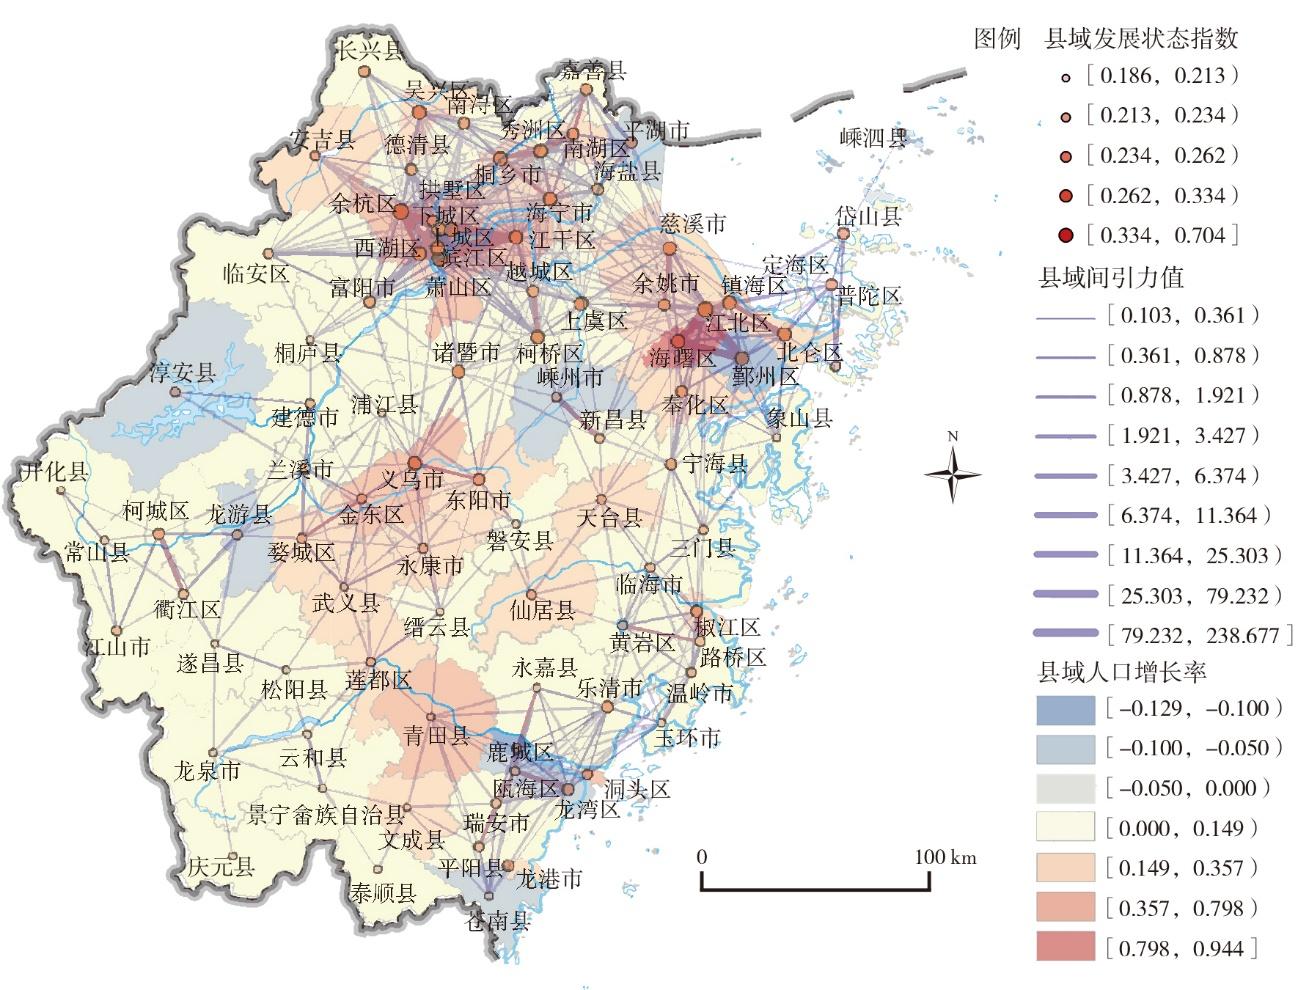
图3 浙江省人口收缩县域的分布与地形的关系Fig.3 Distribution of counties with population shrinkage in Zhejiang and its relationship with topography |
表2 浙江省人口重心的空间变化Tab.2 Change in spatial gravity center of population in Zhejiang Province |
| 起始人口空间重心 | 迁移起点 | 终点人口空间重心 | 迁移终点 | 迁移距离(km) | 迁移方向 | ||||||
|---|---|---|---|---|---|---|---|---|---|---|---|
| 经度(°) | 纬度(°) | 经度(°) | 纬度(°) | ||||||||
| 2000 | 120.491 | 29.707 | 2010 | 120.515 | 29.704 | 2.190251 | 向东 | ||||
| 2010 | 120.515 | 29.704 | 2020 | 120.519 | 29.738 | 3.586746 | 向北 | ||||
表3 人口收缩相关影响因素的多元线性回归分析Tab.3 Multiple linear regression analysis of influencing factors of urban population shrinkage |
| 要素指标维度 | 要素指标 | 非标准化系数 | 标准化系数 | t | p | 共线性诊断 | |||
|---|---|---|---|---|---|---|---|---|---|
| B | 标准误 | Beta | VIF | 容忍度 | |||||
| 常数 | 0.06048 | 0.084 | - | 0.718 | 0.482 | - | - | ||
| 经济 | 人均GDP增加值X1 | 0.02902 | 0.009 | 0.487 | 3.386 | 0.003** | 2.385 | 0.419 | |
| 第三产业比重增加值X2 | 0.89723 | 0.259 | 0.387 | 3.471 | 0.003** | 1.435 | 0.697 | ||
| 社会 | 平均受教育年限增加值X3 | -0.34729 | 0.071 | -0.591 | -4.907 | 0.000** | 1.671 | 0.598 | |
| 医疗卫生机构床位增加值X4 | -0.00004 | 0.000 | -0.519 | -3.577 | 0.002** | 2.424 | 0.412 | ||
| 环境 | 人均绿地面积增加值X5 | 0.00007 | 0.000 | 0.297 | 2.516 | 0.022* | 1.610 | 0.621 | |
注:*表示显著性水平p<0.05 ,**表示显著性水平p<0.01。表4同。 |
表4 波动收缩型县域人口收缩影响因素的多元线性回归分析Tab.4 Multiple linear regression analysis of factors influencing population shrinkage in fluctuating shrinking counties |
| 要素指标维度 | 要素指标 | 非标准化系数 | 标准化系数 | t | p | 共线性诊断 | |||
|---|---|---|---|---|---|---|---|---|---|
| B | 标准误 | Beta | VIF | 容忍度 | |||||
| 常数 | 0.06251 | 0.065 | - | 0.958 | 0.482 | - | - | ||
| 经济 | 第三产业比重增加值X2 | 0.48827 | 0.181 | 0.219 | 2.704 | 0.003** | 1.398 | 0.715 | |
| 社会 | 平均受教育年限增加值X3 | -0.38563 | 0.049 | -0.655 | -7.931 | 0.000** | 1.496 | 0.668 | |
| 社会生产生活服务人员增加值X6 | -0.00003 | 0 | -0.239 | -2.939 | 0.022* | 1.299 | 0.770 | ||
| 老龄人口比例增加值X7 | 3.09939 | 0.580 | 0.435 | 5.345 | 0.002** | 1.653 | 0.605 | ||
表5 县域经济、社会和环境发展状态指数及权重Tab.5 Index and weights of county-level economic, social and environmental development status |
| 指标维度 | 指标正负 | 指标 | 信息熵值e | 信息效用值d | 权重(%) |
|---|---|---|---|---|---|
| 经济 | + | GDP增加值(万元) | 0.771 | 0.229 | 20.311 |
| + | 第一产业比重增加值(%) | 0.951 | 0.049 | 4.334 | |
| + | 第二产业比重增加值(%) | 0.972 | 0.028 | 2.499 | |
| + | 第三产业比重增加值(%) | 0.951 | 0.049 | 4.354 | |
| 社会 | + | 医疗卫生机构床位增加值(个) | 0.830 | 0.170 | 15.085 |
| + | 每10万人口大学生人数增加值(人) | 0.941 | 0.059 | 5.219 | |
| - | 15岁及以上文盲人口数增加值(人) | 0.888 | 0.112 | 9.934 | |
| + | 平均受教育年限增加值(年) | 0.938 | 0.062 | 5.512 | |
| + | 人口数增加值(人) | 0.974 | 0.026 | 2.288 | |
| + | 劳动力人口比例增加值(%) | 0.953 | 0.047 | 4.198 | |
| - | 老龄人口比例增加值(%) | 0.957 | 0.043 | 3.788 | |
| 环境 | + | 人均绿地面积增加值(m2/人) | 0.977 | 0.023 | 2.001 |
| + | 人均住房面积增加值(m2/人) | 0.930 | 0.070 | 6.156 | |
| + | 建设用地面积增加值(m2/人) | 0.907 | 0.093 | 8.246 | |
| + | 城镇化率增加值(%) | 0.931 | 0.069 | 6.075 |
| [1] |
孙平军, 王柯文. 中国东北三省城市收缩的识别及其类型划分[J]. 地理学报, 2021, 76(6):1366-1379.
|
| [2] |
孙平军, 曹乃刚, 张可秋, 等. 收缩城市韧性:收缩效应诊断及其传导路径研究:来自中国东北的实证[J]. 地理研究, 2024, 43(5):1107-1125.
|
| [3] |
侯晓静, 喻忠磊, 李雨婷. 中国山区县域人口收缩的空间格局及其形成机制[J]. 地理研究, 2024, 43(5):1205-1224.
|
| [4] |
高喆, 饶晨, 高濮南, 等. 降维和聚类相结合的长江中游城市群收缩识别与特征研究[J]. 地理科学进展, 2025, 44(1):131-143.
|
| [5] |
罗宁, 孙平军, 曹乃刚, 等. 东北三省收缩城市的城镇化演化特征与作用机理研究[J]. 世界地理研究, 2024, 33(11):135-148.
|
| [6] |
贾文星, 张学良, 韩慧敏. 中国收缩型县域土地绿色利用效率的时空演进及收敛特征[J]. 资源科学, 2024, 46(2):294-307.
|
| [7] |
周臻, 陈浩, 王磊. 人口收缩型中小城市建设用地供应动态特征及分异[J]. 资源科学, 2024, 46(2):321-335.
|
| [8] |
李涛, 常欣悦, 陈泽豪, 等. 丘陵山区乡镇人口收缩格局及其影响因素[J]. 经济地理, 2025, 45(12):65-75.
|
| [9] |
王录仓, 屈艳琦. 基于双维视角的黄河上游地区人口收缩特征及其影响因素[J] 中国沙漠, 2025, 45(5):181-193.
|
| [10] |
吴康, 刘骁啸, 姚常成. 产业转型对中国资源型城市增长与收缩演变轨迹的影响机制[J]. 自然资源学报, 2023, 38(1):109-125.
|
| [11] |
|
| [12] |
罗耀, 方世明, 徐枫. 人口收缩背景下东北三省城镇化与生境质量协调发展研究——基于增长城市与收缩城市的对比[J]. 地理科学, 2025, 45(11):2468-2480.
|
| [13] |
杨贺, 薛东前, 宋永永. 中国资源型城市的收缩与转型关系研究[J]. 资源科学, 2025, 47(6):1248-1262.
|
| [14] |
吴康, 刘骁啸, 姚常成. 产业转型对中国资源型城市增长与收缩演变轨迹的影响机制[J]. 自然资源学报, 2023, 38(1):109-125.
|
| [15] |
|
| [16] |
|
| [17] |
|
| [18] |
|
| [19] |
|
| [20] |
牟玲利, 李和平, 彭恺. 山地村庄收缩趋势测度与精明收缩路径思考——以景宁畲族自治县沙湾片区为例[J]. 城市与区域规划研究, 2024, 16(2):176-195.
|
| [21] |
|
| [22] |
马雪松, 杨欣雨. 收缩型城市治理:政治逻辑、功能定位与路径选择[J]. 治理研究, 2025, 41(2):2,4-19,158.
|
| [23] |
卓贤, 王訸, 朱妮, 等. 总人口增长转折期的人口区域分布:现状、问题与对策[J]. 改革, 2025(2):119-131.
|
| [24] |
孙平军, 张可秋, 曹乃刚, 等. 东北区域性城市收缩的地理认知与治理逻辑[J]. 地理学报, 2024, 79(8):1918-1939.
|
| [25] |
|
| [26] |
|
| [27] |
杨卡. 京津冀区县人口收缩态势、归因及适应策略[J]. 河北工业大学学报(社会科学版), 2025, 17(2):1-10,40.
|
| [28] |
郑洁, 汪甜甜, 陈浩. 长江经济带人口收缩城市的识别与影响因素分析[J]. 华东经济管理, 2022, 36(8):13-25.
|
| [29] |
林思仪, 赵渺希, 王笑涵. 局部收缩背景下深圳都市圈企业更替格局及机制[J]. 资源科学, 2024, 46(2):262-278.
|
| [31] |
李郇, 吴康, 龙瀛. 局部收缩:后增长时代下的城市可持续发展争鸣[J]. 地理研究, 2017, 36(10):1997-2016.
|
| [32] |
黄鹤. 精明收缩:应对城市衰退的规划策略及其在美国的实践[J]. 城市与区域规划研究, 2017, 9(2):164-175.
|
| [33] |
Nitsche N. Fertility, Education,and Couple Dynamics:Three Essays on Childbearing Behavior in the United States and Germany[D]. New Haven: Yale University, 2014.
|
| [34] |
|
| [35] |
|
/
| 〈 |
|
〉 |