
Measuring the Development Level of Urban Life Insurance Industry and Analyzing the Driving Mechanism in China
Received date: 2023-09-13
Revised date: 2024-02-10
Online published: 2026-04-10
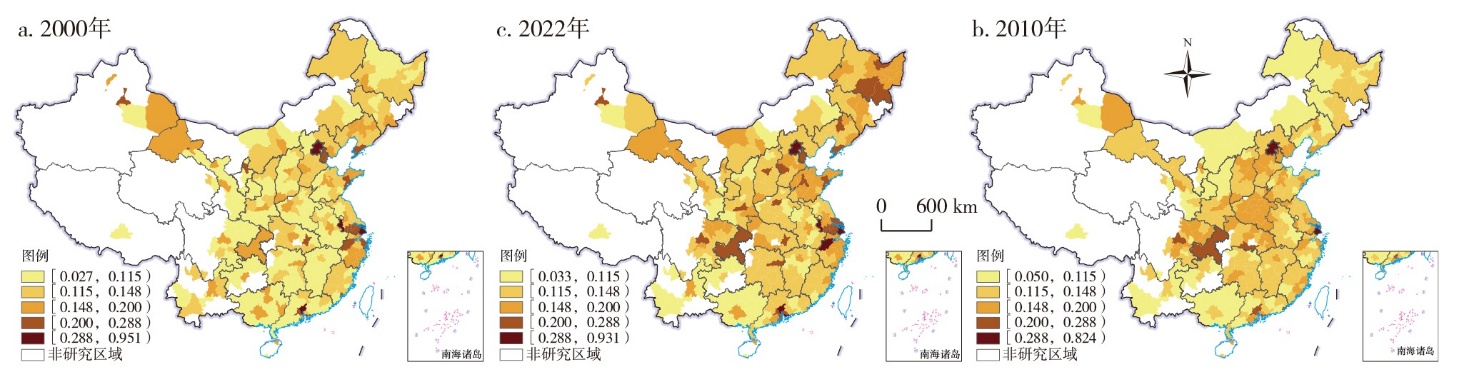
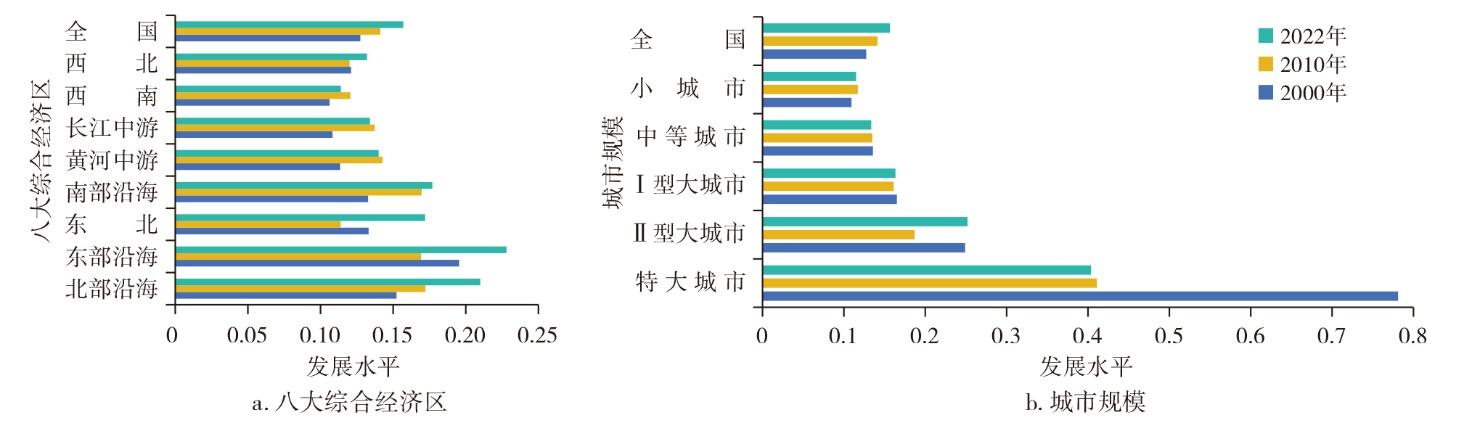
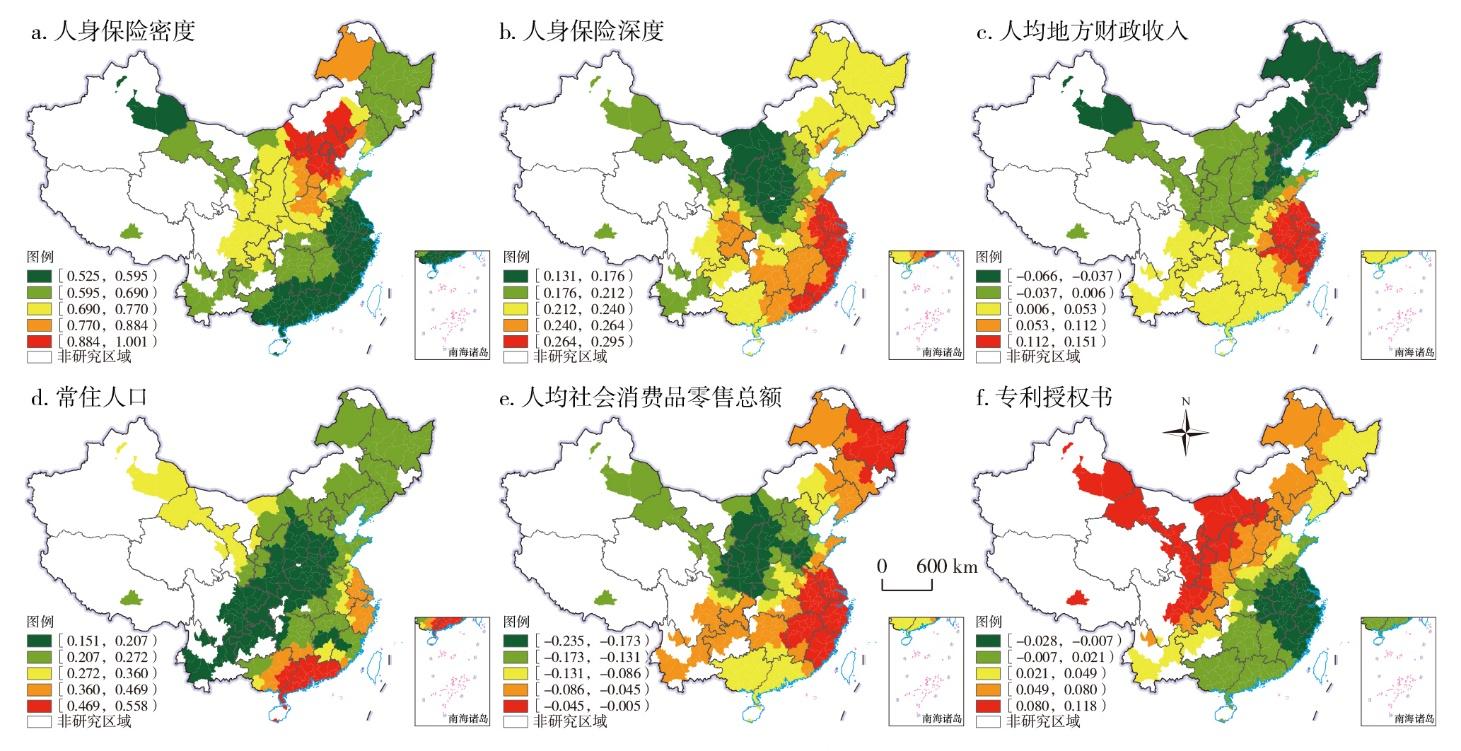
Using the Coefficient of variation method, Dagum Gini coefficient and the geographic detector, we assessed and measured the level of urban life insurance industry development in 289 cities above prefecture level in China in 2000, 2010, and 2022, analyzed their spatial-temporal differentiation and revealed their influencing factors and the spatial differences of action intensity. The results show that: 1) From 2000, the level of urban life insurance industry development is low but in a rising tendency and the level of urban life insurance industry is higher in eastern China than western China. The growth rate of urban life insurance industry development level presents a strong positive correlation between urban scale. 2) The spatial differences of life insurance industry development level presents a rising tendency, and the main reasons for the spatial differentiation are the inter-regional difference between eights economic regions and the scale gap between the cities of different scale. The greater the difference of city scale, the greater the difference of development level of life insurance. 3) The spatial differences of development level of life insurance industry is a result of multi-factor interaction, and the dominant factor are income from life insurance, density of life insurance,number of patents granted, depth of life insurance, per capita local fiscal revenue, per capita retail sales of consumer goods, resident population. We should adapt ourselves to the requirements of social and economic development, and take which implies differential development of multiple elements according to local conditions as the main strategic development direction in the future.
LI Xueting , WU Xiangli . Measuring the Development Level of Urban Life Insurance Industry and Analyzing the Driving Mechanism in China[J]. Economic geography, 2026 , 46(2) : 25 -35 . DOI: 10.15957/j.cnki.jjdl.2026.02.003
表1 不同规模城市人身保险发展水平Tab.1 The level of life insurance industry development at different city scale |
| 城市规模 | 2000年 | 2010年 | 2022年 | 年均增长率 (%) | |||||
|---|---|---|---|---|---|---|---|---|---|
| 数量(个) | 平均发展水平 | 数量(个) | 平均发展水平 | 数量(个) | 平均发展水平 | ||||
| 小城市 | 196 | 0.1093 | 124 | 0.1171 | 85 | 0.1150 | 0.23 | ||
| 中等城市 | 55 | 0.1357 | 98 | 0.1349 | 107 | 0.1336 | -0.07 | ||
| Ⅰ型大城市 | 31 | 0.1651 | 49 | 0.1611 | 66 | 0.1634 | -0.05 | ||
| Ⅱ型大城市 | 5 | 0.2490 | 10 | 0.1869 | 14 | 0.2519 | 0.05 | ||
| 特大城市 | 2 | 0.7811 | 8 | 0.4110 | 17 | 0.4037 | -2.95 | ||
表2 八大区人身保险发展水平基尼系数及差异来源贡献Tab.2 Dagum Gini coefficient and the source of spatial difference of the level of life insurance industry development in the eight comprehensive economic zones |
| 年份 | 总体基尼系数 | 区域内差异 | 贡献率(%) | ||||||||||
|---|---|---|---|---|---|---|---|---|---|---|---|---|---|
| 北部沿海 | 东部沿海 | 东北 | 南部沿海 | 黄河中游 | 长江中游 | 西南 | 西北 | 区域内 | 区域间 | 超变密度 | |||
| 2000 | 0.219 | 0.228 | 0.297 | 0.113 | 0.272 | 0.124 | 0.144 | 0.190 | 0.246 | 10.892 | 45.201 | 43.907 | |
| 2010 | 0.216 | 0.226 | 0.231 | 0.140 | 0.252 | 0.193 | 0.146 | 0.224 | 0.177 | 11.985 | 38.524 | 49.491 | |
| 2022 | 0.257 | 0.255 | 0.272 | 0.155 | 0.311 | 0.173 | 0.160 | 0.279 | 0.228 | 10.952 | 48.276 | 40.772 | |
表3 八大区人身保险发展水平区域间基尼系数Tab.3 Dagum Gini coefficient of the level of life insurance industry development between the eight comprehensive economic zones |
| 区域名称 | 2000 | 2010 | 2022 | 均值 |
|---|---|---|---|---|
| 北部沿海—东部沿海 | 0.2715 | 0.2288 | 0.2676 | 0.2560 |
| 东北—北部沿海 | 0.1720 | 0.2130 | 0.2091 | 0.1980 |
| 东北—东部沿海 | 0.2230 | 0.2095 | 0.2230 | 0.2185 |
| 南部沿海—北部沿海 | 0.2561 | 0.2454 | 0.2911 | 0.2642 |
| 南部沿海—东部沿海 | 0.3023 | 0.2481 | 0.3031 | 0.2845 |
| 南部沿海—东北 | 0.2002 | 0.2280 | 0.2388 | 0.2223 |
| 黄河中游—北部沿海 | 0.1828 | 0.2116 | 0.2342 | 0.2095 |
| 黄河中游—东部沿海 | 0.2386 | 0.2119 | 0.2521 | 0.2342 |
| 黄河中游—东北 | 0.1277 | 0.1939 | 0.1784 | 0.1667 |
| 黄河中游—南部沿海 | 0.1972 | 0.2266 | 0.2455 | 0.2231 |
| 长江中游—北部沿海 | 0.1962 | 0.1834 | 0.2320 | 0.2039 |
| 长江中游—东部沿海 | 0.2519 | 0.1813 | 0.2489 | 0.2274 |
| 长江中游—东北 | 0.1439 | 0.1535 | 0.1765 | 0.1580 |
| 长江中游—南部沿海 | 0.2064 | 0.1996 | 0.2382 | 0.2147 |
| 长江中游—黄河中游 | 0.1357 | 0.1745 | 0.1682 | 0.1595 |
| 西南—北部沿海 | 0.2257 | 0.2436 | 0.3124 | 0.2606 |
| 西南—东部沿海 | 0.2814 | 0.2428 | 0.3313 | 0.2852 |
| 西南—东北 | 0.1720 | 0.1941 | 0.2529 | 0.2063 |
| 西南—南部沿海 | 0.2341 | 0.2543 | 0.3156 | 0.2680 |
| 西南—黄河中游 | 0.1600 | 0.2189 | 0.2340 | 0.2043 |
| 西南—长江中游 | 0.1671 | 0.1894 | 0.2240 | 0.1935 |
| 西北—北部沿海 | 0.2459 | 0.2226 | 0.2677 | 0.2454 |
| 西北—东部沿海 | 0.3020 | 0.2224 | 0.2897 | 0.2714 |
| 西北—东北 | 0.1790 | 0.1582 | 0.1934 | 0.1769 |
| 西北—南部沿海 | 0.2644 | 0.2413 | 0.2893 | 0.2650 |
| 西北—黄河中游 | 0.1748 | 0.1968 | 0.1933 | 0.1883 |
| 西北—长江中游 | 0.1851 | 0.1588 | 0.1838 | 0.1759 |
| 西北—西南 | 0.2147 | 0.2099 | 0.2680 | 0.2309 |
表4 不同规模等级城市的人身保险发展水平基尼系数及差异来源贡献Tab.4 Dagum Gini coefficient and the source of spatial difference of the level of life insurance industry development based on different city scale |
| 年份 | 总体基尼系数 | 规模内差异 | 贡献率(%) | |||||||
|---|---|---|---|---|---|---|---|---|---|---|
| 小城市 | 中等城市 | Ⅰ型大城市 | Ⅱ型大城市 | 特大城市 | 规模内 | 规模间 | 超变密度 | |||
| 2000 | 0.219 | 0.169 | 0.142 | 0.161 | 0.167 | 0.109 | 34.139 | 52.984 | 12.877 | |
| 2010 | 0.216 | 0.179 | 0.139 | 0.182 | 0.136 | 0.273 | 22.832 | 54.296 | 22.871 | |
| 2022 | 0.257 | 0.215 | 0.142 | 0.170 | 0.125 | 0.206 | 16.242 | 67.987 | 15.771 | |
表5 不同规模等级城市组间的人身保险发展水平基尼系数Tab.5 Dagum Gini coefficient of the level of life insurance industry development between different city scales |
| 年份 | 规模组间差异 | |||||||||
|---|---|---|---|---|---|---|---|---|---|---|
| 小城市—中等 | 小城市—Ⅰ型 | Ⅰ型—中等 | 小城市—Ⅱ型 | Ⅱ型—中等 | Ⅰ型—Ⅱ型 | 特大—小城市 | 特大—中等 | 特大—Ⅰ型 | 特大—Ⅱ型 | |
| 2000 | 0.1706 | 0.1894 | 0.1614 | 0.1859 | 0.1756 | 0.1827 | 0.2136 | 0.2521 | 0.2909 | 0.3410 |
| 2010 | 0.1662 | 0.1988 | 0.1624 | 0.1911 | 0.1497 | 0.1771 | 0.2641 | 0.2309 | 0.2780 | 0.3027 |
| 2022 | 0.1780 | 0.2145 | 0.1640 | 0.2645 | 0.1869 | 0.1904 | 0.3651 | 0.2793 | 0.2840 | 0.2163 |
表6 人身保险发展水平驱动因素指标体系Tab.6 Index system of impact factors of the level of life insurance industry development |
| 目标层 | 要素层 | 指标层 |
|---|---|---|
| 内部驱动因素 | 发展规模 | 人身保险保费收入(X1) |
| 发展趋势 | 人身保险保费增长率(X2) | |
| 发展水平 | 人身保险密度(X3) | |
| 人身保险深度(X4) | ||
| 外部驱动因素 | 经济基础 | 人均GDP(X5) |
| 政府调控 | 人均地方财政收入(X6) | |
| 金融发展 | 金融业从业人员占比(X7) | |
| 产业结构 | 第三产业占比(X8) | |
| 人口数量 | 常住人口(X9) | |
| 外部驱动因素 | 人口结构 | 城镇化率(X10) |
| 教育水平 | 人均教育支出(X11) | |
| 消费水平 | 人均社会消费品零售总额(X12) | |
| 金融素养 | 人均储蓄存款余额(X13) | |
| 文化水平 | 每万人大学生数(X14) | |
| 医疗资源 | 每万人医院床位数(X15) | |
| 区域创新 | 专利授权数(X16) | |
| 对外开放 | 人均实际利用外资(X17) | |
| 科技支撑 | 科技支出占比(X18) |
表7 人身保险发展水平驱动因子解释力测度Tab.7 Impact of elements to the level of life insurance industry development |
| 因子 | q00 | q10 | q22 | 因子 | q00 | q10 | q22 | |
|---|---|---|---|---|---|---|---|---|
| X1 | 0.749*** | 0.629*** | 0.735*** | X10 | 0.345*** | 0.109*** | 0.391*** | |
| X2 | 0.230*** | 0.134*** | 0.109*** | X11 | 0.502*** | 0.043** | 0.172*** | |
| X3 | 0.803*** | 0.446*** | 0.756*** | X12 | 0.395*** | 0.341*** | 0.356*** | |
| X4 | 0.593*** | 0.481*** | 0.322*** | X13 | 0.016 | 0.276*** | 0.399*** | |
| X5 | 0.399*** | 0.093*** | 0.257*** | X14 | 0.220*** | 0.082*** | 0.259*** | |
| X6 | 0.433*** | 0.526*** | 0.260*** | X15 | 0.115*** | 0.037** | 0.036* | |
| X7 | 0.057*** | 0.049* | 0.014 | X16 | 0.757*** | 0.374*** | 0.611*** | |
| X8 | 0.193*** | 0.074*** | 0.283*** | X17 | 0.204*** | 0.138*** | 0.119*** | |
| X9 | 0.454*** | 0.210*** | 0.515*** | X18 | 0.034 | 0.293*** | 0.240*** |
注:q00、q10、q19分别代表2000、2010和2022年的地理探测器q值;***、**、*分别表示q值的显著性水平为0.00、0.05、0.10。 |
表8 2022年人身保险发展水平地域分异的交互探测结果Tab.8 Interactive detection results of regional differentiation of the level of life insurance industry development in 2022 |
| 驱动因子 | X1 | X2 | X3 | X4 | X5 | X6 | X7 | X8 | X9 | X10 | X11 | X12 | X13 | X14 | X15 | X16 | X17 | X18 |
|---|---|---|---|---|---|---|---|---|---|---|---|---|---|---|---|---|---|---|
| X1 | 0.735 | |||||||||||||||||
| X2 | 0.754 | 0.109 | ||||||||||||||||
| X3 | 0.850 | 0.788 | 0.756 | |||||||||||||||
| X4 | 0.854 | 0.557 | 0.843 | 0.322 | ||||||||||||||
| X5 | 0.750 | 0.325 | 0.772 | 0.826 | 0.257 | |||||||||||||
| X6 | 0.760 | 0.370 | 0.790 | 0.826 | 0.361 | 0.260 | ||||||||||||
| X7 | 0.750 | 0.138 | 0.772 | 0.389 | 0.294 | 0.373 | 0.014 | |||||||||||
| X8 | 0.756 | 0.480 | 0.825 | 0.636 | 0.596 | 0.586 | 0.462 | 0.283 | ||||||||||
| X9 | 0.744 | 0.565 | 0.838 | 0.759 | 0.633 | 0.657 | 0.550 | 0.589 | 0.515 | |||||||||
| X10 | 0.792 | 0.472 | 0.773 | 0.605 | 0.478 | 0.489 | 0.436 | 0.559 | 0.717 | 0.391 | ||||||||
| X11 | 0.750 | 0.374 | 0.802 | 0.719 | 0.465 | 0.351 | 0.334 | 0.528 | 0.618 | 0.542 | 0.172 | |||||||
| X12 | 0.754 | 0.428 | 0.782 | 0.853 | 0.462 | 0.541 | 0.428 | 0.595 | 0.640 | 0.630 | 0.568 | 0.356 | ||||||
| X13 | 0.777 | 0.473 | 0.775 | 0.633 | 0.533 | 0.494 | 0.418 | 0.602 | 0.691 | 0.606 | 0.474 | 0.625 | 0.399 | |||||
| X14 | 0.763 | 0.374 | 0.781 | 0.602 | 0.431 | 0.531 | 0.313 | 0.413 | 0.632 | 0.453 | 0.595 | 0.487 | 0.546 | 0.259 | ||||
| X15 | 0.757 | 0.176 | 0.777 | 0.377 | 0.358 | 0.517 | 0.072 | 0.393 | 0.582 | 0.423 | 0.420 | 0.437 | 0.442 | 0.337 | 0.036 | |||
| X16 | 0.765 | 0.631 | 0.812 | 0.850 | 0.621 | 0.624 | 0.702 | 0.663 | 0.673 | 0.678 | 0.687 | 0.628 | 0.739 | 0.685 | 0.705 | 0.611 | ||
| X17 | 0.740 | 0.224 | 0.769 | 0.622 | 0.376 | 0.460 | 0.164 | 0.452 | 0.563 | 0.517 | 0.293 | 0.507 | 0.485 | 0.353 | 0.223 | 0.627 | 0.119 | |
| X18 | 0.760 | 0.318 | 0.762 | 0.646 | 0.405 | 0.473 | 0.280 | 0.442 | 0.598 | 0.537 | 0.474 | 0.505 | 0.541 | 0.406 | 0.307 | 0.621 | 0.308 | 0.240 |
注:灰色底纹表示交互探测结果为非线性增强型,无底纹则表示探测结果为双因子增强型。 |
| [1] |
袁成, 李茹. 中国人口老龄化对人身保险消费的影响研究[J]. 中央财经大学学报, 2017(9):22-31.
|
| [2] |
曹凤岐. 发展现代人身保险,深化保险业供给侧改革[J]. 金融论坛, 2018, 23(3):3-5.
|
| [3] |
中共中央国务院关于深化医疗保障制度改革的意见[J]. 中国医疗保险, 2021(2):63.
|
| [4] |
宋昌耀, 李国平, 李沅曦. 中国保险业的空间分异及其经济绩效——基于地级以上城市的分析[J]. 保险研究, 2019(9):30-43.
|
| [5] |
李春燕. 我国区域寿险发展水平差异分析[J]. 统计与决策, 2016(2):101-104.
|
| [6] |
李春燕. 我国保险发展的空间非均衡及极化研究——基于1998-2010年产险与寿险的对比分析[J]. 财经论丛, 2013(2):64-70.
|
| [7] |
肖明迁, 张晓丽, 王岩. 京津冀城市群人身保险的发展水平、空间演化及影响因素[J]. 保险研究, 2015(4):93-106.
|
| [8] |
田小文, 郑理, 徐雷. 中国保险业发展的时空分异特征及动态演变[J]. 经济地理, 2021, 41(9):135-144.
|
| [9] |
李恩龙, 杨永春, 史坤博, 等. 省域视角下中国保险业市场的时空特征[J]. 经济地理, 2017, 37(5):116-124.
|
| [10] |
蒋丽君. 我国寿险市场区域差异的空间经济计量分析[J]. 财经论丛, 2012(1):69-75.
|
| [11] |
张伟, 郭金龙, 张许颖, 等. 中国保险业发展的影响因素及地区差异分析[J]. 数量经济技术经济研究, 2005(7):108-117.
|
| [12] |
|
| [13] |
|
| [14] |
|
| [15] |
赵雪婕, 丁少群. 城镇化对我国人身保险需求的影响机理及实证分析[J]. 上海保险, 2021(4):36-40.
|
| [16] |
张冲, 万新月. 我国城镇化、 老龄化对人身保险市场发展的影响研究[J]. 西部经济管理论坛, 2019, 30(5):37-42,65.
|
| [17] |
滕丽杰. 人口结构变迁对寿险消费影响研究——基于省域面板数据实证检验[J]. 价格理论与实践, 2021(8):141-144.
|
| [18] |
王志文, 段洁新. 我国人身保险发展的宏观影响因素分析[J]. 浙江金融, 2013(10):59-62.
|
| [19] |
孙武军, 林惠敏. 金融排斥、 社会互动和家庭资产配置[J]. 中央财经大学学报, 2018(3):21-38.
|
| [20] |
山娜. 我国健康保险业发展现状研究综述[J]. 中国卫生经济, 2019, 38(7):26-29.
|
| [21] |
锁凌燕, 完颜瑞云, 陈滔. 我国商业健康保险地区发展失衡现状及原因研究[J]. 保险研究, 2015(1):42-53.
|
| [22] |
张冀. 基于VEC模型的人身保险与消费的实证分析[J]. 经济评论, 2010(6):122-129,142.
|
| [23] |
庞楷. 保险业对经济增长影响的实证分析——基于修正的Solow模型[J]. 保险研究, 2009(7):31-36.
|
| [24] |
高侯平, 王欢, 沈沛龙. 中国保险与经济高质量发展耦合协调关系研究[J]. 科学决策, 2023(4):40-55.
|
| [25] |
|
| [26] |
|
| [27] |
王韧, 农通理, 张双双. 基于空间杜宾模型的保险业发展时空格局研究[J]. 保险研究, 2020(10):48-64.
|
| [28] |
姜晓艳, 吴相利, 张守忠. 中国人口城镇化与保险业协调发展测度与驱动机制[J]. 经济地理, 2022, 42(6):22-32.
|
| [29] |
|
| [30] |
王劲峰, 徐成东. 地理探测器:原理与展望[J]. 地理学报, 2017, 72(1):116-134.
|
| [31] |
|
| [32] |
|
| [33] |
尹晔, 许闲, 王颖俐. 我国区域普惠保险水平测度及影响因素分析[J]. 保险研究, 2020(10):34-47.
|
| [34] |
万广圣, 施毓凤, 濮桂萍, 等. 长三角地区健康保险发展差异及其影响因素分析[J]. 中国卫生经济, 2020, 39(7):38-42.
|
| [35] |
陈卫. 中国的低生育率与三孩政策——基于第七次全国人口普查数据的分析[J]. 人口与经济, 2021(5):25-35.
|
| [36] |
罗静, 陈洁, 蒋亮, 等. 中国众创空间的空间演化及影响因素研究[J]. 华中师范大学学报(自然科学版), 2021, 55(5):741-754.
|
/
| 〈 |
|
〉 |
