
Spatiotemporal Characteristics and Driving Factors of Commercial Trade and Circulation Industry in Changsha-Zhuzhou-Xiangtan Metropolitan Area
Received date: 2025-06-06
Revised date: 2026-01-19
Online published: 2026-04-10
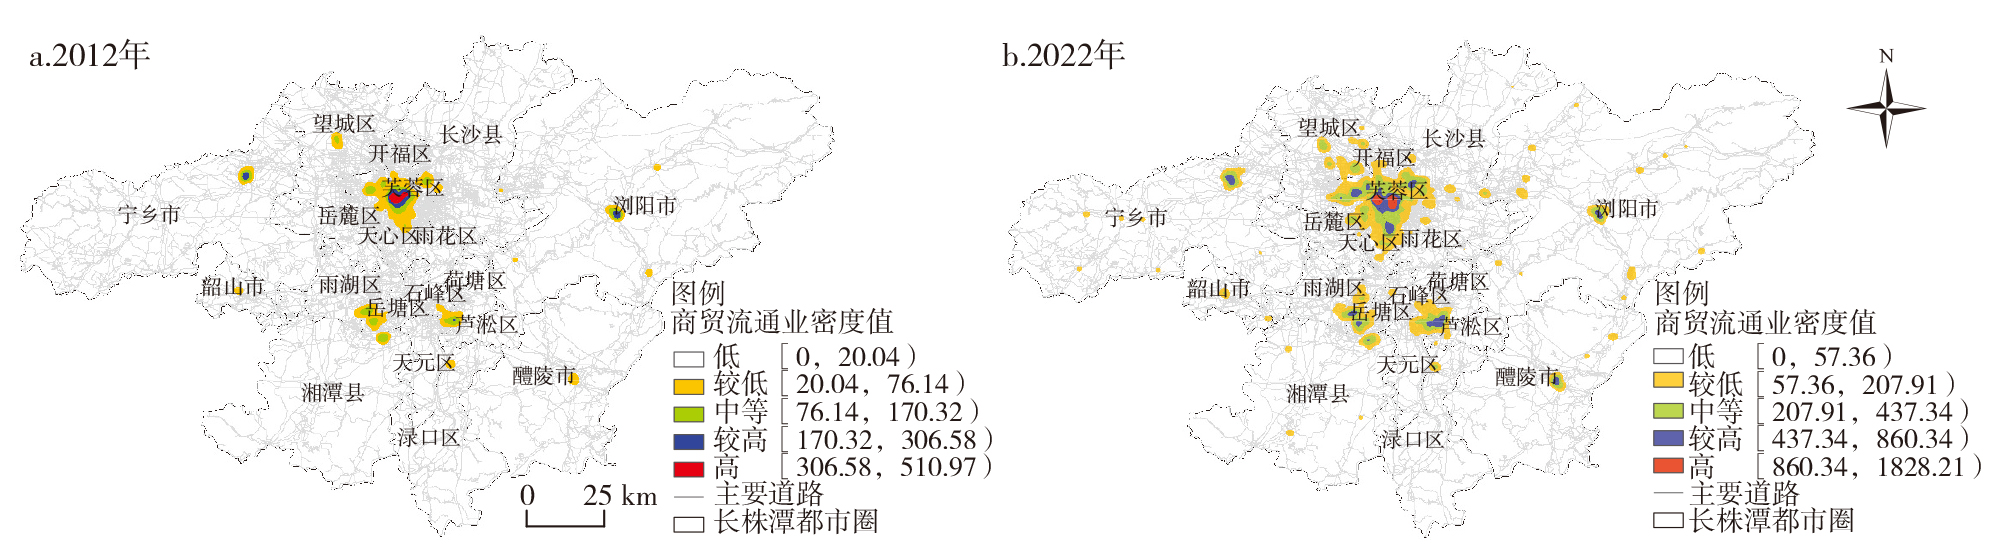
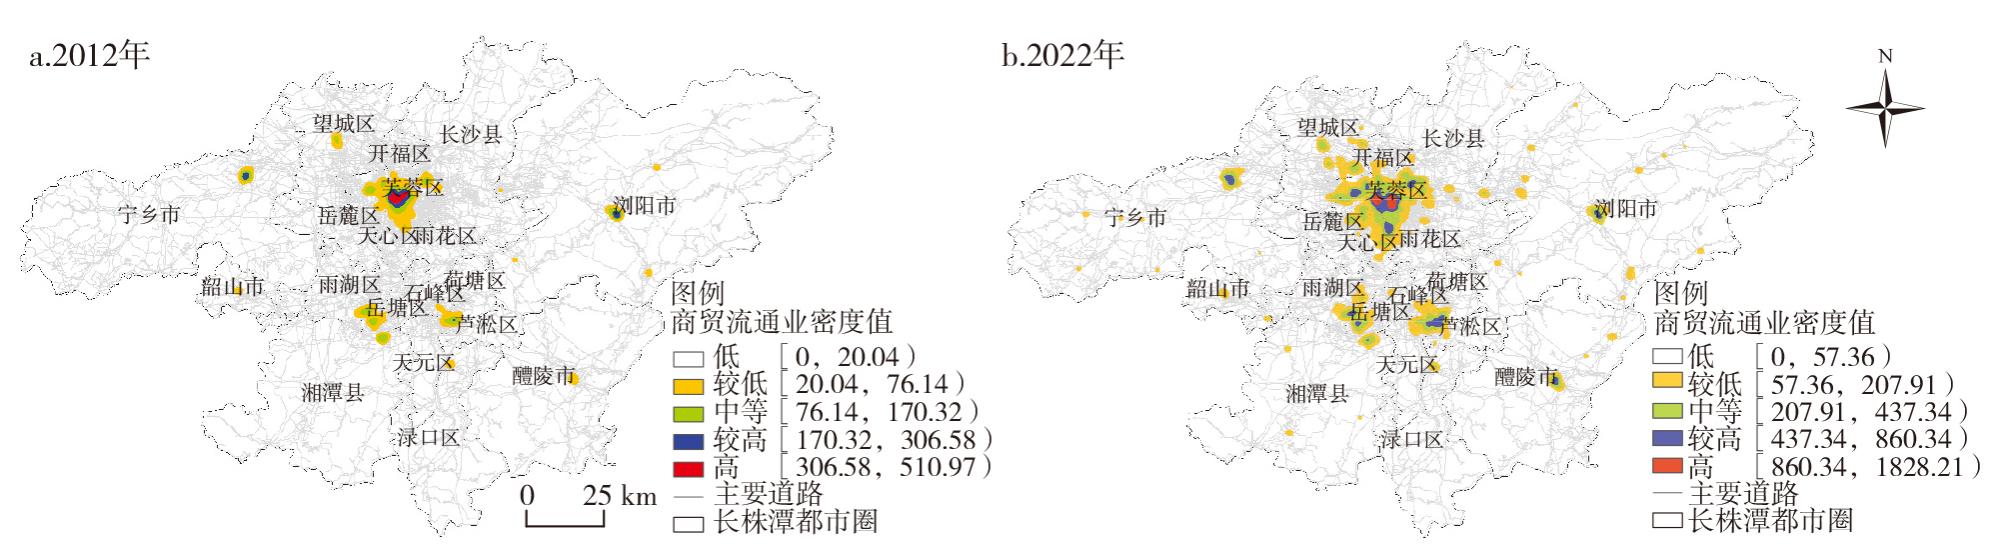
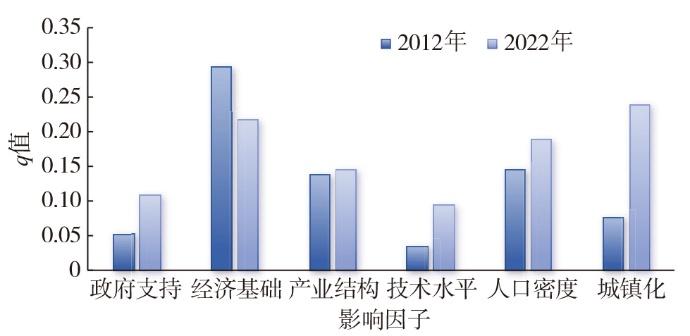
Based on the POI data and socio-economic data from the Changsha-Zhuzhou-Xiangtan Metropolitan Area, this study comprehensively employs methods such as kernel density analysis, standard deviation ellipse, two-way fixed effects model, and geographical detectors to investigate the spatiotemporal characteristics and driving mechanisms of the commercial trade and circulation industry in 2012-2022. The research reveals that: 1) The spatial development model of the commercial trade and circulation industry in the Changsha-Zhuzhou-Xiangtan Metropolitan Area has undergone a profound transformation from a core-periphery structure to a functional-network structure, which is specifically manifested as follows: the spatial pattern has evolved from a single-core concentric structure to a multi-center symbiotic network structure, with sustained expansion along the northwest-southeast axis, forming a multi-level system of "core leadership-secondary center support-node diffusion. 2) The sub-sectors of the commercial trade and circulation industry exhibit differentiated evolutionary characteristics, with spatial correlations shifting from homogeneous agglomeration to functional synergy. Specifically, the wholesale and retail industry spreads along the development axis and tends toward multi-directional equilibrium, the catering industry agglomerates toward the core area with a contracting spatial scope, while the accommodation industry shows a decentralized distribution. Spatial correlations among industries have diverged, with the wholesale and retail industry maintaining strong synergy with the catering industry, whereas the correlation with the accommodation industry has significantly weakened. 3) The spatiotemporal evolution is driven by the synergy between government and market forces. The government guides the transformation of the spatial structure through institutional supply, while market-driven factors shift from the supply-side economic foundation to the demand-side urbanization, forming an interactive supply-demand composite mechanism. Therefore, it is recommended to further optimize the functional layout of the metropolitan area, strengthen regional and industrial linkages, and improve market-government collaboration to promote the quality and efficiency enhancement of the commercial trade and circulation industry and achieve coordination development of the metropolitan area as a whole.
YIN Yuanyuan , LIU Zhang . Spatiotemporal Characteristics and Driving Factors of Commercial Trade and Circulation Industry in Changsha-Zhuzhou-Xiangtan Metropolitan Area[J]. Economic geography, 2026 , 46(2) : 154 -163 . DOI: 10.15957/j.cnki.jjdl.2026.02.015
表1 POI数据分类Tab.1 POI data classification |
| 大类 | 子类 |
|---|---|
| 购物服务 | 百货商场、便利店、超市、购物中心、家电数码、家居建材、免税店、商业街、市场、文体用品、其他 |
| 餐饮服务 | 中餐厅、外国餐厅、甜品店、饮品店、快餐厅、咖啡厅、茶艺馆、糕饼店 |
| 住宿服务 | 宾馆酒店、经济型连锁酒店、旅馆招待所、青年旅舍、三星级宾馆、四星级宾馆、五星级宾馆 |
表2 2012和2022年长株潭都市圈商贸流通业网点数量及增速Tab.2 Number and growth rate of commercial and trade circulation industry outlets in Changsha-Zhuzhou-Xiangtan Metropolitan Area in 2012 and 2022 |
| 行业 | 2012年(个) | 2022年(个) | 增长倍数 | 年均增速(%) |
|---|---|---|---|---|
| 总计 | 40697 | 285938 | 7.03 | 21.97 |
| 批发零售业 | 24462 | 178878 | 7.31 | 22.37 |
| 餐饮业 | 12310 | 89945 | 7.30 | 22.29 |
| 住宿业 | 3925 | 17115 | 4.36 | 16.68 |
表3 2012和2022年长株潭都市圈商贸流通业标准差椭圆分析参数Tab.3 Parameter results of standard deviation elliptic analysis of the commercial and trade circulation industry in Changsha-Zhuzhou-Xiangtan Metropolitan Area in 2012 and 202 |
| 年份 | 中心坐标 | 长轴(km) | 短轴(km) | 方位角(°) | 面积(km2) | 扁率 |
|---|---|---|---|---|---|---|
| 2012 | (113.02°E,28.10°N) | 39.57 | 28.54 | 95.20 | 3547.55 | 0.28 |
| 2022 | (113.03°E,28.09°N) | 69.92 | 31.09 | 109.29 | 3836.60 | 0.56 |
表4 2012和2022年长株潭都市圈商贸流通业各细分行业标准差椭圆分析参数Tab.4 Parameter results of standard deviation elliptic analysis of commercial and trade circulation industry segments in Changsha-Zhuzhou-Xiangtan Metropolitan Area in 2012 and 2022 |
| 年份 | 类型 | 中心坐标 | 长轴(km) | 短轴(km) | 方位角(°) | 面积(km2) | 扁率 |
|---|---|---|---|---|---|---|---|
| 2012 | 批发零售业 | (113.03°E,28.11°N) | 40.61 | 27.97 | 95.09 | 3567.92 | 0.31 |
| 餐饮业 | (113.00°E,28.09°N) | 36.69 | 29.42 | 90.38 | 3391.16 | 0.20 | |
| 住宿业 | (113.02°E,28.10°N) | 41.66 | 28.16 | 105.47 | 3686.94 | 0.32 | |
| 2022 | 批发零售业 | (113.03°E,28.08°N) | 41.97 | 32.69 | 107.13 | 4310.43 | 0.22 |
| 餐饮业 | (113.01°E,28.13°N) | 34.53 | 27.74 | 118.94 | 3009.70 | 0.20 | |
| 住宿业 | (113.02°E,28.10°N) | 35.76 | 26.54 | 94.60 | 2981.20 | 0.26 |
表5 2012和2022年长株潭都市圈商贸流通业各细分行业空间相关性矩阵Tab.5 Spatial correlation matrix of commercial and trade circulation industry segments in Changsha-Zhuzhou-Xiangtan Metropolitan Area in 2012 and 2022 |
| 年份 | 批发零售业 | 餐饮业 | 住宿业 | |
|---|---|---|---|---|
| 2012 | 批发零售业 | 1.000 | ||
| 餐饮业 | 0.936*** | 1.000 | ||
| 住宿业 | 0.911*** | 0.953*** | 1.000 | |
| 2022 | 批发零售业 | 1.000 | ||
| 餐饮业 | 0.931*** | 1.000 | ||
| 住宿业 | 0.709*** | 0.825*** | 1.000 |
注:***、**、*分别表示在1% 、5%、10%水平上显著。 |
表6 变量说明Tab.6 Explanation of variables |
| 序号 | 变量 | 指标 | 方向 |
|---|---|---|---|
| Y1 | 商贸流通业发展规模 | 社会消费品零售总额 | / |
| Y2 | 商贸流通业空间布局 | 核密度值 | / |
| X1 | 政府支持 | 政府公共财政支出/GDP | 正向 |
| X2 | 经济基础 | 人均GDP | 正向 |
| X3 | 产业结构 | 第三产业产值/第二产业产值 | 正向 |
| X4 | 技术水平 | 普通中等学校在校学生数 | 正向 |
| X5 | 人口密度 | 总人口/面积 | 正向 |
| X6 | 城镇化 | 城镇人口/总人口 | 正向 |
表7 基准回归结果Tab.7 Benchmark regression results |
| (1) | (2) | (3) | (4) | (5) | (6) | (7) | |
|---|---|---|---|---|---|---|---|
| Y1 | Y1 | Y1 | Y1 | Y1 | Y1 | Y1 | |
| X1 | 0.244*** | 0.183*** | |||||
| X2 | 0.215 | 0.838*** | |||||
| X3 | 0.514***(10.815) | 0.469***(11.069) | |||||
| X4 | 0.450*** | 0.0812 | |||||
| X5 | 0.292** | 0.639*** | |||||
| X6 | 1.007*** | 0.532*** | |||||
| Constant | 4.246*** | 4.272*** | 4.955*** | 4.201*** | 2.659*** | 0.474 | -3.807*** |
注:***、**、*分别表示在1% 、5%、10%水平上显著,为节省版面标准误不显示。表8同。 |
表8 稳健性检验结果Tab.8 Robustness test results |
| 模型 | (1) | (2) | (3) | (4) | (5) |
|---|---|---|---|---|---|
| 基准回归结果 | 固定效应模型 | 随机效应模型 | 剔除公共卫生事件影响 | 缩尾处理 | |
| X1 | 0.183*** | 0.138** | 0.105 | 0.177*** | 0.162** |
| X2 | 0.838*** | 0.618*** | 0.661*** | 0.707*** | 0.794*** |
| X3 | 0.469*** | 0.391*** | 0.420*** | 0.460*** | 0.472*** |
| X4 | 0.0812 | 0.135** | 0.474*** | 0.152* | 0.118 |
| X5 | 0.639*** | 0.435*** | 0.0782 | 0.564*** | 0.581*** |
| X6 | 0.532*** | 0.551*** | 0.425*** | 0.474*** | 0.578*** |
| Constant | -3.807*** | -2.018** | 0.641 | -2.858* | -3.507** |
表9 长株潭都市圈商贸流通业空间布局因子交互探测结果Tab.9 Results of interactive detection of spatial distribution factors of the commercial and trade circulation industry in the Changsha-Zhuzhou-Xiangtan Metropolitan Area |
| 交互因子 | 2012年 | 2022年 | |||
|---|---|---|---|---|---|
| 交互结果 | 交互作用类别 | 交互结果 | 交互作用类别 | ||
| 政府支持∩经济基础 | 0.1475 | 单因子非线性减弱 | 0.1872 | 单因子非线性减弱 | |
| 政府支持∩产业结构 | 0.1426 | 双因子增强 | 0.1888 | 双因子增强 | |
| 政府支持∩技术水平 | 0.0683 | 双因子增强 | 0.1064 | 双因子增强 | |
| 政府支持∩人口密度 | 0.1471 | 双因子增强 | 0.1897 | 双因子增强 | |
| 政府支持∩城镇化 | 0.0856 | 双因子增强 | 0.1688 | 单因子非线性减弱 | |
| 产业结构∩经济基础 | 0.1472 | 单因子非线性减弱 | 0.1869 | 单因子非线性减弱 | |
| 产业结构∩技术水平 | 0.1444 | 双因子增强 | 0.1617 | 双因子增强 | |
| 产业结构∩人口密度 | 0.1474 | 双因子增强 | 0.1895 | 双因子增强 | |
| 产业结构∩城镇化 | 0.1474 | 双因子增强 | 0.1840 | 单因子非线性减弱 | |
| 经济基础∩技术水平 | 0.1463 | 单因子非线性减弱 | 0.1727 | 单因子非线性减弱 | |
| 经济基础∩人口密度 | 0.1472 | 单因子非线性减弱 | 0.1898 | 单因子非线性减弱 | |
| 经济基础∩城镇化 | 0.1476 | 单因子非线性减弱 | 0.1739 | 单因子非线性减弱 | |
| 技术水平∩城镇化 | 0.1475 | 双因子增强 | 0.1823 | 单因子非线性减弱 | |
| 人口密度∩技术水平 | 0.1471 | 双因子增强 | 0.1897 | 双因子增强 | |
| 人口密度∩城镇化 | 0.1472 | 双因子增强 | 0.1895 | 单因子非线性减弱 | |
| [1] |
肖金成. 关于新发展阶段都市圈理论与规划的思考[J]. 人民论坛·学术前沿, 2021(4):4-9,75.
|
| [2] |
杨守德, 张天义. 流通产业集聚对新型城镇化影响的门限效应——基于全国26个都市圈面板数据的分析[J]. 当代经济研究, 2022(10):101-115.
|
| [3] |
张伟. 都市圈的概念、特征及其规划探讨[J]. 城市规划, 2003(6):47-50.
|
| [4] |
|
| [5] |
张婷麟, 孙斌栋. 关于当前我国都市圈规划空间范围划定的探讨[J]. 城市规划学刊, 2023(4):104-109.
|
| [6] |
韦伟, 赵光瑞. 日本都市圈模式研究综述[J]. 现代日本经济, 2005(2):40-45.
|
| [7] |
|
| [8] |
|
| [9] |
|
| [10] |
刘涛, 刘嘉杰, 曹广忠. 都市圈的概念内涵、演化机制与政策意义[J]. 城市发展研究, 2024, 31(3):1-8.
|
| [11] |
张超, 王君慧, 姚永玲. 通勤成本、 地方品质竞争与都市圈空间结构演化[J]. 首都经济贸易大学学报, 2022, 24(5):58-72.
|
| [12] |
姚士谋. 我国城市群的特征、类型与空间布局[J]. 城市问题, 1992(1):10-15,66.
|
| [13] |
张京祥, 胡航军. 新发展环境下的都市圈发展、规划与治理创新[J]. 经济地理, 2023, 43(1):17-25.
|
| [14] |
袁满, 汤鄂南, 单卓然, 等. 成熟型与发展型都市圈产业空间组织比较研究——以上海大都市圈和武汉都市圈为例[J]. 长江流域资源与环境, 2025, 34(6):1236-1250.
|
| [15] |
郑文升, 周颖, 王晓芳, 等. “层级—流”结合作用下现代都市圈空间演化机理——以武汉都市圈为例[J]. 经济地理, 2024, 44(7):56-67.
|
| [16] |
柳思维. 优化我国流通产业空间结构促进消费潜力释放的思考[J]. 湖南社会科学, 2019(3):90-95.
|
| [17] |
王靓, 罗雯婷, 李亚娟. 城市零售业热点区演变特征及驱动机制研究——以武汉市为例[J]. 世界地理研究, 2021, 30(6):1265-1274.
|
| [18] |
|
| [19] |
|
| [20] |
|
| [21] |
朱政, 朱翔. 基于空间模拟的都市圈旅游景区综合交通可达性分析——以长株潭都市圈为例[J]. 旅游学刊, 2024, 39(1):130-146.
|
| [22] |
张昊. 流通产业数据统计的现状、问题及改进建议[J]. 中国流通经济, 2014, 28(9):28-33.
|
| [23] |
司增绰, 苗建军. 商贸流通业的产业特性和产业地位:苏、浙、鲁、粤的比较——基于投入产出模型的实证研究[J]. 产业经济评论, 2011, 10(3):129-158.
|
| [24] |
黄国雄. 论流通产业是基础产业[J]. 财贸经济, 2005(4):61-65,97.
|
| [25] |
王晓东, 谢莉娟. 社会再生产中的流通职能与劳动价值论[J]. 中国社会科学, 2020(6):72-93,206.
|
| [26] |
司增绰. 关联特征演化、产业链网构建与流通业创新发展[M]. 北京: 经济科学出版社, 2023.
|
| [27] |
张家旗, 刘晏男, 宋斌玢. 基于POI数据的郑州市主城区生活服务业空间分布特征研究[J]. 世界地理研究, 2022, 31(2):399-409.
|
| [28] |
|
| [29] |
任宗哲. 统筹城乡商贸流通中的政府职能及其转变[J]. 西北大学学报(哲学社会科学版), 2011, 41(3):5-7.
|
| [30] |
杨向阳, 徐从才, 汪洁. 流通业高质量发展的现实基础、理论阐释与动力机制[J]. 求是学刊, 2025, 52(1):78-87.
|
| [31] |
杨海丽, 罗越月, 向能, 等. 数字技术驱动流通业高质量发展的动态空间效应研究[J]. 宏观经济研究, 2023(3):59-76,116.
|
| [32] |
高爽. 区域流通业发展水平与人口集聚空间耦合协调性分析[J]. 经济问题探索, 2020(3):100-106.
|
| [33] |
孙敬水, 章迪平. 流通产业结构变动影响因素探析[J]. 现代财经(天津财经大学学报), 2010, 30(6):69-75.
|
| [34] |
|
| [35] |
杨水根, 王露. 湖南省武陵山片区县域流通产业发展的演化特征及影响因素[J]. 经济地理, 2022, 42(1):127-134,175.
|
/
| 〈 |
|
〉 |