
Impact of Population Aging on Urban Green Technology Innovation in the Yangtze River Delta
Received date: 2023-10-19
Revised date: 2024-04-11
Online published: 2026-02-12
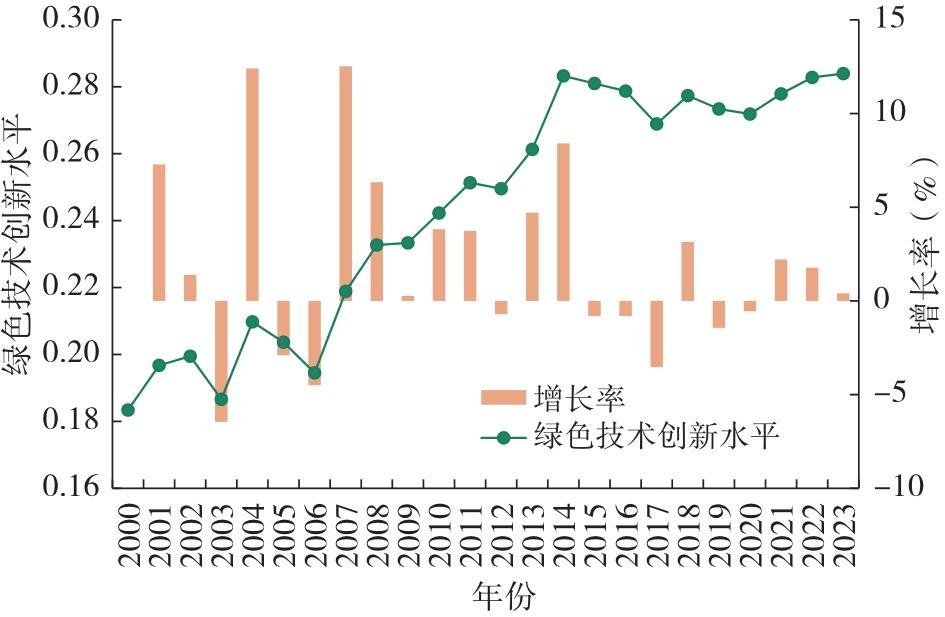
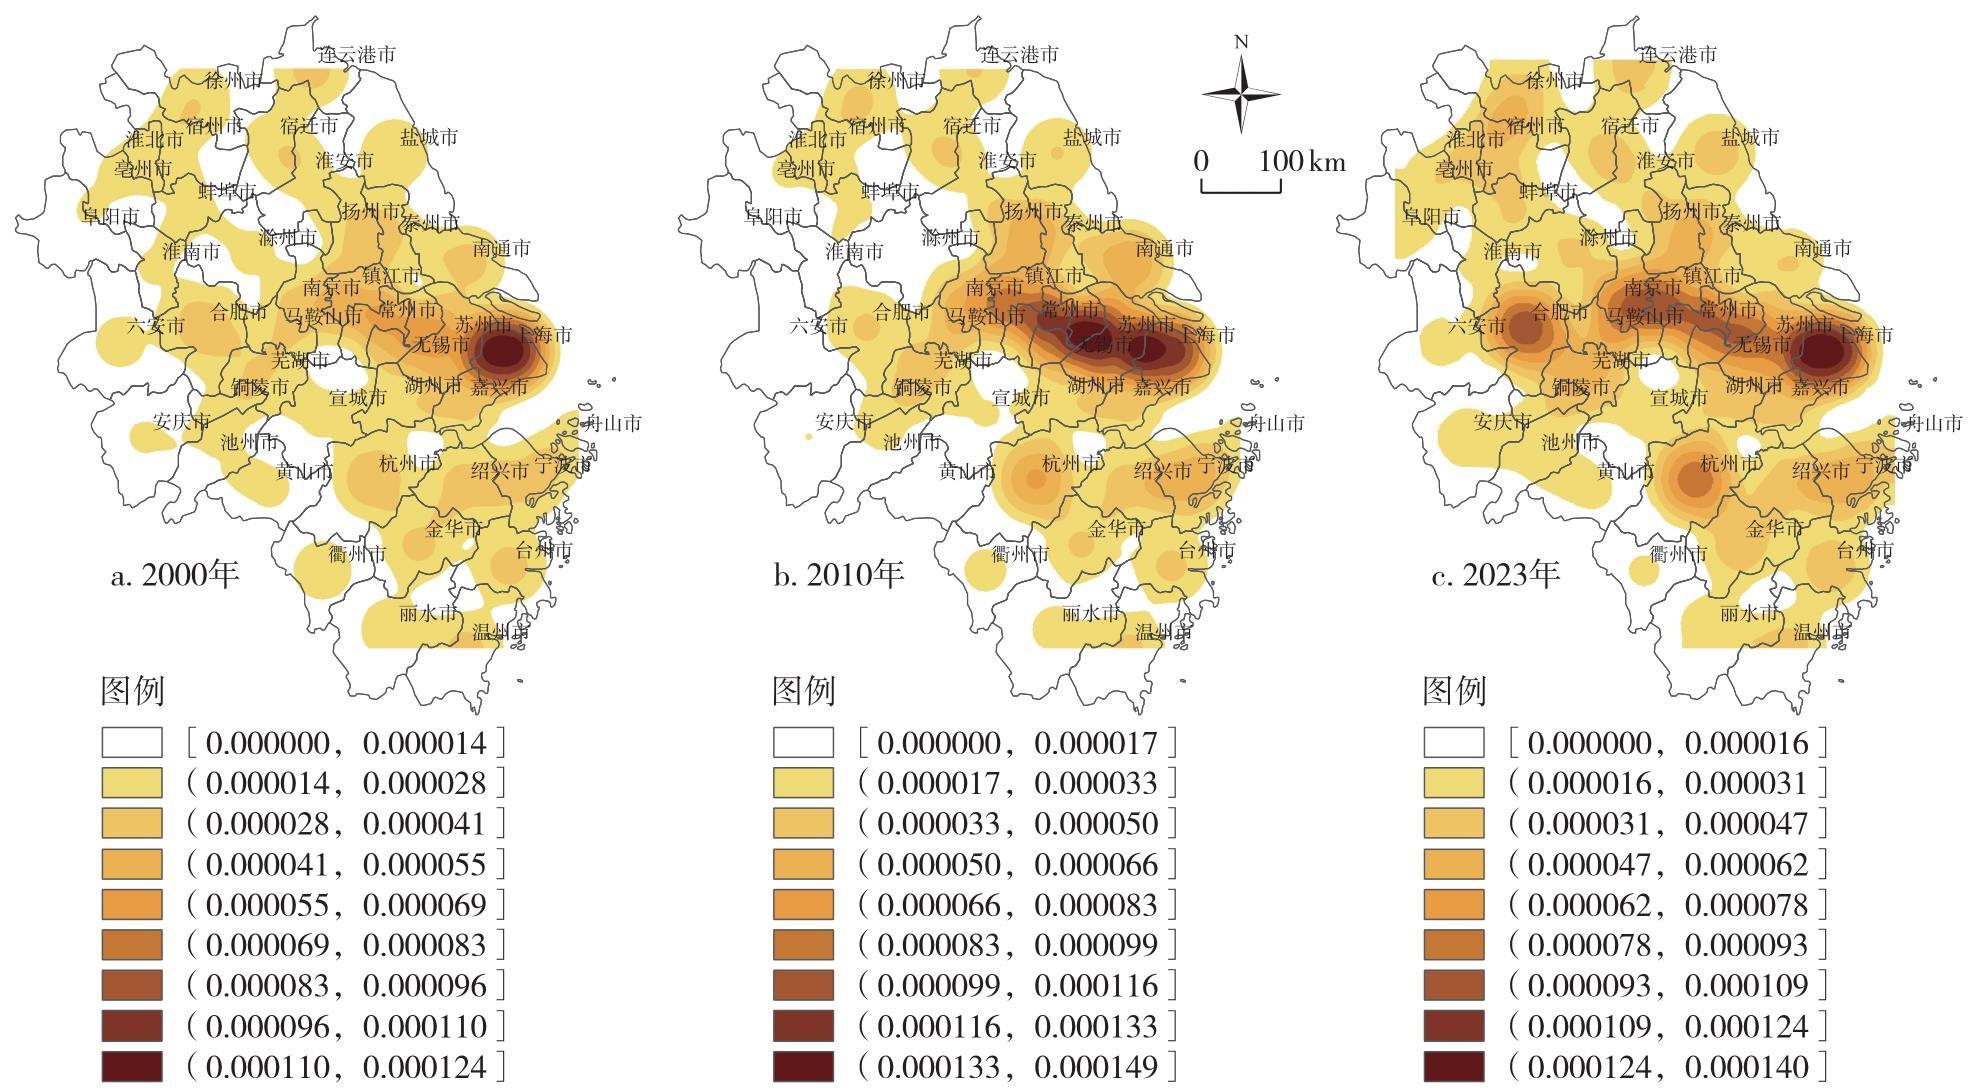
Based on the panel data of 41 cities in the Yangtze River Delta region from 2000 to 2023, this paper constructs the evaluation index system of green technology innovation level, and uses the spatial kernel density estimation method to analyze the spatiotemporal evolution pattern of urban green technology innovation. Based on the above, it discusses the impact of population aging on urban green technology innovation and its mechanisms by combining the panel fixed effect model and the mediation effect model, and reveals the spatial effect and spatiotemporal heterogeneity of population aging on urban green technology innovation using the spatial panel model. The results show that: 1) The overall level of urban green technology innovation in the Yangtze River Delta region is generally on the rise, and its spatial distribution gradually shifts from polarization to a spatial equilibrium pattern. 2) Aging at the apex has a significant negative effect on urban green technology innovation, while the aging from the base has a significant positive effect on urban green technology innovation. 3) The human capital effects of both aging at the apex and aging from the base are significant, and the human capital effect is an important way for population aging to affect urban green technology innovation. 4) Spatial analysis shows that aging at the apex has a "local-neighborhood" spatial spillover effect, which has an incentive effect on green technology innovation in spatially adjacent cities. 5) Heterogeneity analysis shows that the impact of population aging on urban green technology innovation is more significant in cities with low-level green innovation, and its spatial spillover effect is more significant in cities with high-level green innovation. Moreover, the spatial impact of population aging on urban green technology innovation has a long-term characteristic, but this impact is gradually weakening.

DENG Shicheng , WU Yuming . Impact of Population Aging on Urban Green Technology Innovation in the Yangtze River Delta[J]. Economic geography, 2026 , 46(1) : 86 -97 . DOI: 10.15957/j.cnki.jjdl.2026.01.009
表1 区域绿色技术创新水平评价指标体系Tab.1 Evaluation index system for regional green technology innovation level |
| 目标层 | 一级指标 | 二级指标 | 三级指标 | 单位 |
|---|---|---|---|---|
| 绿 色 技 术 创 新 水 平 | 创新环境 | 经济发展 | 人均GDP | 元 |
| 环境规制 | 政府工作报告环保词频 | % | ||
| 创新资源 | 人力要素 | R&D人员全时当量 | 万人 | |
| 劳动生产率(GDP/就业人数) | 元/人 | |||
| 资本要素 | R&D经费内部支出 | 万元 | ||
| R&D经费内部支出占GDP比重 | % | |||
| 资源要素 | 工业用电量 | 万kW·h | ||
| 规模以上工业单位增加值能耗 | t标准煤/万元 | |||
| 创新效益 | 技术效益 | 专利申请量 | 项 | |
| 专利授权量 | 项 | |||
| 环境效益 | 工业SO2排放量 | t | ||
| 工业废水排放量 | 万t | |||
| 工业烟(粉)尘排放量 | t | |||
| 工业固体废物综合利用率 | % | |||
| 创新制度 | 人才培育 | 财政教育支出占地方财政支出的比重 | % | |
| 资金支持 | 财政科技支出占地方财政支出的比重 | % |
表2 2023年长三角地区各城市的绿色技术创新水平Tab.2 Green technology innovation level of cities in the Yangtze River Delta region in 2023 |
| 城市 | 绿色技术 创新水平 | 排名 | 城市 | 绿色技术 创新水平 | 排名 |
|---|---|---|---|---|---|
| 上海 | 0.9572 | 1 | 蚌埠 | 0.2343 | 22 |
| 合肥 | 0.7409 | 2 | 南通 | 0.2262 | 23 |
| 杭州 | 0.6303 | 3 | 泰州 | 0.2261 | 24 |
| 南京 | 0.5836 | 4 | 宿州 | 0.2185 | 25 |
| 苏州 | 0.4606 | 5 | 丽水 | 0.2098 | 26 |
| 宁波 | 0.4055 | 6 | 宿迁 | 0.2006 | 27 |
| 无锡 | 0.3609 | 7 | 马鞍山 | 0.1969 | 28 |
| 常州 | 0.3436 | 8 | 淮安 | 0.1879 | 29 |
| 芜湖 | 0.3081 | 9 | 安庆 | 0.1772 | 30 |
| 金华 | 0.3023 | 10 | 亳州 | 0.1729 | 31 |
| 台州 | 0.3003 | 11 | 阜阳 | 0.1684 | 32 |
| 绍兴 | 0.2963 | 12 | 舟山 | 0.1661 | 33 |
| 嘉兴 | 0.2894 | 13 | 宣城 | 0.1559 | 34 |
| 徐州 | 0.2854 | 14 | 铜陵 | 0.1555 | 35 |
| 温州 | 0.2837 | 15 | 六安 | 0.1452 | 36 |
| 盐城 | 0.2801 | 16 | 池州 | 0.1423 | 37 |
| 镇江 | 0.2772 | 17 | 黄山 | 0.1382 | 38 |
| 连云港 | 0.2732 | 18 | 淮北 | 0.1308 | 39 |
| 扬州 | 0.2672 | 19 | 淮南 | 0.1308 | 40 |
| 湖州 | 0.2485 | 20 | 衢州 | 0.1212 | 41 |
| 滁州 | 0.2421 | 21 |
表3 人口老龄化影响绿色技术创新的基准回归结果Tab.3 Benchmark regression results of the impact of population aging on the green technology innovation |
| 变量 | (1) | (2) | (3) | (4) |
|---|---|---|---|---|
| lnold | -0.3251*** (0.0918) | -0.3165*** (0.0896) | ||
| lndep | -0.2620*** (0.0363) | -0.2540*** (0.0270) | ||
| lnind | -0.1304** (0.0550) | -0.1171*** (0.0212) | ||
| lnope | 0.0057 (0.0193) | 0.0076** (0.0030) | ||
| lnurb | 0.0199** (0.0092) | 0.0161** (0.0065) | ||
| Cons | -2.4565*** (0.1829) | -2.5795*** (0.2128) | -1.8815*** (0.0588) | -1.9370*** (0.1402) |
| 城市效应 | Yes | Yes | Yes | Yes |
| 时间效应 | Yes | Yes | Yes | Yes |
| R2 | 0.6561 | 0.6701 | 0.6436 | 0.6671 |
| N | 984 | 984 | 984 | 984 |
表4 人力资本中介效应的估计结果Tab.4 Estimation results of the mediating effect of human capital |
| 变量 | (1)lnhum | (2)lntec | (3)lnhum | (4)lntec |
|---|---|---|---|---|
| lnold | -0.2793*** (0.0787) | -0.2565*** (0.0328) | ||
| lndep | -0.2109*** (0.0445) | -0.2101** (0.0827) | ||
| lnhum | 0.2148** (0.0836) | 0.2081*** (0.0337) | ||
| Cons | 1.0640*** (0.2127) | -2.5638*** (0.1032) | 1.3177*** (0.1075) | -1.9263*** (0.0579) |
| R2 | 0.6243 | 0.6941 | 0.6333 | 0.6682 |
| N | 984 | 984 | 984 | 984 |
表5 空间面板模型的估计结果Tab.5 Estimation results of spatial panel model |
| 变量 | (1) 地理矩阵 | (2) 经济矩阵 | (3) 复合矩阵 | (4) 地理矩阵 | (5) 经济矩阵 | (6) 复合矩阵 |
|---|---|---|---|---|---|---|
| W·lntec | 0.8956***(0.0732) | 0.1612**(0.0783) | 0.2430***(0.0546) | 0.8992***(0.0732) | 0.0945**(0.0397) | 0.2284***(0.0557) |
| lnold | -0.2219***(0.0456) | -0.3714***(0.0411) | -0.3653***(0.0416) | |||
| lndep | -0.0099(0.0236) | -0.0672**(0.0284) | -0.0542***(0.0187) | |||
| W·lnold | 0.7741*(0.4096) | 0.0527(0.0994) | 0.0550**(0.0233) | |||
| W·lndep | -0.8279(0.8363) | -0.0761(0.0732) | -0.0832(0.0730) | |||
| 直接效应 | -0.3653***(0.0427) | -0.0569**(0.0238) | ||||
| 间接效应 | 0.0449**(0.0189) | -0.1203(0.0889) | ||||
| 总效应 | -0.3204***(0.1034) | -0.1772*(0.0959) | ||||
| R2 | 0.5354 | 0.5111 | 0.5816 | 0.4225 | 0.4249 | 0.5037 |
| Log-likelihood | 727.9697 | 676.5779 | 788.7600 | 719.0152 | 641.9989 | 754.2459 |
| N | 984 | 984 | 984 | 984 | 984 | 984 |
| LR-SLM | 26.3900*** | 51.5900*** | 60.2100*** | 19.7600*** | 39.2800*** | 50.0600*** |
| LR-SEM | 19.4400*** | 53.6100*** | 63.8500*** | 15.8100*** | 41.0800*** | 52.8600*** |
表6 空间异质性的估计结果Tab.6 Estimation results of spatial heterogeneity |
| 变量 | lnold | lndep | |||
|---|---|---|---|---|---|
| (1) 高水平 | (2) 低水平 | (3) 高水平 | (4) 低水平 | ||
| 直接效应 | -0.2168 (0.6376) | -0.1283*** (0.0361) | -0.2626 (0.2918) | -0.0438** (0.0192) | |
| 间接效应 | -0.1076** (0.0472) | 0.0469 (0.0309) | 0.1024*** (0.0323) | -0.0174 (0.0171) | |
| 总效应 | -0.3244** (0.1582) | -0.0814** (0.0401) | -0.1602* (0.0926) | -0.0612 (0.0901) | |
| R2 | 0.5161 | 0.5179 | 0.7170 | 0.5158 | |
| N | 456 | 528 | 456 | 528 | |
注:囿于篇幅,仅报告空间效应的分解结果。表7同。 |
表7 动态异质性的估计结果Tab.7 Estimation results of dynamic heterogeneity |
| 变量 | lnold | lndep | |||
|---|---|---|---|---|---|
| (1) 2000—2010 | (2) 2011—2023 | (3) 2000—2010 | (4) 2011—2023 | ||
| 直接效应 | -0.2422*** (0.0767) | -0.1351** (0.0559) | -0.0766** (0.0339) | -0.0532** (0.0213) | |
| 间接效应 | -0.1638 (0.2446) | 0.0413*** (0.0158) | 0.0371 (0.1197) | -0.0181 (0.1738) | |
| 总效应 | -0.4059** (0.1933) | -0.0938 (0.0589) | -0.0395* (0.0206) | -0.0713 (0.1150) | |
| R2 | 0.4255 | 0.4047 | 0.4058 | 0.4283 | |
| N | 451 | 533 | 451 | 533 | |
| [1] |
|
| [2] |
|
| [3] |
张韬, 席玉梅. 环境保护税对企业绿色技术创新影响分析——基于沪深A股上市公司数据[J]. 贵州社会科学, 2025,(8):113-123.
|
| [4] |
杜运伟, 李思雨. 数据要素赋能城市绿色创新的机制与效应研究——来自国家级大数据综合试验区的证据[J]. 审计与经济研究, 2025, 40(5):106-117.
|
| [5] |
|
| [6] |
邓世成, 吴玉鸣. 低碳城市试点政策对中国资源型城市绿色转型发展的影响[J]. 中国人口·资源与环境, 2024, 34(6):65-79.
|
| [7] |
方磊, 张雪薇. 科技金融生态对绿色技术创新影响的空间效应——基于东部五大城市群面板数据的实证分析[J]. 经济地理, 2023, 43(2):147-154.
|
| [8] |
王丹丹, 马志强, 许玲燕. 政府补贴对企业绿色创新质量的影响研究——“扶持悖论”的新解与检验[J]. 产业经济研究, 2025(4):100-113.
|
| [9] |
汤义成. 国有资本参股影响民营企业绿色创新的偏向性——促进实质性创新还是策略性创新?[J]. 西部论坛, 2023, 33(6):96-113.
|
| [10] |
|
| [11] |
刘建民, 凌惠馨, 刘嘉意. 人口老龄化对地方财政风险的影响:自缚还是破茧?[J]. 财经理论与实践, 2025, 46(5):80-87.
|
| [12] |
李建强, 张淑翠. 人口老龄化影响财政与货币政策的有效性吗?[J]. 财经研究, 2018, 44(7):16-32.
|
| [13] |
|
| [14] |
姚东旻, 宁静, 韦诗言. 老龄化如何影响科技创新[J]. 世界经济, 2017, 40(4):105-128.
|
| [15] |
|
| [16] |
|
| [17] |
金昊, 赵青霞. 人口结构转变如何影响技术创新——基于省级面板数据的实证分析[J]. 宏观经济研究, 2019(12):130-147.
|
| [18] |
昌忠泽, 姜珂, 魏诗谣. 人口老龄化对技术创新的影响研究[J]. 财贸研究, 2022, 33(11):55-68.
|
| [19] |
邓世成, 吴玉鸣. 城市群绿色技术创新的空间网络结构特征及其效应研究——以成渝地区双城经济圈为例[J]. 管理学报, 2022, 19(12):1756-1765.
|
| [20] |
|
| [21] |
随淑敏, 何增华. 人口老龄化对企业创新的影响——基于人口普查数据与微观工业企业数据的实证分析[J]. 人口研究, 2020, 44(6):63-78.
|
| [22] |
|
| [23] |
许娜, 冯大威. 家庭人口老化与代际阶层流动——基于CGSS微观数据的实证检验[J]. 人口与经济, 2025(2):70-84.
|
| [24] |
张逸君, 邱德馨, 王雪标. 公共人力资本投资结构、经济增长与人口老龄化[J]. 财政研究, 2023(4):48-67.
|
| [25] |
|
| [26] |
刘慧君, 吴鹏. 中国健康老龄化水平的动态演进及服务效能驱动研究[J]. 人口学刊, 2025, 47(1):94-112.
|
| [27] |
余泳泽. 中国区域创新活动的“协同效应”与“挤占效应”——基于创新价值链视角的研究[J]. 中国工业经济, 2015(10):37-52.
|
| [28] |
边恕, 武传昊, 孙雅娜. 人口老龄化对技能溢价的影响研究[J]. 中国人口科学, 2025, 39(5):66-81.
|
| [29] |
沈永建, 于双丽, 朱笛, 等. 劳动力成本、产业转移与企业价值——基于富士康内迁事件的案例研究[J]. 会计与经济研究, 2017, 31(4):56-70.
|
| [30] |
|
| [31] |
|
| [32] |
|
| [33] |
|
| [34] |
张明斗, 闫昱睿. 低碳战略能否增强城市经济发展与生态环境的协调性——基于低碳城市试点的准自然实验[J]. 广东财经大学学报, 2023, 38(3):24-37.
|
| [35] |
王国定, 陈祥, 孔欢. 城乡收入差距与人口老龄化的时空关联——基于动态空间面板模型的实证分析[J]. 经济问题, 2022(7):44-53.
|
| [36] |
文建东, 谢聪. 人口老龄化对收入不平等的影响——基于省域数据的空间计量模型分析[J]. 南京审计大学学报, 2017, 14(4):12-23.
|
| [37] |
|
| [38] |
包振山, 王金伟, 罗雪华. 数字经济对流通业高质量发展的影响及其空间效应[J]. 经济地理, 2025, 45(5):103-112.
|
| [39] |
|
/
| 〈 |
|
〉 |