
Spatiotemporal Evolution of Ecological Quality in Shishou City Based on GEE and Remote Sensing Based Ecological Index
Received date: 2025-01-05
Revised date: 2025-07-30
Online published: 2026-02-12
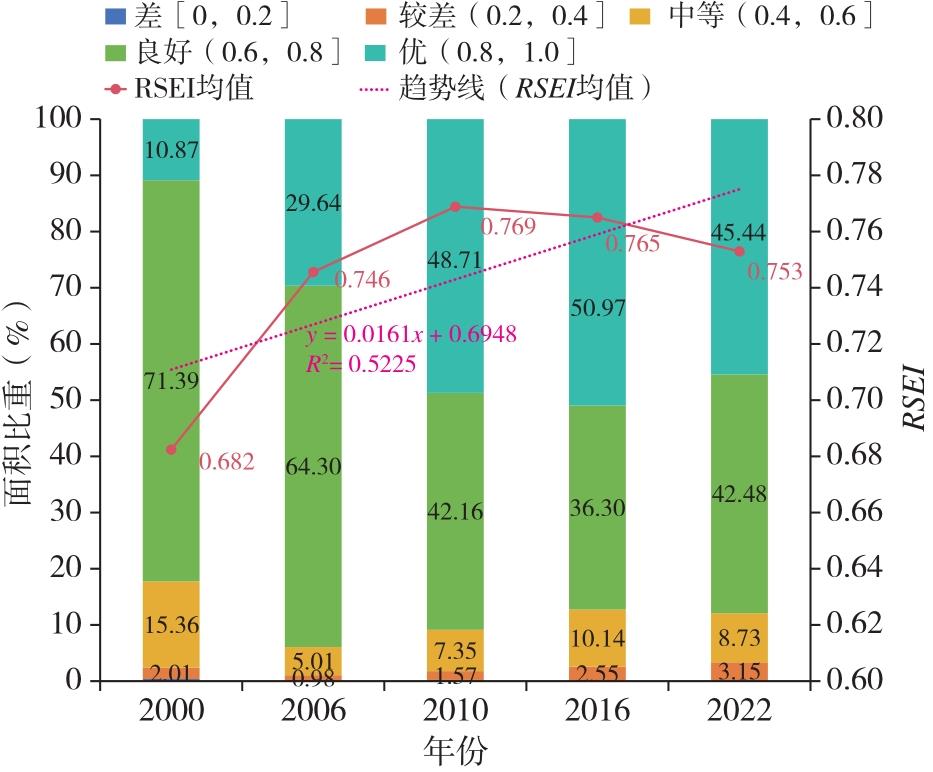
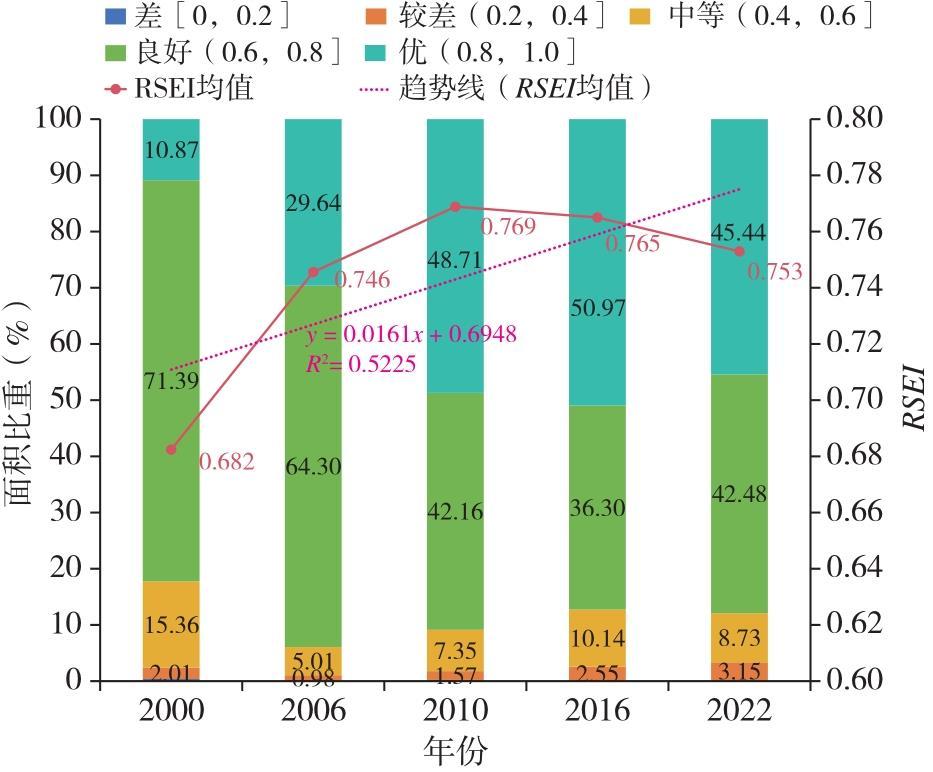
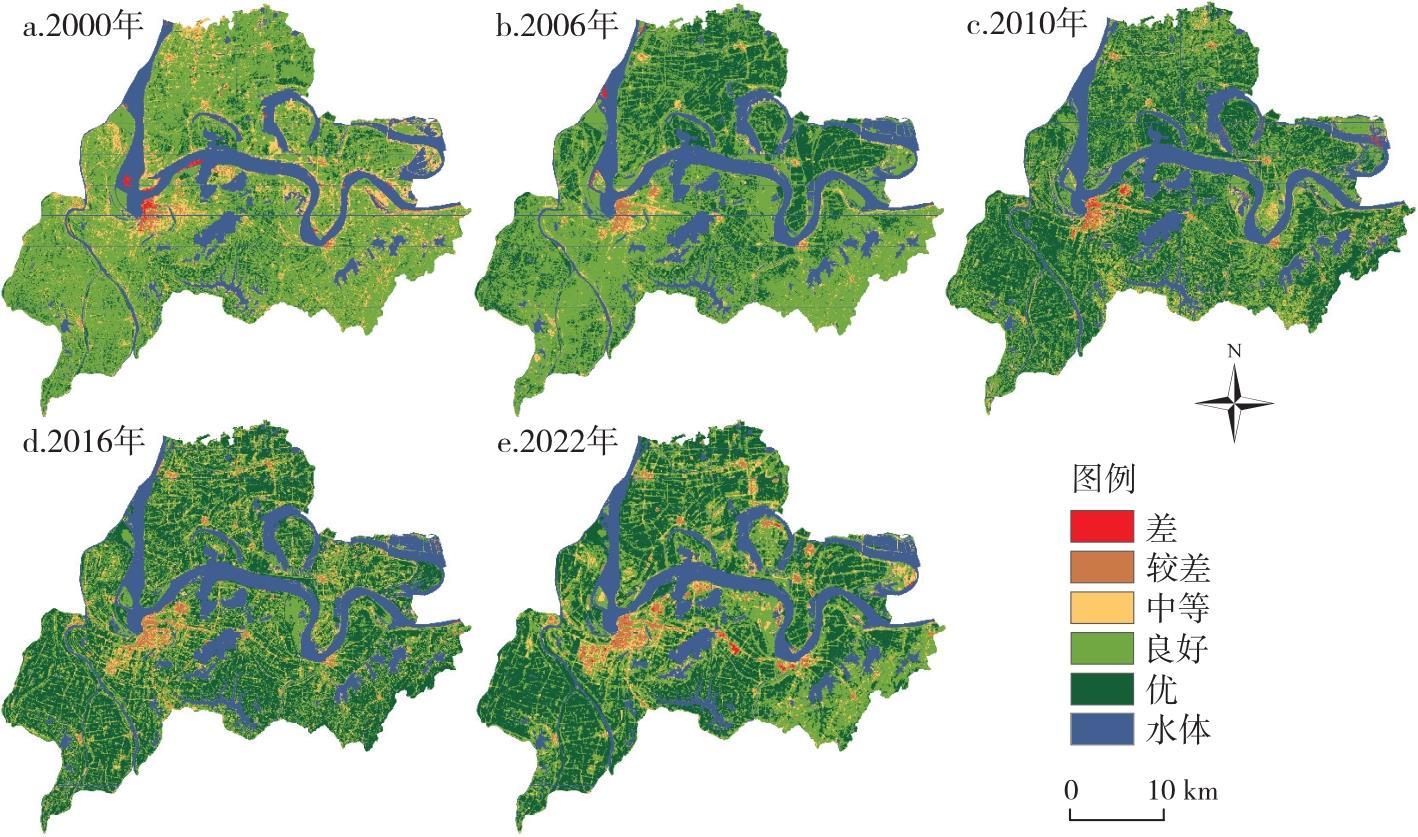
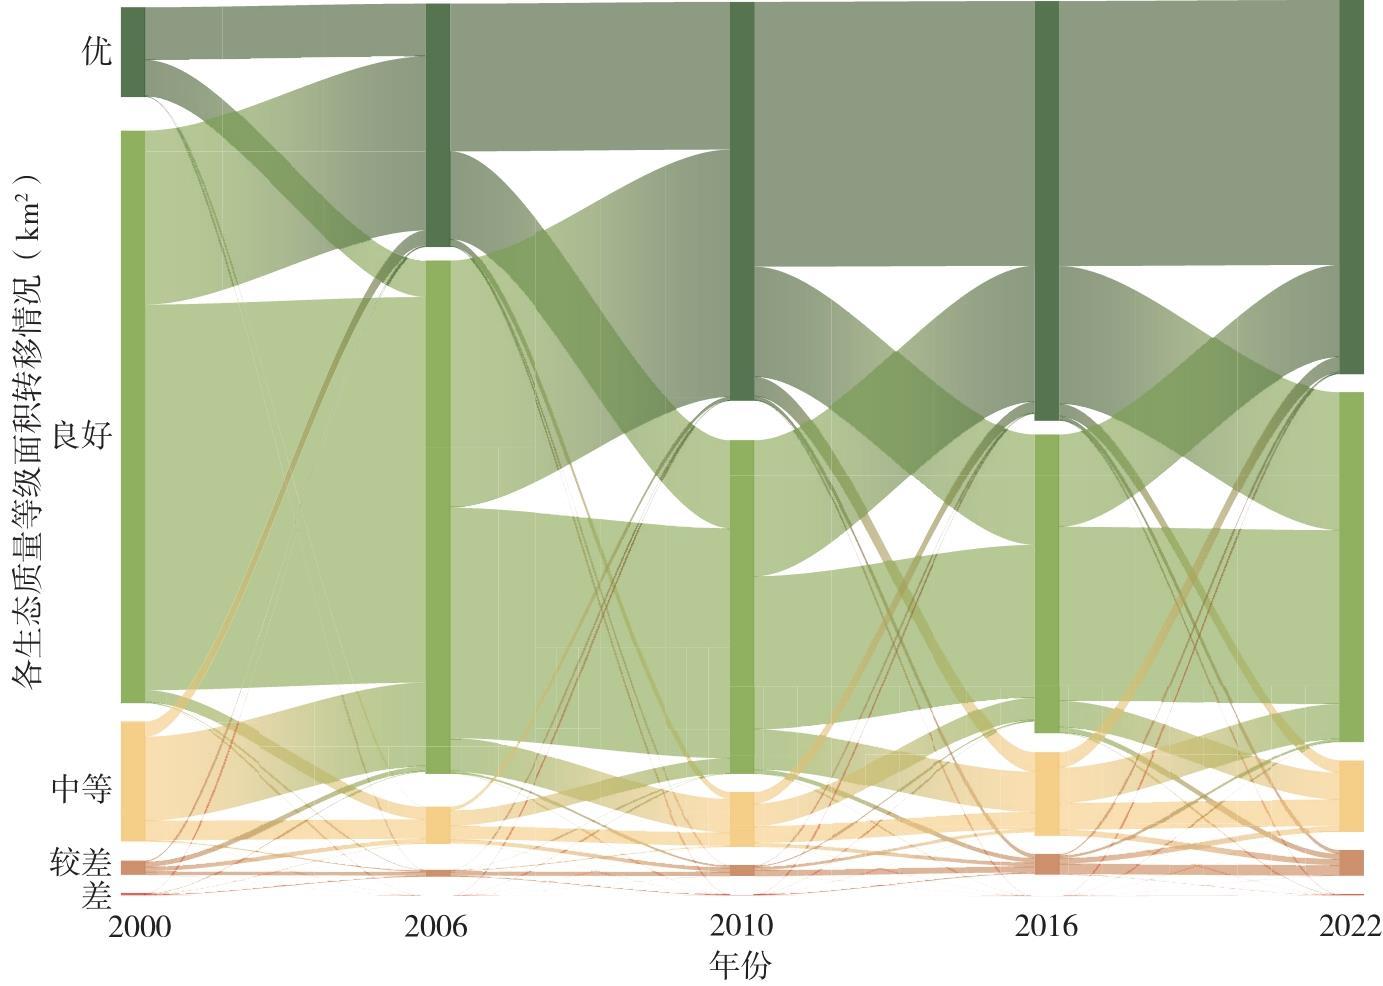
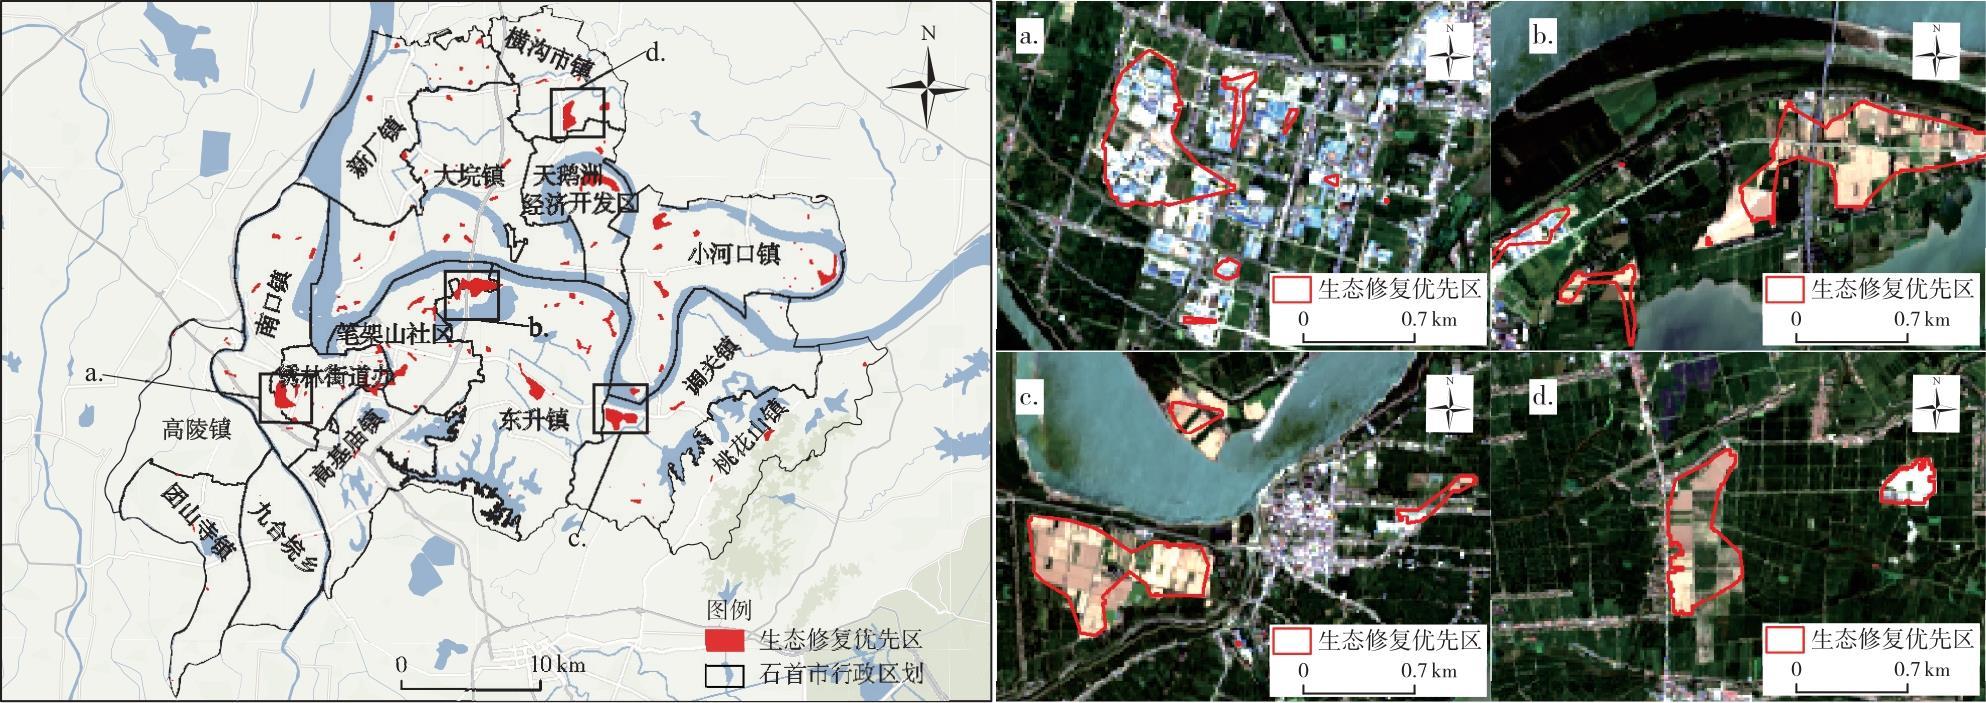
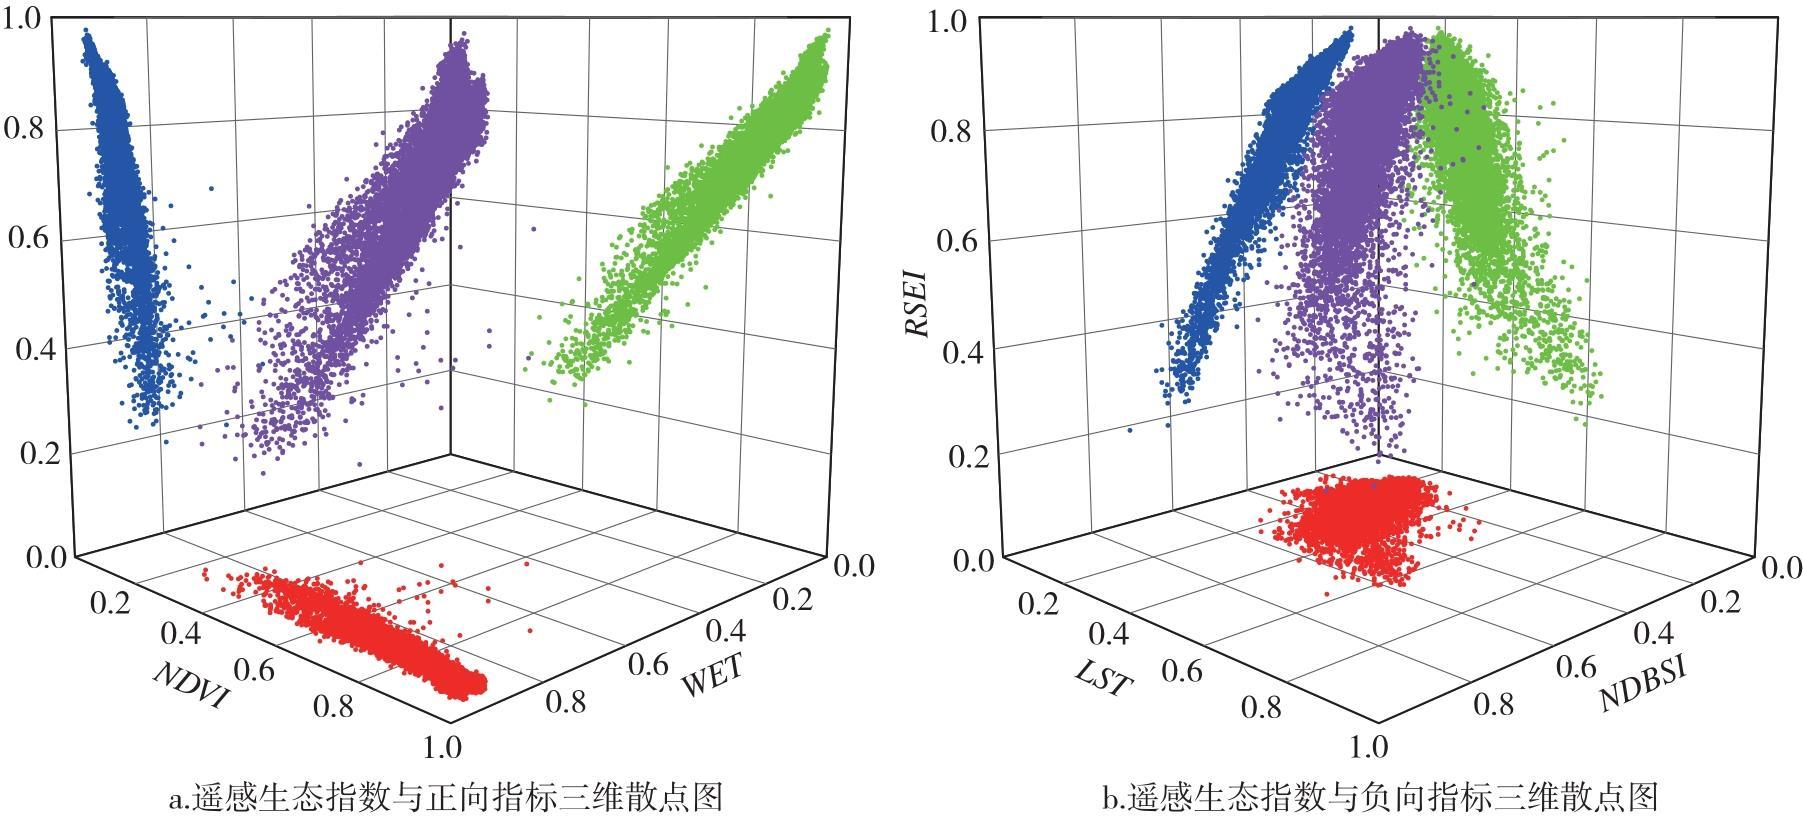
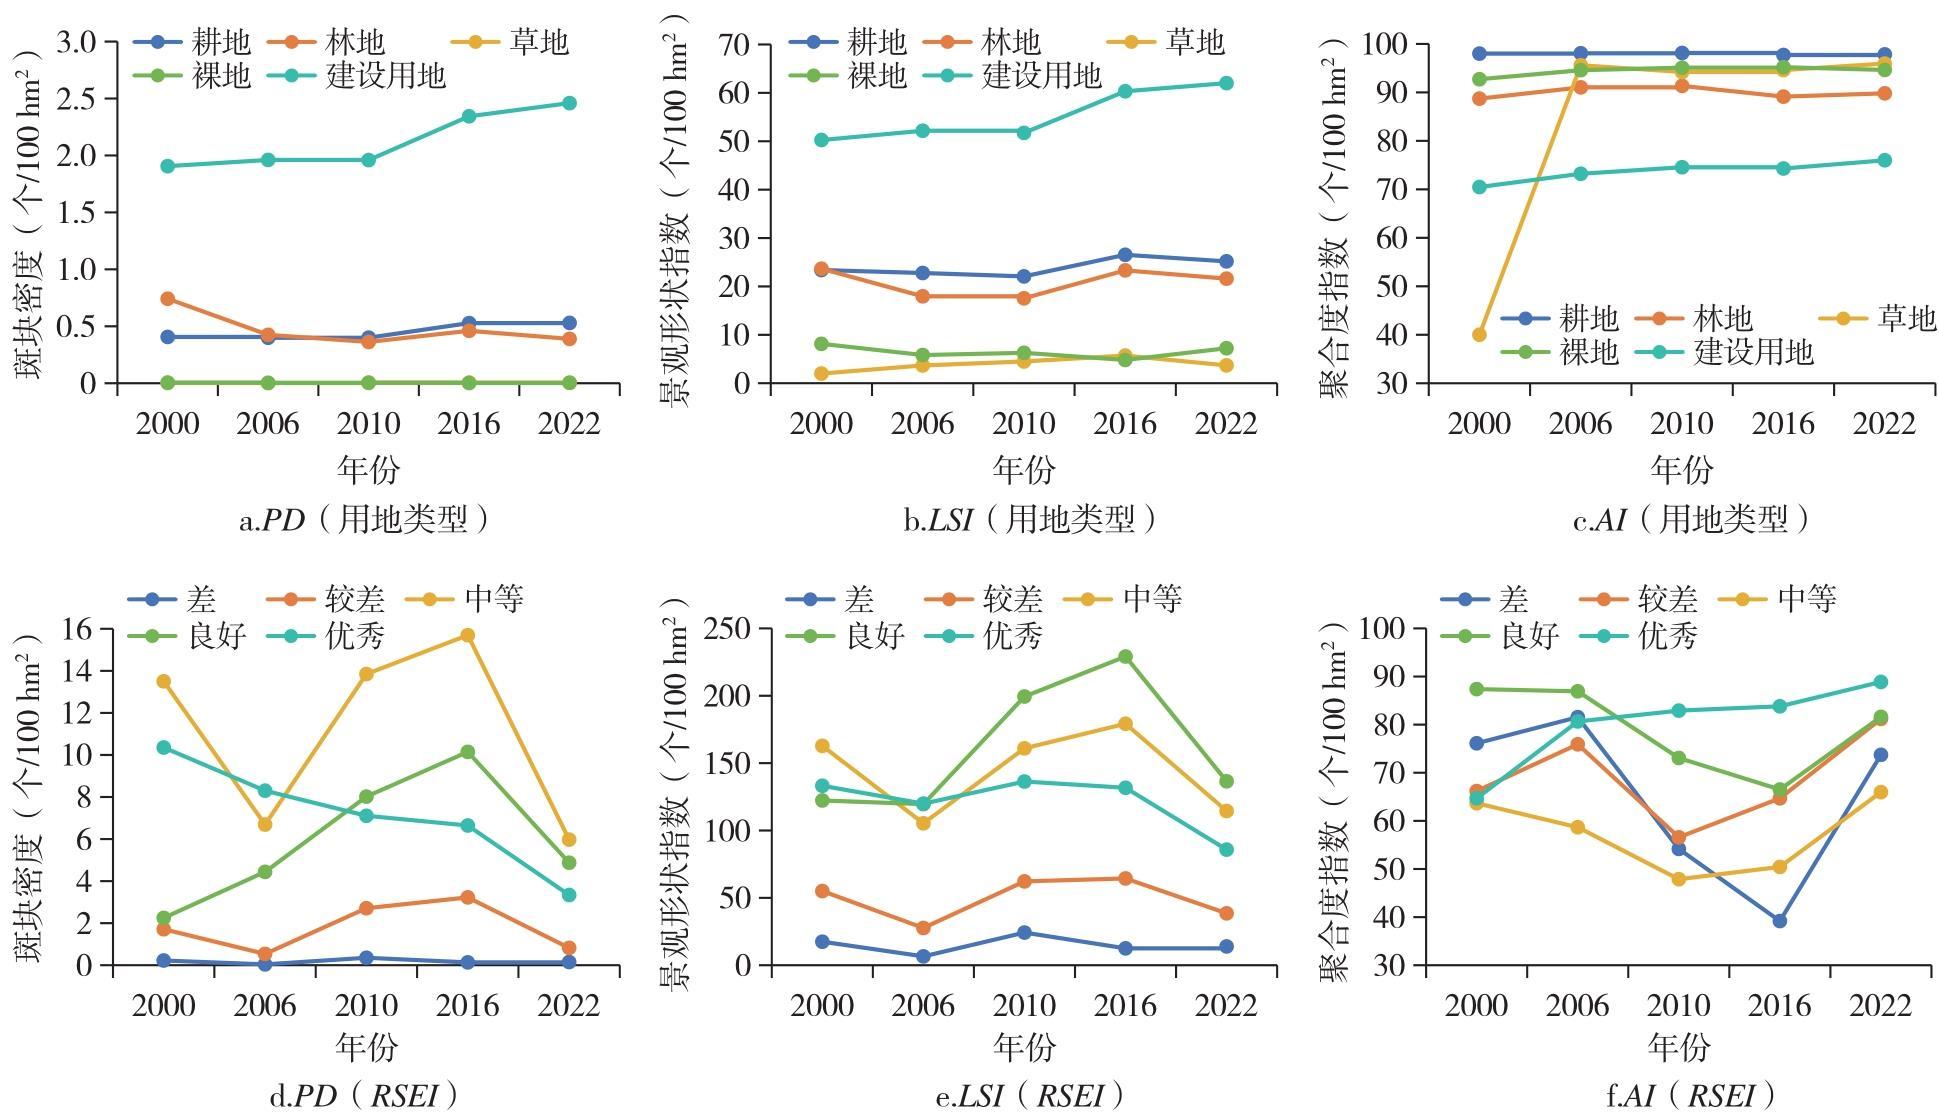
Taking Shishou City as the research object and based on the Landsat5, 8, and 9 remote sensing data from 2000 to 2022, this study calculates greenness index, heat index, humidity index, and dryness index on the basis of Google Earth Engine, and constructs the Remote Sensing based Ecological Index (RSEI), which aims to dynamically monitor the changes in the ecological quality of Shishou City and identify the priority areas for ecological restoration. It uses the methods of spatial statistics and landscape pattern index to explore the spatial and temporal changes and aggregation characteristics of ecological quality in Shishou City. The results show that: 1) The average values of remote sensing ecological index in Shishou City were 0.682, 0.746, 0.769, 0.765 and 0.753 in the five time periods from 2000 to 2022, which were all at the level of "good" or above. 2) The ecological quality of Shishou City in the five periods was "excellent" and "good" in a wide range of areas, accounting for a large proportion. 3) From 2000 to 2010, the ecological quality of Shishou City improved more and degraded less. From 2011 to 2022, the ecological quality of Shishou City improved and degraded basically the same. 4) The Moran's index in Shishou City from 2000 to 2022 was 0.423, 0.550, 0.332, 0.340 and 0.543 in order, showing positive spatial correlation, with high-high clustering and low-low clustering predominating. 5) In the past two decades, the density of ecological quality landscape patches in Shishou City has tended to decrease, the shape of patches has tended to be regular, and similar patches have become more aggregated. The combination of RSEI and spatial statistical analysis is able to monitor the spatial and temporal changes of ecological quality, and identify priority areas for ecological restoration. The methods can provide certain reference for regional ecological security and ecological protection.
WANG Xu , FANG Xiaonan , LI Shengfang , XU Hang , ZHENG Xiaoming , XIAO Hao . Spatiotemporal Evolution of Ecological Quality in Shishou City Based on GEE and Remote Sensing Based Ecological Index[J]. Economic geography, 2026 , 46(1) : 204 -214 . DOI: 10.15957/j.cnki.jjdl.2026.01.020
表1 遥感影像数据及信息Tab.1 Remote sensing image data and its information |
| 时间 | 影像编号 | 云量 (%) |
|---|---|---|
| 2000/ 09/04 | LANDSAT/LT05/C02/T1_L2/LT05_124039_20000904 | 9.00 |
| LANDSAT/LT05/C02/T1_L2/LT05_124040_20000904 | 17.00 | |
| 2006/ 08/20 | LANDSAT/LT05/C02/T1_L2/LT05_124039_20060820 | 3.00 |
| LANDSAT/LT05/C02/T1_L2/LT05_124040_20060820 | 4.00 | |
| 2010/ 07/31 | LANDSAT/LT05/C02/T1_L2/LT05_124039_20100730 | 6.00 |
| LANDSAT/LT05/C02/T1_L2/LT05_124040_20100730 | 1.00 | |
| 2016/ 07/30 | LANDSAT/LC08/C02/T1_L2/LC08_124039_20160730 | 1.41 |
| LANDSAT/LC08/C02/T1_L2/LC08_124040_20160730 | 1.97 | |
| 2022/ 08/08 | LANDSAT/LC09/C02/T1_L2/LC09_124039_20220808 | 0.21 |
| LANDSAT/LC09/C02/T1_L2/LC09_124040_20220808 | 0.18 |
表2 石首市5个时期RSEI各指标的主成分分析结果Tab.2 Results of principal component analysis of RSEI in Shishou City |
| 年份 | 指标 | PC1 | PC2 | PC3 | PC4 |
|---|---|---|---|---|---|
| 2000 | NDVI | 0.7695 | 0.5460 | 0.0229 | -0.3306 |
| WET | 0.1837 | -0.6841 | 0.1338 | -0.6931 | |
| LST | -0.1239 | 0.1429 | 0.9818 | 0.0156 | |
| NDBSI | -0.5990 | 0.4620 | -0.1326 | -0.6404 | |
| 特征值 | 0.0167 | 0.0065 | 0.0017 | 0.0003 | |
| 特征值贡献率(%) | 66.43 | 25.64 | 6.64 | 1.29 | |
| 2006 | NDVI | 0.6785 | 0.7064 | 0.1256 | -0.1578 |
| WET | 0.1072 | -0.3252 | 0.0732 | -0.9367 | |
| LST | -0.3475 | 0.1642 | 0.9229 | -0.0246 | |
| NDBSI | -0.6383 | 0.6069 | -0.3566 | -0.3116 | |
| 特征值 | 0.0085 | 0.0025 | 0.0012 | 0.0001 | |
| 特征值贡献率(%) | 69.36 | 20.52 | 9.47 | 0.66 | |
| 2010 | NDVI | 0.8811 | -0.4293 | -0.1657 | -0.1090 |
| WET | 0.0171 | 0.2138 | 0.1699 | -0.9618 | |
| LST | -0.1870 | -0.6594 | 0.7279 | -0.0214 | |
| NDBSI | -0.4340 | -0.5790 | -0.6434 | -0.2501 | |
| 特征值 | 0.0172 | 0.0041 | 0.0017 | 0.0000 | |
| 特征值贡献率(%) | 74.74 | 17.73 | 7.35 | 0.19 | |
| 2016 | NDVI | 0.7616 | -0.5019 | -0.3846 | -0.1421 |
| WET | 0.1335 | 0.2120 | 0.3246 | -0.9121 | |
| LST | -0.2695 | -0.8037 | 0.5292 | -0.0379 | |
| NDBSI | -0.5741 | -0.2393 | -0.6831 | -0.3828 | |
| 特征值 | 0.0264 | 0.0032 | 0.0017 | 0.0001 | |
| 特征值贡献率(%) | 84.26 | 10.18 | 5.31 | 0.25 | |
| 2022 | NDVI | 0.6339 | -0.7477 | -0.1797 | -0.0825 |
| WET | 0.1951 | -0.0015 | 0.8870 | -0.4186 | |
| LST | -0.7328 | -0.6608 | 0.1623 | 0.0047 | |
| NDBSI | -0.1520 | 0.0655 | -0.3933 | -0.9044 | |
| 特征值 | 0.0151 | 0.0037 | 0.0004 | 0.0000 | |
| 特征值贡献率(%) | 78.65 | 19.23 | 2.03 | 0.09 |
表3 石首市5个时期的遥感生态指数分级统计结果Tab.3 Classification and statistical results of RSEI in the five periods in Shishou City |
| 等级 | 指标 | 2000 | 2006 | 2010 | 2016 | 2022 |
|---|---|---|---|---|---|---|
| 差[0,0.2] | 面积(km2) | 4.36 | 0.90 | 2.43 | 0.36 | 2.30 |
| 比重(%) | 0.37 | 0.08 | 0.21 | 0.03 | 0.20 | |
| 较差(0.2,0.4] | 面积(km2) | 23.46 | 11.26 | 18.26 | 29.50 | 36.36 |
| 比重(%) | 2.01 | 0.98 | 1.57 | 2.55 | 3.15 | |
| 中等(0.4,0.6] | 面积(km2) | 179.40 | 57.83 | 85.42 | 117.13 | 100.83 |
| 比重(%) | 15.36 | 5.01 | 7.35 | 10.14 | 8.73 | |
| 良好(0.6,0.8] | 面积(km2) | 833.89 | 742.17 | 490.12 | 419.16 | 490.50 |
| 比重(%) | 71.39 | 64.30 | 42.16 | 36.30 | 42.48 | |
| 优(0.8,1.0] | 面积(km2) | 126.99 | 342.12 | 566.26 | 588.46 | 524.68 |
| 比重(%) | 10.87 | 29.64 | 48.71 | 50.97 | 45.44 |
表4 2000—2022年石首市生态等级变化情况统计Tab.4 Statistics on changes of ecological ranking in Shishou City, 2000-2022 |
| 时段 | 变化情况 | 明显退化 | 略有退化 | 不变 | 略有改善 | 明显改善 | ||||||
|---|---|---|---|---|---|---|---|---|---|---|---|---|
| -4 | -3 | -2 | -1 | 0 | +1 | +2 | +3 | +4 | ||||
| 2000—2006年 | 变化等级面积(km2) | 0.00 | 0.11 | 1.64 | 70.37 | 647.33 | 369.52 | 29.17 | 2.87 | 0.09 | ||
| 变化总面积(km2) | 72.11 | 647.33 | 401.65 | |||||||||
| 比重(%) | 6.43 | 57.74 | 35.83 | |||||||||
| 2007—2010年 | 变化等级面积(km2) | 0.02 | 0.54 | 13.11 | 177.61 | 555.12 | 369.65 | 5.48 | 0.25 | 0.00 | ||
| 变化总面积(km2) | 191.27 | 555.12 | 375.39 | |||||||||
| 比重(%) | 17.05 | 49.49 | 33.46 | |||||||||
| 2011—2016年 | 变化等级面积(km2) | 0.02 | 5.86 | 33.84 | 216.31 | 618.48 | 228.26 | 18.42 | 0.63 | 0.00 | ||
| 变化总面积(km2) | 256.02 | 618.48 | 247.30 | |||||||||
| 比重(%) | 22.82 | 55.13 | 22.05 | |||||||||
| 2017—2022年 | 变化等级面积(km2) | 0.54 | 6.25 | 25.26 | 240.00 | 667.99 | 186.80 | 25.57 | 2.15 | 0.00 | ||
| 变化总面积(km2) | 272.04 | 667.99 | 214.52 | |||||||||
| 比重(%) | 23.56 | 57.86 | 18.58 | |||||||||
表5 石首市5个时期各用地类型的RSEI统计值Tab.5 RSEI statistical values by land use type in Shishou City, 2000-2022 |
| 年份 | RSEI统计值 | 耕地 | 林地 | 草地 | 裸地 | 不透水面 |
|---|---|---|---|---|---|---|
| 2000 | min | 0.000 | 0.096 | 0.413 | 0.023 | 0.012 |
| max | 1.000 | 0.902 | 0.477 | 0.854 | 0.927 | |
| mean | 0.690 | 0.698 | 0.443 | 0.289 | 0.428 | |
| median | 0.701 | 0.704 | 0.439 | 0.180 | 0.409 | |
| 2006 | min | 0.006 | 0.333 | 0.134 | 0.070 | 0.018 |
| max | 1.000 | 0.866 | 0.727 | 0.770 | 0.865 | |
| mean | 0.755 | 0.732 | 0.545 | 0.369 | 0.494 | |
| median | 0.773 | 0.738 | 0.604 | 0.238 | 0.473 | |
| 2010 | min | 0.001 | 0.149 | 0.009 | 0.378 | 0.000 |
| max | 1.000 | 0.952 | 0.806 | 0.787 | 0.947 | |
| mean | 0.779 | 0.823 | 0.641 | 0.632 | 0.477 | |
| median | 0.800 | 0.836 | 0.659 | 0.648 | 0.443 | |
| 2016 | min | 0.070 | 0.215 | 0.343 | 0.398 | 0.000 |
| max | 1.000 | 0.966 | 0.904 | 0.809 | 0.960 | |
| mean | 0.776 | 0.822 | 0.755 | 0.622 | 0.474 | |
| median | 0.806 | 0.838 | 0.768 | 0.623 | 0.431 | |
| 2022 | min | 0.000 | 0.076 | 0.256 | 0.224 | 0.022 |
| max | 0.990 | 0.894 | 0.986 | 0.911 | 1.000 | |
| mean | 0.767 | 0.744 | 0.780 | 0.647 | 0.460 | |
| median | 0.796 | 0.754 | 0.799 | 0.668 | 0.421 |
| [1] |
骆泓鉴, 明冬萍, 徐录. 基于GEE的遥感生态指数时序计算[J]. 自然资源遥感, 2022, 34(2):271-277.
|
| [2] |
戈晨曦. “三生空间”背景下榆林市土地利用功能演变及生态环境响应[D]. 西安: 长安大学, 2021.
|
| [3] |
邹利林, 刘彦随, 王永生. 中国土地利用冲突研究进展[J]. 地理科学进展, 2020, 39(2):298-309.
|
| [4] |
王世豪, 黄麟, 徐新良, 等. 特大城市群生态空间及其生态承载状态的时空分异[J]. 地理学报, 2022, 77(1):164-181.
|
| [5] |
陈昆仑, 齐漫, 王旭, 等. 1995—2015年武汉城市湖泊景观生态安全格局演化[J]. 生态学报, 2019, 39(5):1725-1734.
|
| [6] |
刘小琼, 何鹏飞, 韩继财, 等. 长江经济带生态安全格局演化及多情景模拟预测[J]. 经济地理, 2023, 43(12):192-203.
|
| [7] |
李小娟, 万大娟, 王长梅. 怀化市经济发展与生态环境保护耦合协调性研究[J]. 经济地理, 2023, 43(11):190-197.
|
| [8] |
夏天, 吴婕妤, 朱媛媛, 等. 中国中部重点农区虾稻田的时空演变及地域模式[J]. 经济地理, 2023, 43(6):183-191.
|
| [9] |
|
| [10] |
|
| [11] |
徐涵秋. 区域生态环境变化的遥感评价指数[J]. 中国环境科学, 2013, 33(5):889-897.
|
| [12] |
徐涵秋. 城市遥感生态指数的创建及其应用[J]. 生态学报, 2013, 33(24):7853-7862.
|
| [13] |
|
| [14] |
农兰萍, 王金亮. 基于RSEI模型的昆明市生态环境质量动态监测[J]. 生态学杂志, 2020, 39(6):2042-2050.
|
| [15] |
|
| [16] |
|
| [17] |
王建, 赵牡丹, 李健波, 等. 基于MODIS时序数据的秦巴山区生态环境质量动态监测及驱动力分析[J]. 山地学报, 2021, 39(6):830-841.
|
| [18] |
|
| [19] |
|
| [20] |
|
| [21] |
|
| [22] |
|
| [23] |
|
| [24] |
|
| [25] |
王彤新, 李莎, 左婵, 等. 近20年荆州市归一化植被指数时空演变特征及其对空气质量的影响[J]. 中国城市林业, 2023, 21(6):106-112.
|
| [26] |
黄端, 池泓, 朱浪, 等. 荆州市农田植被净初级生产力时空特征分析[J]. 气象科技进展, 2018, 8(5):96-100.
|
| [27] |
张雅杰, 李扬. 基于GIS的耕地质量综合评价——以湖北省荆州市为例[J]. 国土资源科技管理, 2017, 34(1):90-96.
|
| [28] |
陈晶晶, 李天宏. 基于PSR模型和投影寻踪法的荆州市景观生态风险评价[J]. 北京大学学报(自然科学版), 2017, 53(4):731-740.
|
| [29] |
刘嘉, 魏清松, 徐齐帆, 等. 荆州市水环境与水生态问题分析及治理措施[J]. 水利水电快报, 2024, 45(S1):73-75.
|
| [30] |
孙智杰, 江越潇, 罗莉威, 等. 基于土地利用的荆州市三生空间格局演化特征分析[J]. 上海国土资源, 2024, 45(2):111-118.
|
| [31] |
余威, 何蒲明. 基于GeoSOS-FLUS模型的荆州市生态安全评估[J]. 天津农业科学, 2024, 30(2):47-54.
|
| [32] |
徐涵秋. 利用改进的归一化差异水体指数(MNDWI)提取水体信息的研究[J]. 遥感学报, 2005(5):589-595.
|
| [33] |
|
| [34] |
王宏亮, 高艺宁, 王振宇, 等. 基于生态系统服务的城市生态管理分区——以深圳市为例[J]. 生态学报, 2020, 40(23):8504-8515.
|
| [35] |
|
| [36] |
|
| [37] |
周婷, 马姣娇, 徐颂军. 2003-2013年中国湿地变化的空间格局与关联性[J]. 环境科学, 2020, 41(5):2496-2504.
|
| [38] |
朱磊, 杨爱民, 夏鑫鑫, 等. 基于空间自相关的1975—2015年玛纳斯河流域耕地时空特征变化分析[J]. 中国生态农业学报(中英文), 2020, 28(6):887-899.
|
| [39] |
黄友慧, 辛儒鸿, 李凯. 红枫湖镇生态环境质量评价及修复优先区识别研究[J]. 西南林业大学学报(自然科学), 2024, 44(4):64-72.
|
| [40] |
付梦娣, 唐文家, 刘伟玮, 等. 基于生态系统服务视角的生态风险评估及生态修复空间辨识——以长江源区为例[J]. 生态学报, 2021, 41(10):3846-3855.
|
| [41] |
匡文慧. 城市土地利用/覆盖变化与热环境生态调控研究进展与展望[J]. 地理科学, 2018, 38(10):1643-1652.
|
| [42] |
|
| [43] |
卢勇, 陈晖, 伽红凯, 等. 重要农业文化遗产保护与农业韧性的时空演变及影响效应[J]. 经济地理, 2024, 44(10):194-204.
|
| [44] |
张静, 杨丽萍, 贡恩军, 等. 基于谷歌地球引擎和改进型遥感生态指数的西安市生态环境质量动态监测[J]. 生态学报, 2023, 43(5):2114-2127.
|
| [45] |
|
/
| 〈 |
|
〉 |