
Driving Forces of Provincial Residents' Consumption Balanced Development in the Context of Digital Economy
Received date: 2023-06-11
Revised date: 2025-01-17
Online published: 2026-02-04
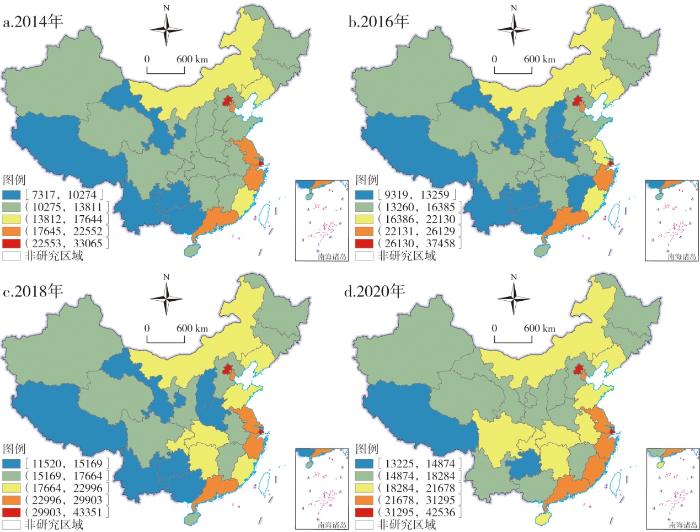
This article is predicated on a comprehensive analysis of panel data encompassing all 31 provinces across China spanning the years 2013 to 2020. Employing advanced methodologies such as Moran's I and Geodetector, it scrutinizes the spatiotemporal evolution of inter-provincial consumption correlations. Additionally, it delves into the determinants behind the spatial disparities in consumption patterns among provincial residents, unraveling the dynamic forces and intricate mechanisms underpinning the harmonized development of consumption spaces in the era of the digital economy. The findings underscore a prevailing positive spatial correlation in provincial residents' consumption behaviors. While there exists some degree of variance in consumption levels among provinces, this difference demonstrates relatively modest fluctuations over the examined period. This dynamic manifest a spatial distribution characterized by heightened consumption rates in the eastern region, juxtaposed with comparatively lower rates in the central and western regions. On the global scale, diverse variables indicative of the digital economy exhibits the potential to propel the equitable development of provincial consumption spaces. Conversely, factors representative of the non-digital economy, when interacting in tandem with other variables, tend to exacerbate spatial disparities in residents' consumption. Notably, parameters such as digital payment adoption, individual digital creditworthiness, per capita postal and telecommunications transactions, mobile phone penetration rates, and other digital economy metrics exhibit consistent and robust contributions to the balanced expansion of consumption across regional boundaries. In contrast to prevailing literature that predominantly examines consumption differentials between urban and rural populations, this article shifts its focus toward consumption expenditure patterns among provincial residents.

WEI Qing , WANG Haiying . Driving Forces of Provincial Residents' Consumption Balanced Development in the Context of Digital Economy[J]. Economic geography, 2025 , 45(12) : 54 -64 . DOI: 10.15957/j.cnki.jjdl.2025.12.006
表1 省域居民消费的驱动因素及说明Tab.1 Drivers of provincial residents' consumption expenditure |
| 序号 | 影响因素 | 变量描述 | 单位 | 计算方法 |
|---|---|---|---|---|
| 1 | pgdp | 人均GDP | 元/人 | 地区GDP(万元)/年末人口总数(万人) |
| 2 | ul | 城镇化水平 | % | 年末城镇人口比重=年末城镇人口数/年末总人口 |
| 3 | pcdi | 居民人均可支配收入 | 元/人 | / |
| 4 | mpr | 移动电话普及率 | 部/百人 | / |
| 5 | pcptv | 人均邮电业务量 | 万元/人 | 邮电业务总量(亿元)/地区年末人口数(万人) |
| 6 | dp | 数字支付水平 | / | 使用北京大学数字普惠金融指数支付子指数[41] |
| 7 | dicc | 数字个人信贷水平 | / | 使用北京大学数字普惠金融指数信贷子指数[41] |
| 8 | ocl | 每平方公里光缆长度 | km/km2 | 光缆长度/地区面积 |
| 9 | ecs | 电子商务销售额占GDP比重 | % | 电子商务销售额/GDP |
| 10 | ecps | 电子商务采购和销售额 | 亿元 | 电子商务采购+电子商务销售额 |
| 11 | sbi | 软件业务收入 | 亿元 | / |
| 12 | pn | 规模以上工业企业发明专利申请数 | 件 | / |
表2 2013—2020年中国省域居民消费的Moran's I指数Tab.2 Moran's I of provincial residents' consumption expenditure from 2013 to 2020 |
| 年份 | Moran's I | Z值 | P值 | 年份 | Moran's I | Z值 | P值 | |
|---|---|---|---|---|---|---|---|---|
| 2013 | 0.323 | 3.257 | 0.001 | 2017 | 0.315 | 3.186 | 0.001 | |
| 2014 | 0.322 | 3.250 | 0.001 | 2018 | 0.326 | 3.308 | 0.000 | |
| 2015 | 0.319 | 3.219 | 0.001 | 2019 | 0.331 | 3.332 | 0.000 | |
| 2016 | 0.309 | 3.120 | 0.001 | 2020 | 0.336 | 3.363 | 0.000 |
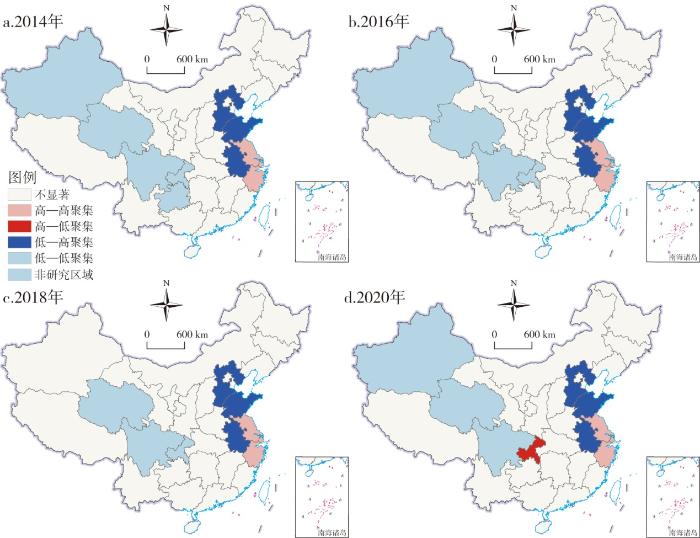
表3 2013—2020年中国省域居民消费的Moran散点图统计结果Tab.3 Moran scatter chart data statistics of provincial residents' consumption expenditures from 2013 to 2020 |
| 年份 | 第一象限 高—高(H-H) | 第二象限 低—高(L-H) | 第三象限 低—低(L-L) | 第四象限 高—低(H-L) |
|---|---|---|---|---|
| 2013 | 6 | 6 | 16 | 3 |
| 2015 | 6 | 6 | 16 | 3 |
| 2017 | 6 | 5 | 17 | 3 |
| 2019 | 6 | 5 | 18 | 2 |
| 2020 | 6 | 4 | 19 | 2 |
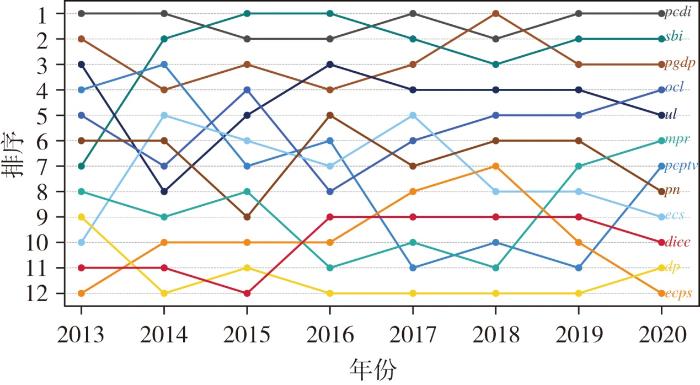
表4 中国省域居民消费驱动因素的单因子驱动分析结果Tab.4 Single factor driving analysis results of residents' consumption driving factors |
| 序号 | 变量描述 | 变量名 | p/q | 2013 | 2014 | 2015 | 2016 | 2017 | 2018 | 2019 | 2020 |
|---|---|---|---|---|---|---|---|---|---|---|---|
| 1 | 每平方公里光缆长度 | ocl | q | 0.4488 | 0.7256 | 0.7336 | 0.5922 | 0.5769 | 0.6274 | 0.7427 | 0.7480 |
| p | 0.4439 | 0.0060 | 0.0051 | 0.1093 | 0.1415 | 0.0443 | 0.0057 | 0.0080 | |||
| 2 | 移动电话普及率 | mpr | q | 0.3530 | 0.6325 | 0.6187 | 0.4968 | 0.4987 | 0.3990 | 0.6551 | 0.7069 |
| p | 0.0845 | 0.0000 | 0.0651 | 0.0218 | 0.0209 | 0.0523 | 0.0000 | 0.0038 | |||
| 3 | 数字支付水平 | dp | q | 0.3257 | 0.4862 | 0.5121 | 0.4282 | 0.4243 | 0.3988 | 0.4703 | 0.5680 |
| p | 0.3260 | 0.0114 | 0.0078 | 0.0102 | 0.0108 | 0.0136 | 0.0053 | 0.0000 | |||
| 4 | 数字信贷水平 | dicc | q | 0.2841 | 0.5038 | 0.4789 | 0.5139 | 0.5230 | 0.5120 | 0.5563 | 0.5715 |
| p | 0.1434 | 0.0074 | 0.0079 | 0.0066 | 0.0036 | 0.0035 | 0.0024 | 0.000 | |||
| 5 | 电子商务销售额占GDP比重 | ecs | q | 0.3193 | 0.7377 | 0.7208 | 0.6098 | 0.6203 | 0.5626 | 0.6491 | 0.6272 |
| p | 0.1335 | 0.0041 | 0.0188 | 0.0354 | 0.0461 | 0.0652 | 0.0484 | 0.0439 | |||
| 6 | 电子商务采购与销售额 | ecps | q | 0.1951 | 0.5642 | 0.5139 | 0.4975 | 0.5460 | 0.6178 | 0.5175 | 0.5627 |
| p | 0.7967 | 0.0389 | 0.0607 | 0.0231 | 0.1948 | 0.0390 | 0.1216 | 0.0987 | |||
| 7 | 人均邮电业务量 | pcptv | q | 0.4533 | 0.7998 | 0.7032 | 0.6380 | 0.4915 | 0.4383 | 0.5069 | 0.7059 |
| p | 0.3599 | 0.0000 | 0.0000 | 0.0000 | 0.0237 | 0.0344 | 0.0206 | 0.0000 | |||
| 8 | 软件业务收入 | sbi | q | 0.4216 | 0.8369 | 0.8869 | 0.9249 | 0.8311 | 0.7800 | 0.7910 | 0.7997 |
| p | 0.3546 | 0.0000 | 0.0000 | 0.0000 | 0.0000 | 0.0000 | 0.0000 | 0.0000 | |||
| 9 | 规模以上工业企业发明专利申请数 | pn | q | 0.4218 | 0.7319 | 0.5539 | 0.6844 | 0.5721 | 0.6241 | 0.6932 | 0.7046 |
| p | 0.0648 | 0.000 | 0.0096 | 0.0027 | 0.0417 | 0.0095 | 0.0020 | 0.0021 | |||
| 10 | 人均GDP | pgdp | q | 0.7612 | 0.7593 | 0.7672 | 0.7218 | 0.7721 | 0.8229 | 0.7787 | 0.7972 |
| p | 0.0000 | 0.0000 | 0.0000 | 0.0000 | 0.0000 | 0.0000 | 0.0000 | 0.0000 | |||
| 11 | 城镇化水平 | ul | q | 0.7388 | 0.7106 | 0.7210 | 0.7412 | 0.7397 | 0.7064 | 0.7513 | 0.7220 |
| p | 0.0000 | 0.0000 | 0.0000 | 0.0000 | 0.0000 | 0.0000 | 0.0000 | 0.0000 | |||
| 12 | 居民人均可支配收入 | pcdi | q | 0.8339 | 0.8378 | 0.8411 | 0.7633 | 0.8612 | 0.7857 | 0.8610 | 0.8674 |
| p | 0.0000 | 0.0000 | 0.0000 | 0.0000 | 0.0000 | 0.0000 | 0.0000 | 0.0000 |
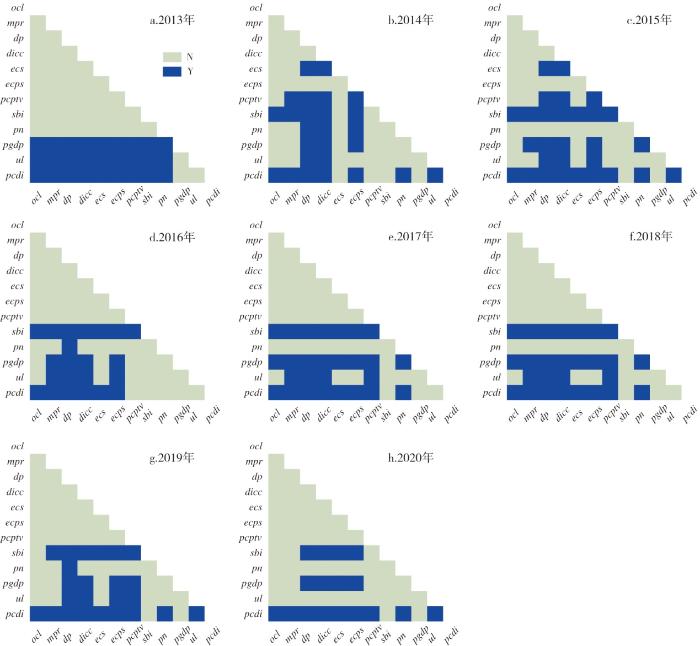
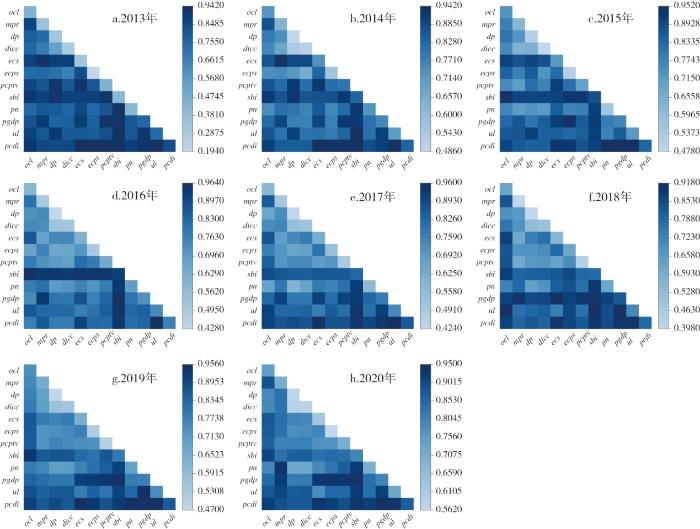
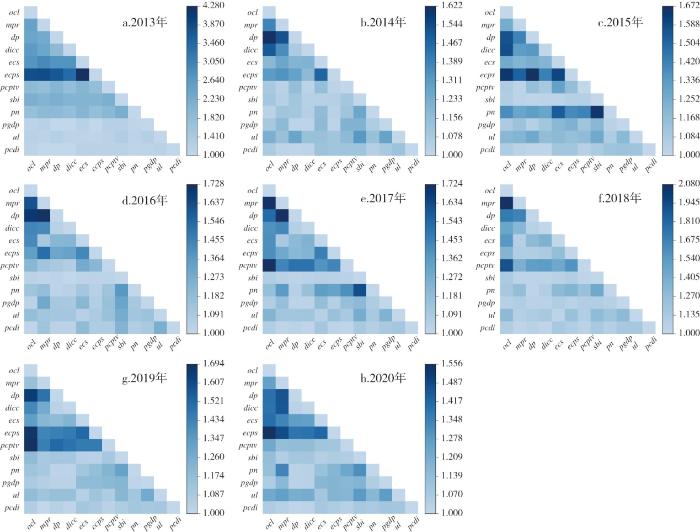
图5 中国省域居民消费差异驱动因素交互探测结果Fig.5 Interactive detection results of driving factors for consumption differences among provincial residents in China |
感谢中国科学院地理科学与资源研究所徐成东研究员给予的修改意见和建议。
| [1] |
刘导波, 张思麒. 数字经济赋能居民消费:理论机制与微观证据[J]. 消费经济, 2022, 38(1):72-82.
|
| [2] |
杨文辉. 利益格局与居民消费[J]. 经济研究, 2012, 47(Suppl):28-37.
|
| [3] |
|
| [4] |
邹红, 李奥蕾, 喻开志. 消费不平等的度量、出生组分解和形成机制——兼与收入不平等比较[J]. 经济学(季刊), 2013, 12(4):1231-1254.
|
| [5] |
陈志刚, 吕冰洋. 中国城镇居民收入和消费不平等的构成及其关系[J]. 经济理论与经济管理, 2016(12):32-45.
|
| [6] |
王小鲁, 樊纲. 中国地区差距的变动趋势和影响因素[J]. 经济研究, 2004(1):33-44.
|
| [7] |
陆地, 孙巍. 转型期收入空间分布不平衡与消费结构升级——基于中国家庭追踪调查数据的实证检验[J]. 消费经济, 2019, 35(4):27-37.
|
| [8] |
|
| [9] |
|
| [10] |
|
| [11] |
OUP. Digital Economy, Oxford Dictionary[D]. Oxford: Oxford University Press, 2017.
|
| [12] |
|
| [13] |
|
| [14] |
|
| [15] |
钟若愚, 曾洁华. 数字经济对居民消费的影响研究——基于空间杜宾模型的实证分析[J]. 经济问题探索, 2022(3):31-43.
|
| [16] |
邹新月, 王旺. 数字普惠金融对居民消费的影响研究——基于空间计量模型的实证分析[J]. 金融经济学研究, 2020, 35(4):133-145.
|
| [17] |
马德功, 韩喜昆, 赵新. 互联网消费金融对我国城镇居民消费行为的促进作用研究[J]. 现代财经(天津财经大学学报), 2017, 37(9):19-27.
|
| [18] |
张李义, 涂奔. 互联网金融信息优势对同业市场利率影响的实证研究——基于商业银行经营决策分析[J]. 财经论丛, 2018(2):47-57.
|
| [19] |
毛中根, 武优勐, 谢迟. 长三角城市群消费水平空间格局及其影响机制[J]. 经济地理, 2020, 40(12):56-62.
|
| [20] |
魏勇, 杨刚, 杨孟禹. 城镇居民消费升级特征与动因研判——基于空间溢出视角的实证研究[J]. 经济问题探索, 2017(1):51-63.
|
| [21] |
黄彩虹, 张晓青. 创新驱动、空间溢出与居民消费需求[J]. 经济问题探索, 2020(2):11-20.
|
| [22] |
王霞. 数字经济引领消费升级的本地效应与空间溢出效应[J]. 商业经济研究, 2022(2):68-71.
|
| [24] |
李浩, 黄繁华. 数字经济能否促进服务消费?[J]. 现代经济探讨, 2022(3):14-25,123.
|
| [25] |
焦帅涛, 孙秋碧. 数字经济发展与消费升级联动的机理及其实证研究[J]. 工业技术经济, 2021, 40(12):84-93.
|
| [26] |
谭恒鑫, 李欣雨, 朱小明. 数字经济时代的互联网普及与中国消费差异——基于CFPS2010—2018年数据的实证研究[J]. 宏观经济研究, 2022(2):83-106.
|
| [27] |
沈中奇. “互联网+零售” 对消费升级的影响——基于长三角区域差异性视角的实证[J]. 商业经济研究, 2020(22):39-42.
|
| [28] |
张彤进, 蔡宽宁. 数字普惠金融缩小城乡居民消费差距了吗?——基于中国省级面板数据的经验检验[J]. 经济问题, 2021(9):31-39.
|
| [29] |
徐蕾. 数字经济发展对消费不平等的破解效应与作用路径[J]. 商业经济研究, 2021(15):61-64.
|
| [30] |
胡月. 移动支付能提高我国居民消费支出吗?[D]. 西安: 陕西师范大学, 2020.
|
| [32] |
|
| [33] |
|
| [34] |
孙道亮, 洪步庭, 任平. 都江堰市农村居民点时空演变与驱动因素研究[J]. 长江流域资源与环境, 2020, 29(10):2167-2176.
|
| [35] |
李衡, 韩燕. 黄河流域PM2.5时空演变特征及其影响因素分析[J]. 世界地理研究, 2022, 31(1):130-141.
|
| [37] |
刘海龙, 管志涛. 中国电影产业时空演变特征及驱动因素[J]. 热带地理, 2021, 41(5):943-955.
|
| [38] |
刘宇, 周建新. 我国居民文化消费空间差异及驱动因素研究[J]. 统计与决策, 2020, 36(13):90-93.
|
| [39] |
高远. 数字普惠金融视角下我国零售业创新发展研究[J]. 商业经济研究, 2019(13):160-163.
|
| [40] |
艾天霞, 张慧芳. 中国省域居民消费升级模式的统计评价[J]. 统计与决策, 2019, 35(22):93-96.
|
| [41] |
潘明清, 高文亮. 我国城镇化对居民消费影响效应的检验与分析[J]. 宏观经济研究, 2014(1):118-125.
|
| [42] |
李红平. 城镇化水平、消费结构与居民消费升级关系实证分析[J]. 商业经济研究, 2018(11):40-43.
|
| [43] |
田长海, 刘锐. 消费金融促进消费升级的理论与实证分析[J]. 消费经济, 2013, 29(6):18-21,26.
|
| [44] |
郭峰, 王靖一, 王芳, 等. 测度中国数字普惠金融发展:指数编制与空间特征[J]. 经济学(季刊), 2020, 19(4):1401-1418.
|
| [45] |
吴腾. 基于PSO-BP神经网络的交通对城市碳排影响及预测分析[D]. 徐州: 中国矿业大学, 2022.
|
| [46] |
张庆华. 中国银行业网点分布、行业结构及影响因素分析[D]. 郑州: 河南大学, 2020.
|
| [47] |
何宗樾, 宋旭光. 数字金融发展如何影响居民消费[J]. 财贸经济, 2020, 41(8):65-79.
|
/
| 〈 |
|
〉 |