
Evolution and Obstacle Diagnosis of Agricultural Industry Chain Resilience in Wuling Mountains at the County Level
Received date: 2025-08-15
Revised date: 2025-12-05
Online published: 2026-02-04
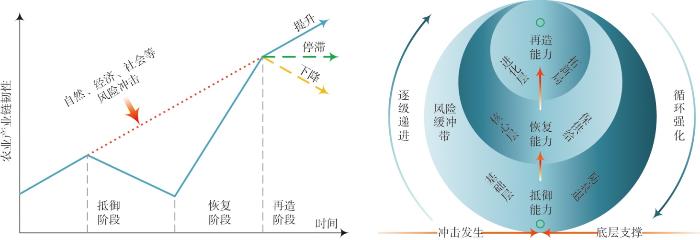
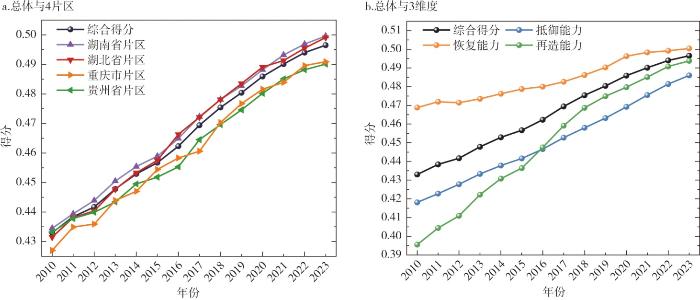
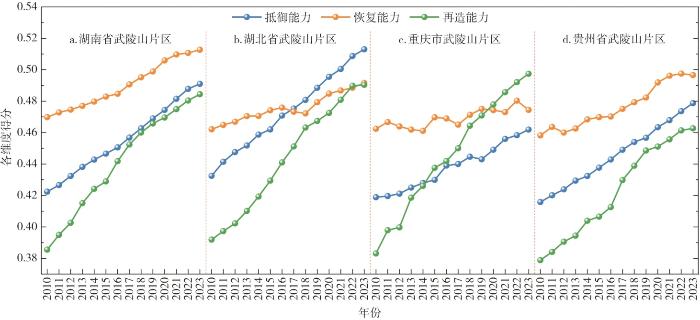
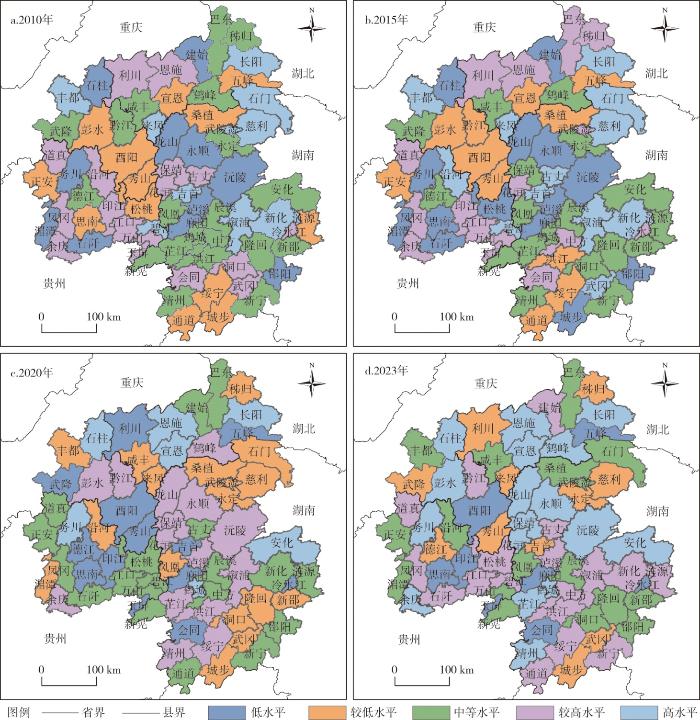
Enhancing the resilience of county-level agricultural industry chains is crucial for safeguarding the overall agricultural industry chain security. Taking 71 counties of Wuling Mountains as the research object, and employing the methods of the Dagum Gini coefficient, kernel density estimation, Markov chains, and obstacle degree model, this study assesses the resilience level of their agricultural industry chain from 2010 to 2023, and analyzes their regional disparities, evolutionary trends, and inhibiting factors. Findings indicate that: 1) The resilience of the agricultural industry chain in research area showed an overall upward trend, but there is still significant potential for improvement. The spatial pattern was characterized by gradient differentiation and polarization, with a pronounced Matthew effect of "the high-value areas getting higher and the low-value areas getting lower" and highlighting notable path dependence. 2) Over the study period, disparities between regions showed a gradual narrowing trend. The primary spatial source of differences was identified as hypervariable density, and cross-regional collaboration was still insufficient. 3) It's difficult to achieve balanced development in the short term, and there was a distinct "club convergence" feature within the fixed geographical scope. Progress in agricultural industry chain resilience tended to occur incrementally, and the risk of downward transfer needs to be prevented. 4) Enhancing the resilience, recovery ability and re-creation ability is the key breakthrough point for improving the resilience of the county-level agricultural industrial chain in Wuling Mountains. At the same time, consolidating a twofold foundation of talent development and seed industry is essential to underpin the high-quality development and sustainable development. In the future, within a multi-level framework of differentiated governance at the county level, coordinated collaboration among provinces, and alignment with national strategies, it should promote the construction of the resilience of agricultural industrial chain in county-level areas of Wuling Mountains, and thereby achieve the establishment of mechanisms and policy guarantees for the entire industrial chain and value chain of characteristic agriculture in rural areas.

YANG Jian , CHEN Jiaheng . Evolution and Obstacle Diagnosis of Agricultural Industry Chain Resilience in Wuling Mountains at the County Level[J]. Economic geography, 2025 , 45(12) : 166 -177 . DOI: 10.15957/j.cnki.jjdl.2025.12.017
表1 农业产业链韧性综合评价指标体系及说明Tab.1 Comprehensive evaluation index system and description for agricultural industry chain resilience |
| 系统 | 评估目标 | 指标层 | 指标说明 | 权重 | 文献来源 | 代码 |
|---|---|---|---|---|---|---|
| 抵 御 能 力 | 协同发展能力 | 产业服务化水平 | 农林牧渔服务业增加值/第一产业增加值 | 0.0472 | [4,9-11,17] | A1 |
| 乡村非农就业比 | 第二、三产业从业人员/乡村就业总人数 | 0.0365 | [4,17] | A2 | ||
| 农旅融合水平 | 休闲农业营业收入/第一产业增加值 | 0.0379 | [9-10,17] | A3 | ||
| 风险控制能力 | 风险分担力度 | 农业保险保费收入/农作物播种面积 | 0.0247 | [11,17] | A4 | |
| 农用资料价格波动水平 | 农业生产资料价格波动水平 | 0.0263 | [17,24] | A5 | ||
| 农产品价格波动水平 | 农产品生产价格波动水平 | 0.0259 | [17,24] | A6 | ||
| 种植业生产价格指数 | 种植业产品生产价格指数 | 0.0393 | [20,25] | A7 | ||
| 市场竞争能力 | 农业经营主体密度 | 区域内第一产业法人单位数占比 | 0.0461 | [17,24] | A8 | |
| 区内农产品市场集中度 | 区域内农产品市场交易额占比 | 0.0337 | [17,24] | A9 | ||
| 恢 复 能 力 | 经济效益水平 | 农业贡献率 | 第一产业增加值增长率 | 0.0666 | [4,9-11,20] | B1 |
| 农产品加工规模 | 农产品加工业主营业务收入 | 0.0402 | [10,17-18] | B2 | ||
| 供给保障水平 | 农膜施用强度 | 农用塑料薄膜使用量/播种面积 | 0.0325 | [4,7,12,18-20,22-23,27] | B3 | |
| 化肥施用强度 | 农用化肥施用量/播种面积 | 0.0275 | [4,12,18-20,22-23] | B4 | ||
| 农药施用强度 | 农药使用量/播种面积 | 0.0782 | [4,7,12,18-20,22-23] | B5 | ||
| 农田建设投入水平 | 农田基本建设作业量 | 0.0387 | [7,9,17-18] | B6 | ||
| 农村电商发展水平 | 淘宝村数量/行政村数量 | 0.0277 | [8,10,17] | B7 | ||
| 再 造 能 力 | 市场协同能力 | 谷物总产值增长率 | (当期谷物总产值-上期谷物总产值)/上期 谷物总体产值 | 0.0264 | [18,20] | C1 |
| 农产品国际贸易活跃度 | 农产品进出口总额/农业总产值 | 0.0481 | [12,18,20,27] | C2 | ||
| 金融协同能力 | 涉农贷款深度 | 涉农贷款余额/当地同期GDP | 0.0332 | [17,24] | C3 | |
| 数字金融指数 | 数字普惠金融指数 | 0.0317 | [8,10,12,17] | C4 | ||
| 政府协同能力 | 财政支农力度 | 农林水事务支出/地方财政支出 | 0.0355 | [4,7,9-11,17-18,23-24] | C5 | |
| 乡村人均固定资产投资 | 农林牧渔业固定资产投资额/乡村人口 | 0.0401 | [4,7,11,23] | C6 | ||
| 环境规制力度 | 工业污染治理完成投资额/工业增加值 | 0.0331 | [17,26-27] | C7 | ||
| 创新协同能力 | 农业研发人才投入水平 | 农业R&D全时人员当量 | 0.0626 | [7,10-12,17-18,20] | C8 | |
| 种业科技支撑能力 | 农业植物新品种申请数 | 0.0603 | [11,17-18] | C9 |
表2 武陵山区县域农业产业链韧性水平分级统计Tab.2 Statistical classification of county-level agricultural industry chain resilience in Wuling Mountains |
| 韧性水平类型 | 2010 | 2015 | 2020 | 2023 | |||||||
|---|---|---|---|---|---|---|---|---|---|---|---|
| 得分区间 | 县域数量(个) | 得分区间 | 县域数量(个) | 得分区间 | 县域数量(个) | 得分区间 | 县域数量(个) | ||||
| 低水平(Ⅰ) | (0.280,0.340] | 11 | (0.288,0.372] | 13 | (0.309~0.399] | 13 | (0.317,0.382] | 8 | |||
| 较低水平(Ⅱ) | (0.340,0.398] | 13 | (0.372,0.425] | 12 | (0.399~0.463] | 17 | (0.382,0.440] | 11 | |||
| 中等水平(Ⅲ) | (0.398,0.455] | 20 | (0.425,0.471] | 18 | (0.463~0.521] | 19 | (0.440,0.498] | 17 | |||
| 较高水平(Ⅳ) | (0.455,0.505] | 17 | (0.471,0.523] | 16 | (0.521~0.570] | 15 | (0.498,0.547] | 18 | |||
| 高水平(V) | (0.505,0.569] | 10 | (0.523,0.611] | 12 | (0.570~0.643] | 7 | (0.547,0.659] | 17 | |||
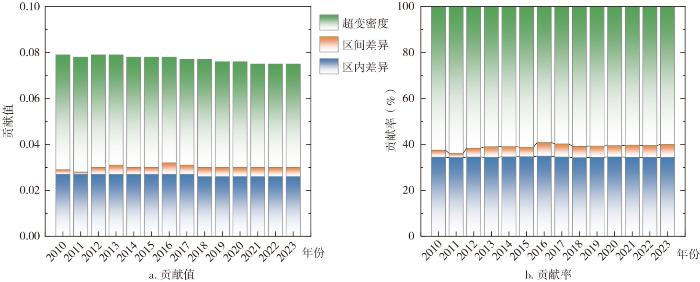
表3 武陵山区农业产业链韧性的空间分异规律Tab.3 Spatial differentiation patterns of agricultural industry chain resilience in Wuling Mountains |
| 年份 | 总体 | 区内基尼系数 | 区间基尼系数 | |||||||||
|---|---|---|---|---|---|---|---|---|---|---|---|---|
| 湖北 | 湖南 | 贵州 | 重庆 | 湖北—湖南 | 湖北—贵州 | 湖北—重庆 | 湖南—贵州 | 湖南—重庆 | 贵州—重庆 | |||
| 2010 | 0.079 | 0.095 | 0.074 | 0.085 | 0.048 | 0.088 | 0.092 | 0.081 | 0.080 | 0.066 | 0.073 | |
| 2011 | 0.079 | 0.097 | 0.073 | 0.085 | 0.048 | 0.089 | 0.093 | 0.082 | 0.080 | 0.064 | 0.072 | |
| 2012 | 0.079 | 0.096 | 0.074 | 0.085 | 0.049 | 0.088 | 0.092 | 0.081 | 0.081 | 0.066 | 0.072 | |
| 2013 | 0.079 | 0.103 | 0.074 | 0.083 | 0.040 | 0.092 | 0.096 | 0.084 | 0.079 | 0.063 | 0.068 | |
| 2014 | 0.078 | 0.099 | 0.074 | 0.081 | 0.040 | 0.089 | 0.093 | 0.082 | 0.078 | 0.062 | 0.067 | |
| 2015 | 0.078 | 0.101 | 0.074 | 0.080 | 0.035 | 0.090 | 0.093 | 0.082 | 0.078 | 0.060 | 0.064 | |
| 2016 | 0.079 | 0.099 | 0.076 | 0.080 | 0.037 | 0.090 | 0.092 | 0.080 | 0.079 | 0.062 | 0.065 | |
| 2017 | 0.077 | 0.098 | 0.073 | 0.081 | 0.034 | 0.088 | 0.093 | 0.080 | 0.078 | 0.061 | 0.064 | |
| 2018 | 0.077 | 0.099 | 0.071 | 0.082 | 0.036 | 0.088 | 0.093 | 0.081 | 0.078 | 0.061 | 0.066 | |
| 2019 | 0.076 | 0.096 | 0.071 | 0.081 | 0.036 | 0.086 | 0.091 | 0.078 | 0.077 | 0.061 | 0.065 | |
| 2020 | 0.076 | 0.098 | 0.072 | 0.079 | 0.037 | 0.088 | 0.091 | 0.079 | 0.077 | 0.061 | 0.064 | |
| 2021 | 0.075 | 0.097 | 0.070 | 0.078 | 0.037 | 0.086 | 0.090 | 0.079 | 0.075 | 0.060 | 0.064 | |
| 2022 | 0.075 | 0.097 | 0.070 | 0.079 | 0.034 | 0.086 | 0.090 | 0.078 | 0.076 | 0.059 | 0.063 | |
| 2023 | 0.074 | 0.095 | 0.069 | 0.080 | 0.036 | 0.085 | 0.090 | 0.076 | 0.076 | 0.059 | 0.064 | |
| 均值 | 0.077 | 0.098 | 0.073 | 0.081 | 0.039 | 0.088 | 0.092 | 0.080 | 0.078 | 0.062 | 0.067 | |
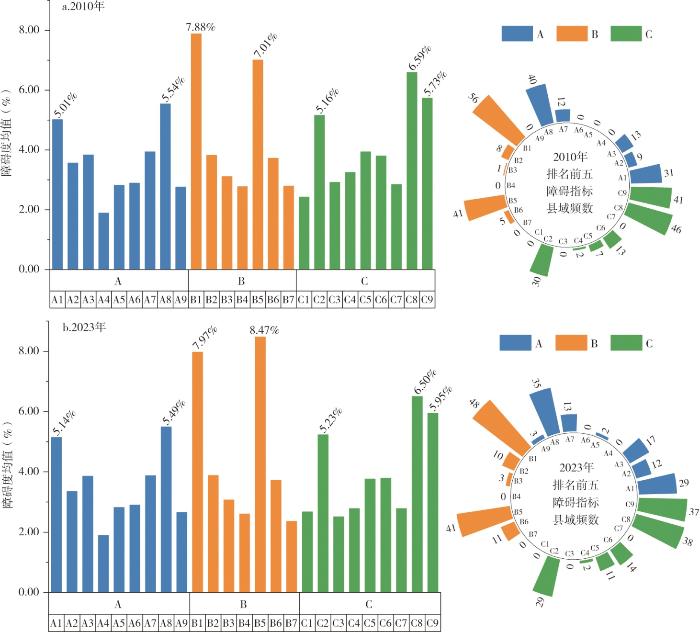
表4 武陵山区县域农业产业链韧性系统层障碍度Tab.4 Obstacle degree of the county-level agricultural industry chain resilience in Wuling Mountains |
| 系统 | 障碍度均值(%) | 考察期 年均值 | |||
|---|---|---|---|---|---|
| 2010 | 2015 | 2020 | 2023 | ||
| A | 32.24 | 32.29 | 32.43 | 31.97 | 32.30 |
| B | 31.10 | 31.32 | 31.69 | 32.06 | 31.52 |
| C | 36.66 | 36.39 | 35.88 | 35.97 | 36.19 |
| [1] |
李萍, 何瑞石, 宋晓松. 有效提升我国农业产业链供应链韧性[J]. 宏观经济管理, 2024(2):61-69.
|
| [2] |
金文成, 靳少泽. 加快建设农业强国:现实基础、国际经验与路径选择[J]. 中国农村经济, 2023(1):18-32.
|
| [3] |
魏丽莉, 张晶. 中国共产党领导下所有制变革推进经济韧性提升[J]. 上海经济研究, 2021(5):5-18.
|
| [4] |
郝爱民, 谭家银. 农村产业融合赋能农业韧性的机理及效应测度[J]. 农业技术经济, 2023(7):88-107.
|
| [5] |
张玉梅, 龙文进. 大食物观下农业产业链韧性面临挑战及提升对策[J]. 中州学刊, 2023(4):54-61.
|
| [6] |
陈军亚. 韧性小农:历史延续与现代转换——中国小农户的生命力及自主责任机制[J]. 中国社会科学, 2019(12):82-99,201.
|
| [7] |
王珊珊, 高铭阳, 吕杰. 数字经济、产业融合、农业产业链韧性:指数测算与效应检验[J]. 统计与决策, 2025, 41(2):11-16.
|
| [8] |
李媛, 熊婉辰, 任保平, 等. 中国农业数字化水平的区域差异、动态演进与形成机理[J]. 经济与管理评论, 2025, 41(1):148-160.
|
| [9] |
曾雄旺, 张湘琦, 李志胜, 等. 数字普惠金融对农业产业链韧性影响的空间效应[J]. 经济地理, 2025, 45(2):183-191.
|
| [10] |
曾雄旺, 张湘琦, 左声亮, 等. 中国中部地区农业产业链韧性时空分异及其影响因素——基于2011—2022年80个地级区域数据[J]. 地理科学进展, 2025, 44(9):1807-1818.
|
| [11] |
吕雅辉, 袁佳伟, 张斯琪, 等. 农业产业链韧性、区域差异及动态演进[J]. 统计与决策, 2025, 41(3):87-93.
|
| [12] |
王缙, 宾厚. 长江经济带农产品供应链韧性区域差异、时空演进及障碍因子[J]. 长江流域资源与环境, 2025, 34(8):1867-1880.
|
| [13] |
肖兴志, 王振宇, 李少林. 产业链韧性测度方法研究进展[J]. 经济学动态, 2024(4):144-160.
|
| [14] |
管宁宁, 黄惠春. 农业产业链服务对农户生产效率的影响——内在机理与实证检验[J]. 长江流域资源与环境, 2023, 32(11):2418-2430.
|
| [15] |
陈燕武, 李育恒. 福建省农业产业链变迁及其优化[J]. 华侨大学学报(哲学社会科学版), 2021(1):76-88.
|
| [16] |
陈明星. 粮食安全韧性:内在机理、重塑路径与提升策略[J]. 贵州社会科学, 2023(11):120-128.
|
| [17] |
郝爱民, 解梦菡, 刘育廷. 农业产业链韧性水平测度与时空演变[J]. 统计与决策, 2024, 40(16):95-100.
|
| [18] |
田相辉, 黄子勇. 中国农业产业韧性水平的区域差异与时空演变[J]. 统计与决策, 2024, 40(15):104-109.
|
| [19] |
于伟, 张鹏. 中国农业发展韧性时空分异特征及影响因素研究[J]. 地理与地理信息科学, 2019, 35(1):102-108.
|
| [20] |
戴媛媛. 中国粮食产业链供应链韧性分布动态与区域差距[J]. 统计与决策, 2024, 40(18):114-119.
|
| [21] |
隋建利, 李悦欣, 刘金全. 中国经济韧性的时空敛散与异质分化特征——基于马尔科夫区制转移混频动态因子模型的识别[J]. 管理世界, 2024, 40(3):16-36,73,37.
|
| [22] |
罗海平, 王佳铖, 胡学英, 等. 粮食主产区粮食安全与生态安全脆弱性耦合研究[J]. 统计与信息论坛, 2023, 38(7):117-128.
|
| [23] |
郑家喜, 赵妍, 卫增, 等. 基于空间马尔科夫链的粮食生产韧性动态演进及趋势预测[J]. 华中农业大学学报(社会科学版), 2024(3):104-117.
|
| [24] |
贺亚亚, 陈真, 周迪. 数字乡村建设提升农业产业链韧性的效应、机理与路径研究[J/OL]. 中国农业资源与区划:1-14[2025-10-21].
|
| [25] |
王新刚, 司伟, 冯晓龙, 等. 大豆生产者补贴对农户土地投入决策的影响——基于全国农村固定观察点调查数据的实证分析[J]. 中国农村观察, 2023(1):20-39.
|
| [26] |
熊媛媛, 余国新, 谢树青. 农业生产性服务对农业全要素碳生产率的提升效应[J]. 干旱区资源与环境, 2025, 39(11):21-32.
|
| [27] |
姬志恒. 中国农业农村高质量发展的空间差异及驱动机制[J]. 数量经济技术经济研究, 2021, 38(12):25-44.
|
| [28] |
秦琳贵, 刘松岐, 沈体雁, 等. 农业产业化国家重点龙头企业空间布局及其影响因素的异质性[J]. 经济地理, 2025, 45(9):110-118.
|
| [29] |
徐永慧, 尹朝静. 环境规制下中国农业绿色全要素生产率的测算[J]. 统计与决策, 2021, 37(18):50-54.
|
| [30] |
|
| [31] |
张耀光. 最小方差在农业类型(或农业区)划分中的应用——以我国粮食作物结构类型划分为例[J]. 经济地理, 1986(1):49-55.
|
| [32] |
陈培阳, 朱喜钢. 中国区域经济趋同:基于县级尺度的空间马尔可夫链分析[J]. 地理科学, 2013, 33(11):1302-1308.
|
/
| 〈 |
|
〉 |