
Spatiotemporal Evolution and Influencing Factors of Intercity Real Estate Investment Flows in the Yangtze River Delta Based on Equity Investment
Received date: 2024-03-19
Revised date: 2024-09-10
Online published: 2026-02-04
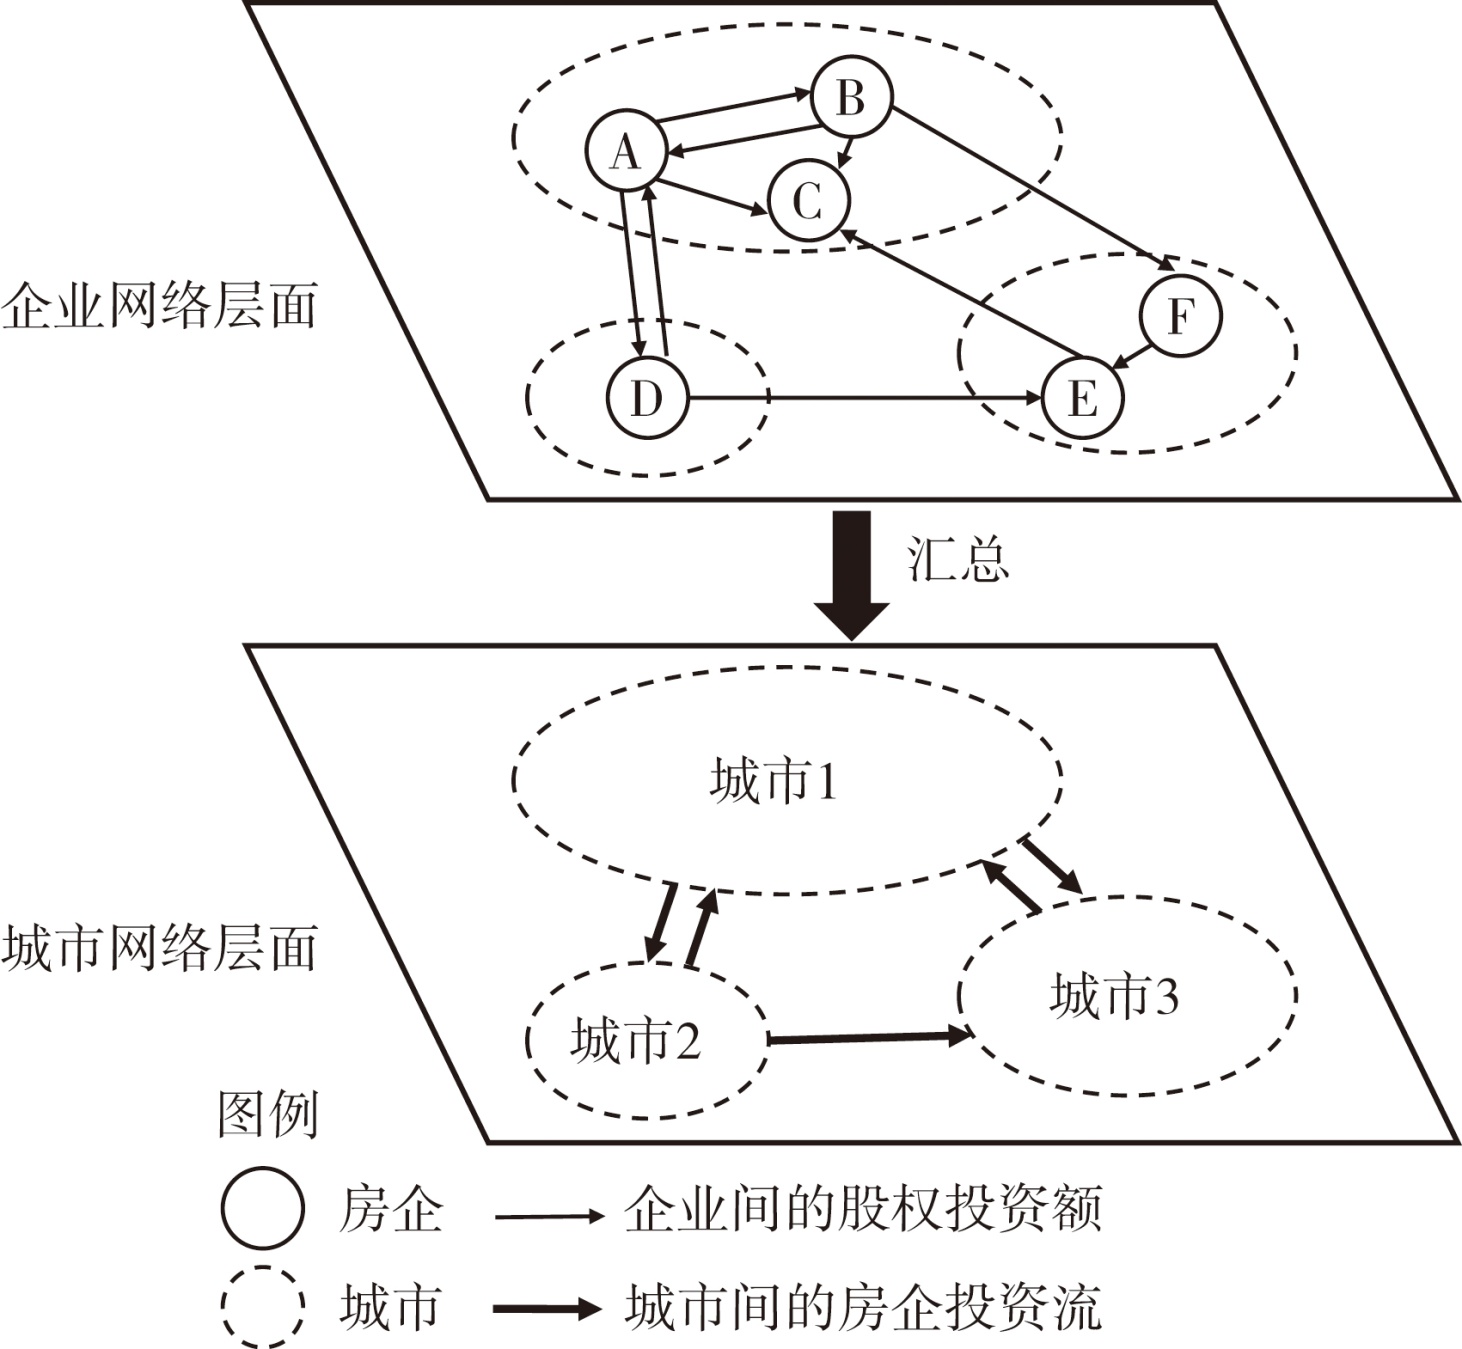
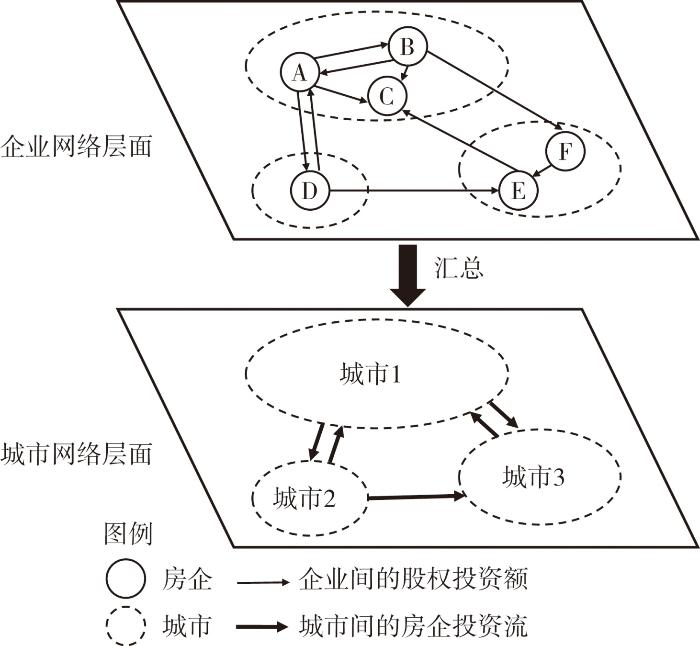
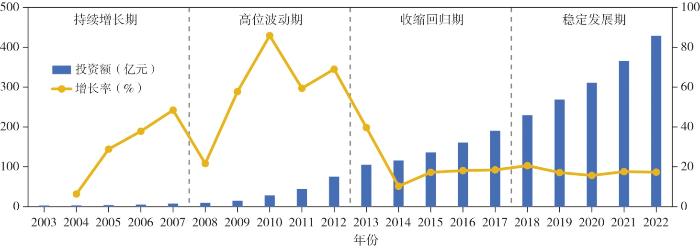
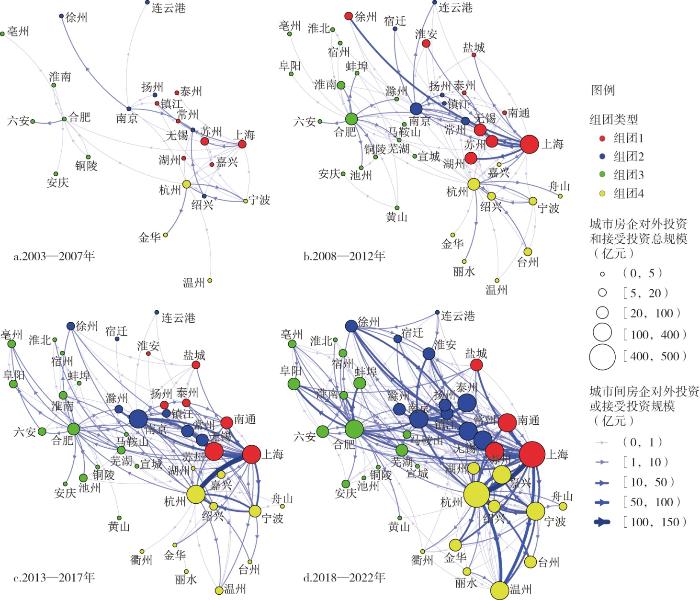
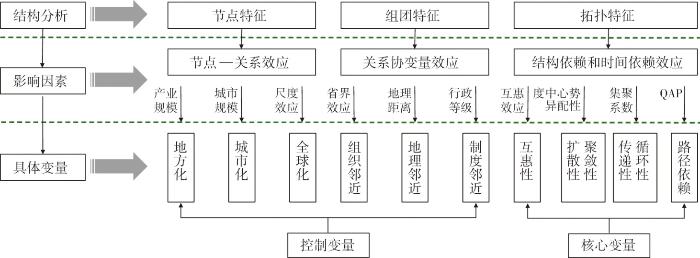
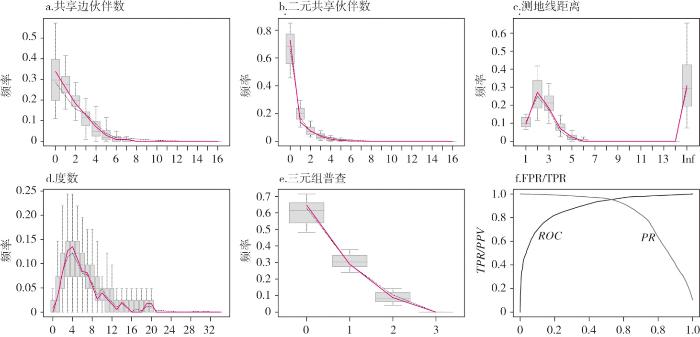
The intercity investment of real estate enterprises drives the flows of regional capital, information, talents, and technology, and promotes the dynamic reconstruction of the real estate market, thus becoming an important aspect for the coordinated development of real estate market and regional integration. Based on the equity investment data of real estate enterprises, this study constructed directed networks of intercity real estate investment in the Yangtze River Delta network for four periods from 2003 to 2022. After the analysis of network structures from the perspectives of micro nodes, meso communities, and macro topologies, temporal exponential random graph models were built to explore the influencing factors underlying intercity real estate investment in the Yangtze River Delta through the lens of urban attribute, intercity proximity, and structural endogeneity. The results show that: 1) The intercity real estate investment networks in the Yangtze River Delta present a distinct core-periphery structure, with Shanghai-Nanjing-Hangzhou-Heifei-Ningbo Z-shaped corridor becoming increasingly apparent. The scale of real estate capital flows in Shanghai has always ranked the first, forming a monocentric radial community with Suzhou, Nantong, and Yancheng, which together with provincial communities of Jiangsu, Zhejiang, and Anhui constitutes four major communities in the region. 2) The investment scale and radiation scope of intercity real estate in the Yangtze River Delta are gradually expanding. The disassortativity increased first and then decreases, and the reciprocity continues to strengthen. The weakening of vertical investment and the mutual feedback of two-way investment promote the development of the investment network towards a polycentric and balanced structure, while the deepening of intercity interaction and dependence promote the development of the investment network towards a clustering structure. The network evolution is generally stable but changing to some extent. 3) Intercity real estate investment and its evolution in the Yangtze River Delta are driven by both endogenous and exogenous forces. The degree of urbanization, localization and globalization has differential effects on investing cities and attracting cities. The endogenous structural dependence and time dependence effects of the network are important driving forces, including mutuality, activity, transitivity, stability, and variability.
DAI Liang , DING Zijun , ZHENG Huibin , WANG Song . Spatiotemporal Evolution and Influencing Factors of Intercity Real Estate Investment Flows in the Yangtze River Delta Based on Equity Investment[J]. Economic geography, 2025 , 45(12) : 124 -136 . DOI: 10.15957/j.cnki.jjdl.2025.12.013
表1 2003—2022年长三角城际房地产投资网络排名前十的城市Tab.1 City rankings of intercity real estate investment networks in the Yangtze River Delta |
| 排名 | 2003—2007年 | 2008—2012年 | 2013—2017年 | 2018—2022年 | |||||||||||
|---|---|---|---|---|---|---|---|---|---|---|---|---|---|---|---|
| 中心性 | 投资额 | 引资额 | 中心性 | 投资额 | 引资额 | 中心性 | 投资额 | 引资额 | 中心性 | 投资额 | 引资额 | ||||
| 1 | 上海 | 上海 | 苏州 | 上海 | 上海 | 湖州 | 上海 | 上海 | 上海 | 上海 | 上海 | 杭州 | |||
| 2 | 杭州 | 杭州 | 无锡 | 苏州 | 合肥 | 苏州 | 杭州 | 杭州 | 苏州 | 杭州 | 杭州 | 苏州 | |||
| 3 | 苏州 | 南京 | 镇江 | 湖州 | 南京 | 无锡 | 苏州 | 南京 | 南通 | 南京 | 南京 | 南京 | |||
| 4 | 无锡 | 绍兴 | 宁波 | 合肥 | 杭州 | 徐州 | 南京 | 合肥 | 南京 | 苏州 | 宁波 | 温州 | |||
| 5 | 宁波 | 宁波 | 杭州 | 南京 | 苏州 | 上海 | 合肥 | 苏州 | 无锡 | 合肥 | 合肥 | 南通 | |||
| 6 | 南京 | 合肥 | 徐州 | 无锡 | 淮南 | 杭州 | 宁波 | 宁波 | 宁波 | 宁波 | 泰州 | 合肥 | |||
| 7 | 绍兴 | 苏州 | 上海 | 杭州 | 常州 | 合肥 | 南通 | 芜湖 | 杭州 | 温州 | 常州 | 无锡 | |||
| 8 | 镇江 | 常州 | 六安 | 徐州 | 宁波 | 淮安 | 无锡 | 六安 | 常州 | 南通 | 苏州 | 上海 | |||
| 9 | 合肥 | 铜陵 | 金华 | 淮南 | 泰州 | 南京 | 常州 | 泰州 | 合肥 | 常州 | 嘉兴 | 嘉兴 | |||
| 10 | 徐州 | 淮南 | 绍兴 | 常州 | 芜湖 | 绍兴 | 亳州 | 淮南 | 亳州 | 嘉兴 | 镇江 | 宁波 | |||
表2 2003—2022年长三角城际房地产投资网络的统计特征Tab.2 Statistical properties of intercity real estate investment networks in the Yangtze River Delta |
| 指标 | 2003—2007 | 2008—2012 | 2013—2017 | 2018—2022 |
|---|---|---|---|---|
| 节点数(个) | 23 | 40 | 41 | 41 |
| 边数(条) | 39 | 96 | 152 | 271 |
| 网络密度 | 0.024 | 0.059 | 0.093 | 0.165 |
| 平均度 | 1.024 | 2.341 | 3.707 | 6.610 |
| 平均加权度 | 0.988 | 5.335 | 14.734 | 42.274 |
| 度中心势 | 0.236 | 0.438 | 0.507 | 0.641 |
| 出度中心势 | 0.230 | 0.427 | 0.494 | 0.625 |
| 入度中心势 | 0.102 | 0.094 | 0.110 | 0.266 |
| 互惠性 | 0.077 | 0.103 | 0.169 | 0.284 |
| 度相关性 | -0.273 | -0.483 | -0.311 | -0.253 |
| 平均路径长度 | 2.735 | 2.479 | 2.026 | 1.678 |
| 全局集聚系数 | 0.210 | 0.227 | 0.368 | 0.460 |
| QAP相关性 | / | 0.470 | 0.586 | 0.651 |
表3 动态指数随机图模型的统计量Tab.3 Statistics of temporal exponential random graph models |
| 网络特征 | 统计量 | 局部构型 | 变量解释 | |
|---|---|---|---|---|
| 基础项 | 边 | edges |  | 产生跨城投资的基准倾向,类似于常数项 |
| 节点特征 | 发送者效应 | nodeocov(Hemp) nodeocov(Uemp) nodeocov(FDI) |  | 地方化、城市化、全球化程度影响城市投资的支配力 |
| 接收者效应 | nodeicov(Hemp) nodeicov(Uemp) nodeocov(FDI) |  | 地方化、城市化、全球化程度影响城市投资的吸引力 | |
| 组团特征 | 趋同性 | nodematch(pro) nodematch(adm) |  | 组织、制度与地理邻近影响城际投资的交互强度 |
| 协网络 | edgecov(geo) |  | ||
| 拓扑特征 | 当期互惠性 | mutual |  | 单向投资在本期获得回馈互惠的倾向 |
| 延迟互惠性 | delrecip |  | 单向投资在下期获得回馈互惠的倾向 | |
| 扩张性 | gwodegree |  | 城市投资流呈星形分布的倾向 | |
| 聚敛性 | gwidegree |  | 城市引资流呈星形分布的倾向 | |
| 传递性 | ttriple |  | 三个城市间形成等级传递式资本流动关系的倾向 | |
| 循环性 | ctriple |  | 三个城市间形成扁平循环式资本流动关系的倾向 | |
| 稳定性 | stability |  | 两城市间投资关系保持不变的倾向 | |
| 变异性 | variability |  | 两城市间投资关系从无到有的倾向 | |
表4 动态指数随机图模型的拟合结果Tab.4 Estimation results of temporal exponential random graph models |
| 类型 | 统计量 | 模型1 | 模型2 | 模型3 | 模型4 | 模型5 | 模型6 |
|---|---|---|---|---|---|---|---|
| 基础项 | edges | -23.459*** | -23.534*** | -23.271*** | -21.413*** | -17.961*** | -15.408*** |
| 城市节点属性 | nodeocov(Hemp) | 0.210* | 0.203* | 0.144 | 0.118 | 0.086 | 0.048 |
| nodeocov(Uemp) | 0.630*** | 0.629*** | 0.608*** | 0.601*** | 0.494*** | 0.492*** | |
| nodeocov(FDI) | 0.352*** | 0.323*** | 0.321*** | 0.303*** | 0.291** | 0.260** | |
| nodeicov(Hemp) | 1.370*** | 1.369*** | 1.312*** | 1.169*** | 0.912*** | 0.778*** | |
| nodeicov(Uemp) | 0.378* | 0.322* | 0.217 | 0.157 | 0.057 | 0.012 | |
| nodeicov(FDI) | 0.397*** | 0.369*** | 0.368*** | 0.269*** | 0.215** | 0.172* | |
| 城际关系属性 | nodematch(pro) | 2.276*** | 2.271*** | 2.251*** | 2.236*** | 2.126*** | 1.928*** |
| nodematch(adm) | -0.297* | -0.342* | -0.376** | -0.415** | -0.601*** | -0.552** | |
| edgecov(geo) | -0.631*** | -0.704*** | -0.748*** | -0.768*** | -0.768*** | -0.773*** | |
| 内生结构属性 | mutual | 1.980*** | 1.051*** | 1.017*** | 0.974*** | 0.882*** | |
| delrecip | 1.857*** | 1.789*** | 1.385*** | 1.225*** | |||
| gwodegree | 1.731* | 2.589** | 2.349** | ||||
| gwidegree | -2.073*** | -1.668*** | -1.732*** | ||||
| ttriple | 0.136*** | 0.121*** | |||||
| ctriple | -0.164* | -0.135* | |||||
| stability | 0.644*** | ||||||
| variability | -1.293*** |
注:***表示p<0.001,**表示p<0.01,*表示p<0.05;为节省版面,标准误数值不显示。 |
表5 拟合结果的稳健性检验Tab.5 Robustness tests of estimation results |
| 模型6~8统计量 | 模型6 | 模型7 | 模型8 | 模型9统计量 | 模型9 |
|---|---|---|---|---|---|
| (基准参照) | (MPLE估计) | (3年窗口) | (变量替换) | ||
| edges | -15.408*** | -16.794# | -13.552*** | edges | -11.070*** |
| nodeocov(Hemp) | 0.048 | 0.038# | 0.043 | nodeocov(firm) | 0.037 |
| nodeocov(Uemp) | 0.492*** | 0.316# | 0.515*** | nodeocov(POP) | 0.338** |
| nodeocov(FDI) | 0.260** | 0.329# | 0.272** | nodeocov(FIE) | 0.242*** |
| nodeicov(Hemp) | 0.778*** | 0.847# | 0.808*** | nodeicov(firm) | 0.652*** |
| nodeicov(Uemp) | 0.012 | 0.021# | 0.04 | nodeicov(POP) | 0.031 |
| nodeicov(FDI) | 0.172* | 0.210# | 0.267** | nodeicov(FIE) | 0.229** |
| nodematch(pro) | 1.928*** | 1.940# | 1.853*** | nodematch(pro) | 1.436*** |
| nodematch(adm) | -0.552** | -0.447# | -0.611* | nodematch(adm) | -0.633*** |
| edgecov(geo) | -0.773*** | -0.681# | -0.587*** | edgecov(geo) | -0.793*** |
| mutual | 0.882*** | 0.758# | 0.810*** | mutual | 0.886*** |
| delrecip | 0.974*** | 0.878# | 0.966*** | delrecip | 0.901*** |
| gwodegree | 2.349** | 2.235# | 1.201** | gwodegree | 2.871** |
| gwidegree | -1.732*** | -1.532# | -1.753*** | gwidegree | -1.858*** |
| ttriple | 0.121*** | 0.277# | 0.132*** | ttriple | 0.128*** |
| ctriple | -0.135* | -0.249# | -0.161* | ctriple | -0.187** |
| stability | 0.644*** | 0.582# | 0.576*** | stability | 0.793*** |
| variability | -1.293*** | -1.164# | -1.172*** | variability | -1.592*** |
注:***表示p<0.001,**表示p<0.01,*表示p<0.05;#表示0不在置信区间。 |
| [1] |
宋伟轩, 陈艳如, 孙洁, 等. 长三角一体化区域城市房价空间分异的模式与效应[J]. 地理学报, 2020, 75(10):2109-2125.
|
| [2] |
宋伟轩, 曹辉, 涂唐奇, 等. 南京主城区优质教育资源导向的学区绅士化研究[J]. 地理学报, 2023, 78(4):792-810.
|
| [3] |
尹上岗, 杨山, 陈艳如, 等. 长三角房价收入比时空演变格局及收敛性研究[J]. 地理研究, 2020, 39(11):2521-2536.
|
| [4] |
周小平, 秦振扬, 赵松, 等. 中国住宅地价房价比的空间格局、演变特征及影响因素:基于35个大中城市的空间计量分析[J]. 中国土地科学, 2019, 33(1):40-48.
|
| [5] |
陈艳如, 谷跃, 宋伟轩. 中国城市房价、收入与房价收入比的时空分异格局[J]. 地理研究, 2021, 40(9):2442-2458.
|
| [6] |
|
| [7] |
王磊, 李安琪, 杨文毅, 等. 城际房地产消费流的空间格局与驱动因素研究:以长江中游城市群为例[J]. 湖北社会科学, 2019(12):46-55.
|
| [8] |
纪宇凡, 戴靓, 丁子军, 等. 中国城市房地产企业网络的结构特征[J]. 资源开发与市场, 2022, 38(2):156-162.
|
| [9] |
魏冶, 修春亮, 刘志敏, 等. 春运人口流动透视的转型期中国城市网络结构[J]. 地理科学, 2016, 36(11):1654-1660.
|
| [10] |
宓泽锋, 曾刚. 不同尺度下长江经济带物流联系格局、特征及影响因素研究[J]. 地理科学, 2018, 38(7):1079-1088.
|
| [11] |
戴俊骋, 谢帆, 那鲲鹏. 基于百度指数的大运河沿线城市信息流网络特征研究[J]. 城市发展研究, 2022, 29(8):7-13.
|
| [12] |
龚言浩, 甄峰, 席广亮, 等. 基于微信公众号文章的城市关注度等级与联系网络研究[J]. 现代城市研究, 2019(4):69-75,131.
|
| [13] |
|
| [14] |
秦娅风, 郭建科, 董梦如, 等. 基于企业投资行为的中国沿海城市产业网络空间联系特征[J]. 地域研究与开发, 2021, 40(6):19-24.
|
| [15] |
徐宁, 李仙德. 上海上市公司对外投资网络演变及其影响因素研究[J]. 地理科学进展, 2020, 39(4):553-566.
|
| [16] |
汪传江. 中国城市间投资网络的结构特征与演化分析:基于企业并购视[J]. 工业技术经济, 2019, 38(2):87-96.
|
| [17] |
李聪, 卢明华, 张金哲, 等. 京津冀城市群产业投资网络演变及影响因素研究[J]. 人文地理, 2022, 37(5):162-170.
|
| [18] |
李哲睿, 甄峰, 傅行行. 基于企业股权关联的城市网络研究:以长三角地区为例[J]. 地理科学, 2019, 39(11):1763-1770.
|
| [19] |
|
| [20] |
盛科荣, 张红霞, 赵超越. 中国城市网络关联格局的影响因素分析:基于电子信息企业网络的视角[J]. 地理研究, 2019, 38(5):32-46.
|
| [21] |
杨洋, 杨翼昂, 夏敏. 长三角一体化:文献述评与研究展望[J]. 研究与发展管理, 2023, 35(2):1-14.
|
| [22] |
|
| [23] |
王姣娥, 莫辉辉, 金凤君. 中国航空网络空间结构的复杂性[J]. 地理学报, 2009, 64(8):899-910.
|
| [24] |
戴靓, 丁子军, 曹湛, 等. 长三角地区城市协同创新网络的演化特征及其驱动力[J]. 资源科学, 2023, 45(5):1006-1019.
|
| [25] |
|
| [26] |
|
| [27] |
唐子来, 赵渺希. 经济全球化视角下长三角区域的城市体系演化:关联网络和价值区段的分析方法[J]. 城市规划学刊, 2010(1):29-34.
|
| [28] |
胡志强, 苗长虹, 华明芳, 等. 中国外商投资区位选择的时空格局与影响因素[J]. 人文地理, 2018, 33(5):88-96.
|
| [29] |
于瀚辰, 周麟, 沈体雁. 制造业企业区位选择集聚经济指向的空间效应[J]. 地理研究, 2019, 38(2):273-284.
|
| [30] |
高鹏, 何丹, 宁越敏, 等. 长三角地区城市投资联系水平的时空动态及影响因素[J]. 地理研究, 2021, 40(10):2760-2779.
|
| [31] |
|
| [32] |
|
| [33] |
|
| [34] |
刘林青, 闫小斐, 杨理斯, 等. 国际贸易依赖网络的演化及内生机制研究[J]. 中国工业经济, 2021(2):98-116.
|
| [35] |
罗超亮, 符正平, 刘冰, 等. 战略性新兴产业国际贸易网络的演化及动力机制研究[J]. 国际贸易问题, 2022(3):121-139.
|
| [36] |
唐晓彬, 崔茂生. “一带一路”货物贸易网络结构动态变化及其影响机制[J]. 财经研究, 2020, 46(7):138-153.
|
| [37] |
程风雨. 粤港澳大湾区科技创新的空间关联及其驱动机制[J]. 统计与决策, 2022, 38(20):77-82.
|
| [38] |
|
| [39] |
康江江, 徐伟, 宁越敏. 基于地方化、城市化和全球化制造业空间集聚分析:以长三角区域为例[J]. 地理科学, 2021, 41(10):1773-1782.
|
| [40] |
|
| [41] |
|
| [42] |
刘林青, 陈紫若, 田毕飞. 结构依赖如何影响贸易网络形成及演化:以“一带一路”为例[J]. 世界经济研究, 2020(6):106-120,137.
|
/
| 〈 |
|
〉 |