
Spatiotemporal Changes of Ecosystem Service Value and Its Driving Factors in the Middle Reaches of the Yangtze River Urban Agglomeration
Received date: 2025-04-19
Revised date: 2025-10-18
Online published: 2025-12-23
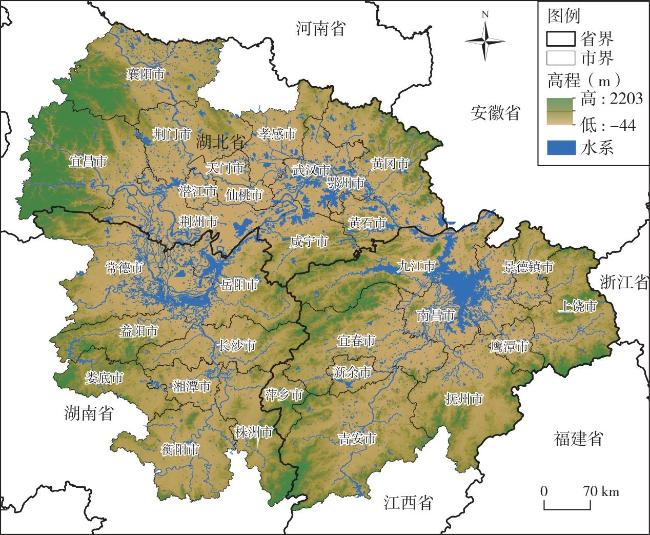
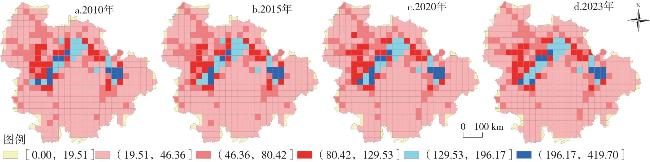
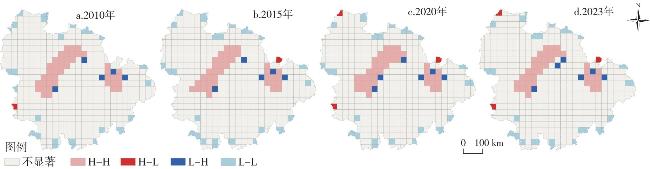
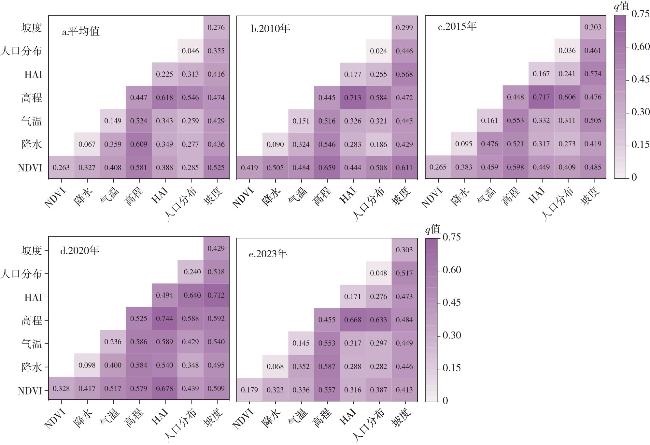
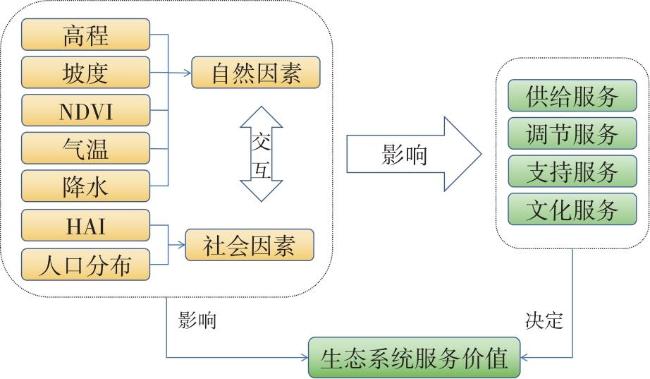
This study focuses on the coordinated relationship between regional economic development and ecological protection, taking the Middle Reaches of the Yangtze River Urban Agglomeration from 2010 to 2023 as the research object. It adopts methods such as the equivalent factor method with correction coefficients, spatial autocorrelation analysis, and geographical detector to systematically examine the spatiotemporal evolution features of the Ecosystem Service Value (ESV) in this urban agglomeration, and explores the key driving factors of its spatial differentiation, and clarifies the interaction paths and mechanisms among various driving factors. The results show that: 1) The ESV of the Middle Reaches of the Yangtze River Urban Agglomeration exhibited an increasing tendency from 2010 to 2015, and a downward trend from 2015 to 2023. Woodland and water areas are the main land types contributing to ESV, and the value of hydrological regulation services dominates among various ecological functions. 2) There is a significant positive spatial correlation of ESV in the study area, with the agglomeration effect generally enhanced. The spatial distribution presents a pattern of "concentrated high-value areas and extensive low-value areas". High-value areas are mainly distributed in water areas such as Dongting Lake and Poyang Lake and surrounding areas with good ecological conditions, while low-value areas are concentrated in the core urban areas of Wuhan, Changsha, Nanchang and other cities. 3) The spatial differentiation of ESV in the middle reaches of the Yangtze River Urban Agglomeration is affected by the coupling effect of natural and social factors. Among them, elevation is the primary factor affecting the spatial differentiation of ESV, followed by slope, NDVI (Normalized Difference Vegetation Index) and Human Activity Index (HAI). The interaction between any two factors is stronger than the impact of a single factor, and the interaction between elevation and HAI is the strongest, which reflects that topographic conditions and human activities jointly shape the spatial pattern of ESV.
LIU Zhifei , LUO Xinyi , LIU Anni , LI Han . Spatiotemporal Changes of Ecosystem Service Value and Its Driving Factors in the Middle Reaches of the Yangtze River Urban Agglomeration[J]. Economic geography, 2025 , 45(11) : 213 -222 . DOI: 10.15957/j.cnki.jjdl.2025.11.021
表1 长江中游城市群生态系统服务价值系数表(元/hm2)Tab.1 Ecosystem service value coefficient table of the middle reaches of the Yangtze River Urban Agglomeration(yuan/hm2) |
| 生态系统服务类型 | 土地利用类型 | |||||||
|---|---|---|---|---|---|---|---|---|
| 一级服务 | 二级服务 | 耕地 | 林地 | 草地 | 水域 | 建设用地 | 未利用地 | |
| 供给服务 | 食物生产 | 1364.07 | 311.70 | 288.04 | 987.56 | 0.00 | 6.17 | |
| 原料生产 | 302.44 | 715.98 | 423.83 | 283.92 | 0.00 | 18.52 | ||
| 水资源供给 | -6873.05 | 1580.01 | 1000.67 | 43660.99 | 0.00 | 52.67 | ||
| 调节服务 | 气体调节 | 1098.66 | 2354.71 | 1489.57 | 950.53 | 0.00 | 80.24 | |
| 气候调节 | 574.02 | 7045.62 | 3937.90 | 2826.89 | 0.00 | 61.72 | ||
| 净化环境 | 166.65 | 2064.62 | 1300.29 | 6851.20 | 0.00 | 253.06 | ||
| 水文调节 | 7873.72 | 19671.15 | 12306.54 | 538467.98 | 0.00 | 632.00 | ||
| 支持服务 | 土壤保持 | 641.91 | 2867.01 | 1814.64 | 1148.04 | 0.00 | 92.58 | |
| 维持养分 | 191.34 | 219.11 | 139.90 | 86.41 | 0.00 | 6.17 | ||
| 生物多样 | 209.86 | 2610.86 | 1650.05 | 3147.85 | 0.00 | 86.41 | ||
| 文化服务 | 美学景观 | 92.58 | 1144.95 | 728.33 | 2333.11 | 0.00 | 37.03 | |
表2 2010—2023年长江中游城市群各类土地的ESV变化Tab.2 Changes in ESV of various land types in the middle reaches of the Yangtze River Urban Agglomeration (2010-2023) |
| 土地利用类型 | 耕地 | 林地 | 草地 | 水域 | 建设用地 | 未利用地 | 合计 | |
|---|---|---|---|---|---|---|---|---|
| 2010年 | ESV(亿元) | 736.58 | 7067.44 | 225.54 | 14097.67 | 0.00 | 2.49 | 22129.73 |
| 比例(%) | 3.33 | 31.94 | 1.02 | 63.70 | 0.00 | 0.01 | 100.00 | |
| 2015年 | ESV(亿元) | 725.71 | 7025.55 | 229.76 | 14191.99 | 0.00 | 2.37 | 22175.38 |
| 比例(%) | 3.27 | 31.68 | 1.04 | 64.00 | 0.00 | 0.01 | 100.00 | |
| 2020年 | ESV(亿元) | 706.38 | 7050.43 | 226.24 | 14168.56 | 0.00 | 2.46 | 22154.07 |
| 比例(%) | 3.19 | 31.82 | 1.02 | 63.95 | 0.00 | 0.01 | 100.00 | |
| 2023年 | ESV(亿元) | 702.51 | 7038.74 | 225.79 | 14022.58 | 0.00 | 2.87 | 21992.49 |
| 比例(%) | 3.17 | 31.74 | 1.02 | 63.23 | 0.00 | 0.01 | 99.18 | |
| 2010—2023年 | ESV变化(亿元) | -34.08 | -28.69 | 0.25 | -75.09 | 0.00 | 0.38 | -137.23 |
| ESV变化率(%) | -4.63 | -0.41 | 0.11 | -0.53 | 0.00 | 15.39 | -0.62 | |
表3 2010—2023年长江中游城市群各地类的ESV动态度Tab.3 Dynamic degree of ESV of different land types in the middle reaches of the Yangtze River Urban Agglomeration |
| 研究时期 | ESV动态度(%) | |||||
|---|---|---|---|---|---|---|
| 耕地 | 林地 | 草地 | 水域 | 建设用地 | 未利用地 | |
| 2010—2015 | -0.30 | -0.12 | 0.37 | 0.13 | 0 | -0.96 |
| 2015—2020 | -0.53 | 0.07 | -0.31 | -0.03 | 0 | 0.72 |
| 2020—2023 | -0.18 | -0.06 | -0.07 | -0.34 | 0 | 5.67 |
| 2010—2023 | -0.36 | -0.03 | 0.01 | -0.04 | 0 | 1.18 |
表4 2010—2023年长江中游城市群土地生态系统单项服务价值变化Tab.4 Changes in the value of individual services of the land ecosystem in the middle reaches of the Yangtze River Urban Agglomeration in 2010-2023 |
| 生态系统服务价值 | 2010年 | 2015年 | 2020年 | 2023年 | 2010—2023年 | ||||||||||
|---|---|---|---|---|---|---|---|---|---|---|---|---|---|---|---|
| ESV (亿元) | 比例 (%) | ESV (亿元) | 比例 (%) | ESV (亿元) | 比例 (%) | ESV (亿元) | 比例 (%) | ESV变化 (亿元) | ESV变化率 (%) | ||||||
| 供给服务 | 食物生产 | 258.13 | 1.17 | 255.39 | 1.15 | 250.82 | 1.13 | 249.55 | 1.13 | -8.58 | -3.32 | ||||
| 原料生产 | 174.67 | 0.79 | 173.46 | 0.78 | 172.80 | 0.78 | 172.31 | 0.78 | -2.36 | -1.35 | |||||
| 水资源供给 | 411.56 | 1.86 | 430.19 | 1.94 | 452.87 | 2.04 | 446.52 | 2.03 | 34.96 | 8.50 | |||||
| 调节服务 | 气体调节 | 589.32 | 2.66 | 585.17 | 2.64 | 582.60 | 2.63 | 580.94 | 2.64 | -8.38 | -1.42 | ||||
| 气候调节 | 1403.70 | 6.34 | 1396.42 | 6.30 | 1398.12 | 6.31 | 1394.96 | 6.34 | -8.74 | -0.62 | |||||
| 净化环境 | 554.23 | 2.50 | 553.05 | 2.49 | 553.31 | 2.50 | 550.99 | 2.51 | -3.24 | -0.58 | |||||
| 水文调节 | 17201.45 | 77.73 | 17252.53 | 77.80 | 17214.92 | 77.71 | 17072.98 | 77.63 | -128.47 | -0.75 | |||||
| 支持服务 | 土壤保持 | 626.48 | 2.83 | 622.77 | 2.81 | 622.03 | 2.81 | 620.48 | 2.82 | -6.00 | -0.96 | ||||
| 维持养分 | 66.43 | 0.30 | 65.87 | 0.30 | 65.33 | 0.29 | 65.11 | 0.30 | -1.32 | -1.98 | |||||
| 生物多样 | 570.91 | 2.58 | 568.58 | 2.56 | 569.11 | 2.57 | 567.45 | 2.58 | -3.47 | -0.61 | |||||
| 文化服务 | 美学景观 | 272.83 | 1.23 | 271.96 | 1.23 | 272.15 | 1.23 | 271.19 | 1.23 | -1.64 | -0.60 | ||||
| 合计 | 22129.73 | 100.00 | 22175.38 | 100.00 | 22154.07 | 100.00 | 21992.49 | 100.00 | -137.23 | -0.62 | |||||
表5 不同年份长江中游城市群ESV的Moran's I统计值Tab.5 Annual Moran's I statistical values of ESV in the middle reaches of the Yangtze River Urban Agglomeration |
| 年份 | Moran's I | t值 | P值 |
|---|---|---|---|
| 2010 | 0.627995 | 17.990025 | <0.001 |
| 2015 | 0.631063 | 18.080174 | <0.001 |
| 2020 | 0.635181 | 18.124188 | <0.001 |
| 2023 | 0.633581 | 18.088396 | <0.001 |
表6 长江中游城市群ESV空间分异的因子探测Tab.6 Factor detection of spatial differentiation in ESV |
| 因子 | q统计量 | P值 | |
|---|---|---|---|
| 自然因素 | 高程 | 0.4465 | 0.000 |
| 坡度 | 0.276 | 0.000 | |
| NDVI | 0.2627 | 0.000 | |
| 气温 | 0.1489 | 0.000 | |
| 降水 | 0.0668 | 0.000 | |
| 社会因素 | HAI | 0.2247 | 0.000 |
| 人口分布 | 0.0464 | 0.008 | |
| [1] |
姜晗, 吴群. 基于LUCC的江苏省生态系统服务价值评估及时空演变特征研究[J]. 长江流域资源与环境, 2021, 30(11):2712-2725.
|
| [2] |
|
| [3] |
|
| [4] |
张百婷, 李宗省, 冯起, 等. 基于土地利用变化的祁连山地区生态系统服务价值演化分析[J]. 生态学报, 2024, 44(10):4187-4202.
|
| [5] |
袁腾跃, 万大娟, 向熠繁, 等. 潇水流域生态系统服务价值时空变化及其驱动因素[J]. 经济地理, 2024, 44(5):182-189.
|
| [6] |
|
| [7] |
|
| [8] |
陈万旭, 刘志玲, 李江风, 等. 长江中游城市群生态系统服务和城镇化之间的空间关系研究[J]. 生态学报, 2020, 40(15):5137-5150.
|
| [9] |
|
| [10] |
张家其, 朱莉, 阳斌成. 洞庭湖流域生态系统服务供需时空演变与情景预测[J]. 长江流域资源与环境, 2024, 33(8):1702-1714.
|
| [11] |
张宇, 陈宇轩, 高志鹏, 等. 基于土地利用变化的鄂尔多斯市生态系统服务价值时空演化特征分析[J]. 干旱区资源与环境, 2025, 39(2):131-140.
|
| [12] |
杨锁华, 胡守庚, 瞿诗进. 长江中游地区生态系统服务价值的地形梯度效应[J]. 应用生态学报, 2018, 29(3):976-986.
|
| [13] |
刘永强, 龙花楼. 长江中游经济带土地利用转型时空格局及其生态服务功能影响[J]. 经济地理, 2017, 37(11):161-170.
|
| [14] |
|
| [15] |
熊雪婷, 李传华, 陈佳豪. 植被对气候变化响应的地形调控作用[J]. 地理学报, 2023, 78(9):2256-2270.
|
| [16] |
|
| [17] |
刘志涛, 王少剑, 方创琳. 粤港澳大湾区生态系统服务价值的时空演化及其影响机制[J]. 地理学报, 2021, 76(11):2797-2813.
|
| [18] |
|
| [19] |
王晓利, 侯西勇. 1982—2014年中国沿海地区归一化植被指数(NDVI)变化及其对极端气候的响应[J]. 地理研究, 2019, 38(4):807-821.
|
| [20] |
苏宁, 丁国栋, 杜林芳, 等. 人类活动对资源型城市生态系统服务价值的影响——以鄂尔多斯为例[J]. 生态学报, 2022, 42(16):6543-6553.
|
| [21] |
危小建, 辛思怡, 张颖艺, 等. 不同格网尺度下生态系统服务价值空间分异及其影响因素差异——以大南昌都市圈为例[J]. 生态学报, 2023, 43(18):7585-7597.
|
| [22] |
马伟波, 杨帆, 王楠, 等. 长三角城市群地区生态系统服务价值时空演变及驱动因素研究[J]. 生态与农村环境学报, 2022, 38(11):1365-1376.
|
| [23] |
谢高地, 张彩霞, 张雷明, 等. 基于单位面积价值当量因子的生态系统服务价值化方法改进[J]. 自然资源学报, 2015, 30(8):1243-1254.
|
| [24] |
谢高地, 张彩霞, 张昌顺, 等. 中国生态系统服务的价值[J]. 资源科学, 2015, 37(9):1740-1746.
|
| [25] |
牛潜, 周旭, 许幼霞, 等. 基于土地利用的贵州省乌江区域生态系统服务价值演变分析[J]. 生态科学, 2018, 37(5):165-173.
|
| [26] |
牛璐, 向燕芸, 张齐飞, 等. 2000年以来黄河中游地区土地利用与生态系统服务价值时空分异特征[J]. 水土保持研究, 2025, 32(5):435-443.
|
| [27] |
陈浮, 葛小平, 陈刚, 等. 城市边缘区景观变化与人为影响的空间分异研究[J]. 地理科学, 2001(3):210-216.
|
| [28] |
黄木易, 岳文泽, 方斌, 等. 1970—2015年大别山区生态服务价值尺度响应特征及地理探测机制[J]. 地理学报, 2019, 74(9):1904-1920.
|
| [29] |
严恩萍, 林辉, 王广兴, 等. 1990—2011年三峡库区生态系统服务价值演变及驱动力[J]. 生态学报, 2014, 34(20):5962-5973.
|
| [30] |
李月, 刘静兰, 白晓永, 等. 长江上游水源涵养区生态系统服务价值多尺度空间分异——格局、过程与驱动力[J]. 生态学报, 2025, 45(7):3062-3078.
|
| [31] |
贾占华, 谷国锋. 东北地区人口分布的时空演变特征及影响因素[J]. 经济地理, 2016, 36(12):60-68.
|
| [32] |
侯孟阳, 姚顺波, 邓元杰, 等. 格网尺度下延安市生态服务价值时空演变格局与分异特征——基于退耕还林工程的实施背景[J]. 自然资源学报, 2019, 34(3):539-552.
|
| [33] |
王劲峰, 徐成东. 地理探测器:原理与展望[J]. 地理学报, 2017, 72(1):116-134.
|
| [34] |
马欢, 计伟, 冯朝阳, 等. 2000—2022年黔南州植被NDVI时空变化及驱动因子分析[J]. 环境科学研究, 2025, 38(6):1332-1343.
|
| [35] |
覃成林, 樊双涛. 中国式现代化的区域维度分析[J]. 齐鲁学刊, 2024(2):120-128.
|
/
| 〈 |
|
〉 |