
Evolution of Spatial Pattern and Influencing Factors of China's New Energy Vehicle Industry
Received date: 2025-02-24
Revised date: 2025-09-23
Online published: 2025-12-23
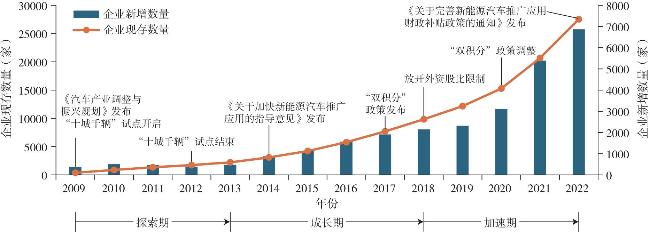
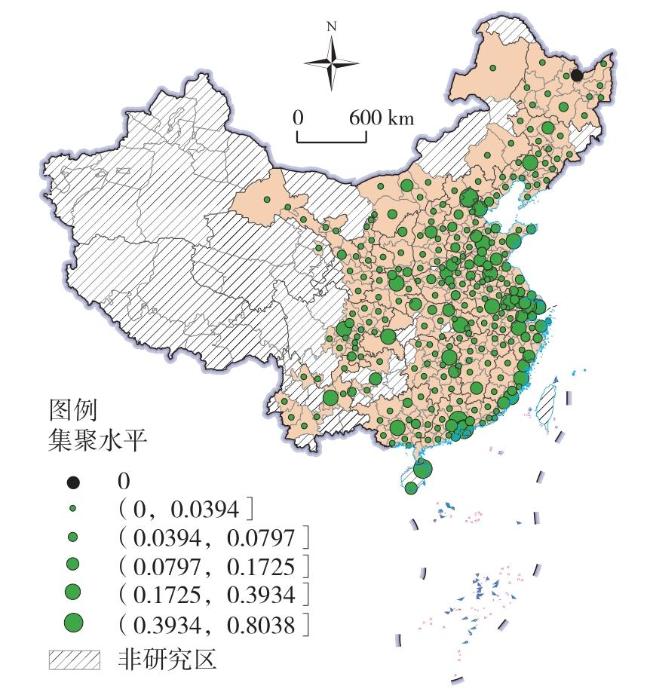
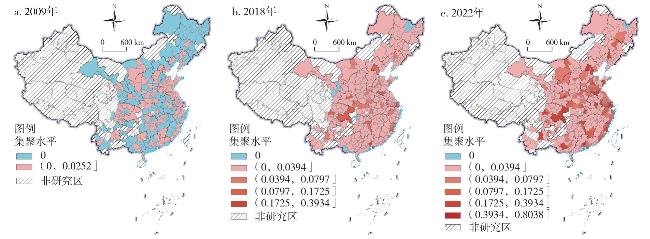
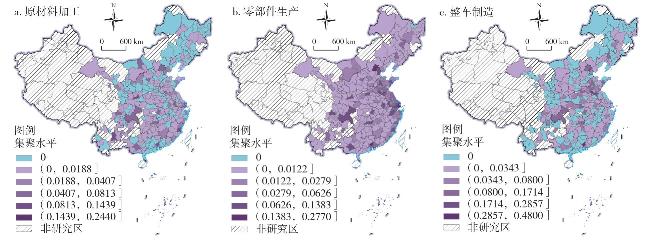
Drawing on data from new energy vehicle enterprises in 282 prefecture-level cities in China from 2009 to 2022, this study systematically depicts the spatial evolutionary characteristics of the new energy vehicle industry. It does so by integrating the heterogeneous roles played by different segments of the industrial value chain in shaping industrial development, and by employing a spatial autoregressive model to identify the core determinants of industrial location choices. The findings are as follows: 1) At the national level, China's new energy vehicle industry exhibits a spatial distribution characterized by high concentration in the southeast and low concentration in the northwest. Although the overall industrial scale has expanded significantly over time, development gaps among cities remain persistent. 2) From the perspective of different segments of the industrial chain, the spatial distribution of China's new energy vehicle industry demonstrates notable concentration and regional specificity. 3) During the study period, the agglomeration of China's new energy vehicle industry shows significant spatial dependence. Changes in spatial distribution result from the combined effects of multiple factors, including the locational environment, factor environment, market environment, institutional environment, and technological environment. By uncovering the evolutionary patterns of the new energy vehicle industry's spatial structure, this study provides a theoretical foundation and practical insights for consolidating and expanding China's competitive advantages in the new energy vehicle sector.
CHEN Yilang , GUO Yuanyuan , QIN Wu , WU Liang . Evolution of Spatial Pattern and Influencing Factors of China's New Energy Vehicle Industry[J]. Economic geography, 2025 , 45(11) : 129 -138 . DOI: 10.15957/j.cnki.jjdl.2025.11.013
表1 地区新能源汽车产业集聚水平测度指标及权重Tab.1 Measurement indicators and weights for the level of regional new energy vehicle industry agglomeration |
| 目标层 | 指标层 | 子指标层 | 权重 | ||
|---|---|---|---|---|---|
| 层次分析法 | 熵权法 | 组合法 | |||
| 新能源汽车产业集聚 指数 | 产品 生产 环节 | 原材料加工环节 | 0.122 | 0.365 | 0.244 |
| 零部件生产环节 | 0.279 | 0.274 | 0.277 | ||
| 整车制造环节 | 0.599 | 0.360 | 0.480 | ||
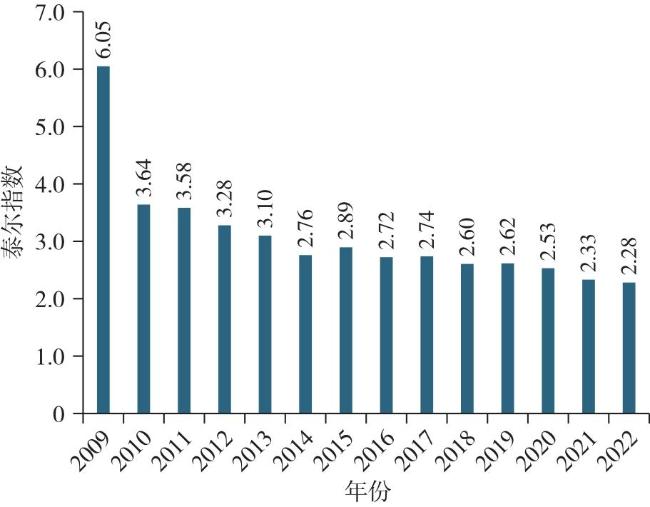
图4 中国新能源汽车产业集聚水平的泰尔指数Fig.4 Theil index of industrial agglomeration levels in China's new energy vehicle industry |
表2 2022年中国新能源汽车产业集聚水平排名前10位与后10位的城市及占比Tab.2 Top 10 and bottom 10 cities in China's new energy vehicle industry agglomeration levels in 2022 and their respective proportions |
| 城市 | 前10位 | 城市 | 后10位 | |||||
|---|---|---|---|---|---|---|---|---|
| 集聚 水平 | 占比(%) | 累计占比(%) | 集聚 水平 | 占比 (%) | 累计占比 (%) | |||
| 广州 | 0.804 | 5.746 | 5.746 | 中卫 | 0.001 | 0.005 | 99.975 | |
| 海口 | 0.617 | 4.410 | 10.156 | 四平 | 0.001 | 0.004 | 99.979 | |
| 深圳 | 0.505 | 3.610 | 13.766 | 辽源 | 0.001 | 0.004 | 99.984 | |
| 北京 | 0.393 | 2.812 | 16.578 | 七台河 | 0.001 | 0.004 | 99.988 | |
| 徐州 | 0.381 | 2.723 | 19.302 | 石嘴山 | 0.001 | 0.004 | 99.992 | |
| 重庆 | 0.344 | 2.458 | 21.760 | 白山 | 0.0004 | 0.003 | 99.995 | |
| 长沙 | 0.322 | 2.299 | 24.059 | 固原 | 0.0004 | 0.003 | 99.997 | |
| 上海 | 0.295 | 2.112 | 26.170 | 双鸭山 | 0.0002 | 0.001 | 99.999 | |
| 福州 | 0.293 | 2.097 | 28.268 | 伊春 | 0.0002 | 0.001 | 100.000 | |
| 西安 | 0.273 | 1.951 | 30.219 | 鹤岗 | 0.0000 | 0.000 | 100.000 | |
表3 空间模型形式及适用性检验结果Tab.3 Spatial model form and applicability test results |
| 检验类别 | 检验方法 | 统计量 |
|---|---|---|
| 空间模型适用性检验 | LM-Lag | 154.107*** |
| LM-Error | 259.559*** | |
| Robust LM-Lag | 23.278*** | |
| Robust LM-Error | 128.730*** | |
| 空间模型形式检验 | LR test(SAR) | 15.90 |
| LR test(SEM) | 16.65* | |
| 固定效应与随机效应检验 | Hausman test | 55.52*** |
| 固定效应类型检验 | LR test(城市固定效应) | 54.19*** |
| LR test(年份固定效应) | 2986.45*** |
表4 变量描述性统计Tab.4 Descriptive statistics of variables |
| 变量名称 | 符号 | 样本量 | 平均值 | 方差 | 最小值 | 最大值 |
|---|---|---|---|---|---|---|
| 新能源汽车 产业集聚水平 | Nev | 3948 | 0.014 | 0.042 | 0.000 | 0.804 |
| 城市资本存量 | lnK | 3948 | 17.563 | 0.997 | 14.690 | 20.684 |
| 人力资源水平 | Hum | 3948 | 0.020 | 0.025 | 0.000 | 0.164 |
| 交通基础设施 | Den | 3948 | 0.029 | 0.035 | 0.005 | 0.843 |
| 市场化水平 | Mar | 3948 | 0.186 | 0.426 | 0.001 | 6.905 |
| 政府关注度 | Gov | 3948 | 0.398 | 0.486 | 0.000 | 5.447 |
| 电动化技术 | lnTec1 | 3948 | 2.631 | 2.275 | 0.000 | 9.561 |
| 燃油车技术 | lnTec2 | 3948 | 1.930 | 1.954 | 0.000 | 8.386 |
| 平均气温 | Tem | 3948 | 14.267 | 5.399 | -2.219 | 25.858 |
| 人均可支配收入 | lnPgdp | 3948 | 9.883 | 0.419 | 8.258 | 11.033 |
| 城市占地面积 | lnArea | 3948 | 9.357 | 0.809 | 7.015 | 12.474 |
表5 基础回归结果Tab.5 Base regression results |
| 变量 | Nev | 直接效应 | 间接效应 | 总效应 |
|---|---|---|---|---|
| lnK | 0.002*** | 0.002*** | 0.003** | 0.005*** |
| Hum | 0.112*** | 0.110*** | 0.142* | 0.252*** |
| Den | 0.089*** | 0.092*** | 0.117* | 0.209** |
| Mar | 0.091*** | 0.093*** | 0.120* | 0.214*** |
| Gov | 0.001*** | 0.001** | 0.001* | 0.002** |
| lnTec1 | 0.001*** | 0.001*** | 0.002** | 0.003*** |
| lnTec2 | 0.001*** | 0.001*** | 0.001** | 0.002*** |
| Tem | 0.002*** | 0.002*** | 0.002* | 0.003*** |
| lnPgdp | -0.005*** | -0.005*** | -0.006** | -0.011*** |
| lnArea | 0.013*** | 0.013*** | 0.017* | 0.030** |
| Rho | 0.532*** | |||
注:为节省版面,Z统计量不显示。表6同。 |
表6 不同生产环节回归结果(因变量为Nev)Tab.6 Regression results for different production stages (dependent variable is Nev) |
| 变量 | 原材料加工 | 零部件生产 | 整车制造 |
|---|---|---|---|
| lnK | 0.0010** | 0.0010*** | 0.0010*** |
| Hum | 0.0970*** | 0.0310*** | 0.0400*** |
| Den | 0.0720*** | 0.0300*** | 0.0090*** |
| Mar | 0.0090*** | 0.0370*** | 0.0230* |
| Gov | 0.0020*** | 0.0003*** | 0.0002* |
| lnTec1 | 0.0003 | 0.0010*** | 0.0003*** |
| lnTec2 | -0.0003 | 0.0005*** | 0.0002** |
| Tem | -0.00020 | -0.00005 | 0.00050** |
| lnPgdp | -0.0050*** | -0.0020*** | -0.0020*** |
| lnArea | 0.0100* | 0.0030*** | 0.0020 |
| Rho | 0.4240*** | 0.8300*** | 0.3080** |
| [1] |
曹霞, 张鑫. 新能源汽车产学研创新网络演化及邻近性机理[J]. 科学学研究, 2023, 41(9):1678-1689.
|
| [2] |
|
| [3] |
陈爱贞, 沙子璇, 温世杰. 产业链支撑与中国新能源汽车行业发展[J]. 福建论坛(人文社会科学版), 2023(12):54-72.
|
| [4] |
徐维祥, 陈展驰, 周建平, 等. 中国新型基础设施的格局及影响因素分析——以新能源汽车充电桩为例[J]. 经济问题探索, 2023(7):43-53.
|
| [5] |
|
| [6] |
刘颖琦, 宋泽源, 高宏伟, 等. 中国新能源汽车10年推广效果研究:空间效应视角[J]. 管理评论, 2023, 35(3):3-16.
|
| [7] |
|
| [8] |
陈俊廷, 邢剑炜, 肖俊极. 新能源汽车市场的本地偏好与地方保护[J]. 数量经济技术经济研究, 2023, 40(11):117-136.
|
| [9] |
任亚文, 杨宇. 珠三角地区半导体产业布局特征及其区位关联模式[J]. 地理科学进展, 2022, 41(9):1622-1634.
|
| [10] |
马芳芳, 王世鹏, 王芳, 等. 黄河流域城市旅游虚实耦合协调水平的空间差异[J]. 经济地理, 2024, 44(5):222-229.
|
| [11] |
张丽, 韩增林. 大连市文化企业的空间分布变化与区位影响因素[J]. 地理科学, 2020, 40(4):665-673.
|
| [12] |
陈前虎, 叶雨繁, 陈静. 杭州主城区直播电商企业区位特征及影响机制[J]. 经济地理, 2023, 43(5):97-107,179.
|
| [13] |
丁华, 丁宁. 交通基础设施对商贸流通效率的影响研究[J]. 商业经济与管理, 2023(7):28-39.
|
| [14] |
生延超, 李倩, 许玲玲. 《旅游法》出台、供给水平与旅游经济发展[J]. 旅游科学, 2023, 37(1):133-155.
|
| [15] |
张一帆, 朱晟君, 贺灿飞. 全球化下战略耦合模式对区域产业进入的影响——以珠三角为例[J]. 地理科学进展, 2024, 43(8):1471-1480.
|
| [16] |
许钊, 张营营, 高煜. 空间效应视角下经济集聚与制造业升级——基于283个城市面板数据的实证研究[J]. 经济问题探索, 2021(12):104-117.
|
| [17] |
周启清, 杨建飞. 高铁网络对中国城市群经济协同性的影响分析[J]. 宏观经济研究, 2022(5):144-158.
|
| [18] |
冉宇豪, 刘卫星, 王巧. 公共资源交易改革政策何以扩散?——基于中国地级市数据的事件史分析[J]. 经济社会体制比较, 2024(3):130-141.
|
| [19] |
张明志, 王新培, 余东华. 政府补助对新能源汽车产业创新结构的影响[J]. 中国人口·资源与环境, 2024, 34(7):35-46.
|
| [20] |
胡楠, 薛付婧, 王昊楠. 管理者短视主义影响企业长期投资吗?——基于文本分析和机器学习[J]. 管理世界, 2021, 37(5):139-156.
|
| [21] |
谭雅妃, 朱朝晖, 李敏鑫. 数字化转型赋能制造业企业高质量发展——基于经济绩效与ESG绩效复合视角[J]. 江西财经大学学报, 2024(4):45-58.
|
| [22] |
陈强. 高级计量经济学及Stata应用(第二版)[M]. 北京: 高等教育出版社, 2014.
|
| [23] |
季凯文, 罗璐薏, 齐江波. 新基建赋能高新技术产业的异质性影响研究——基于空间面板计量模型的实证检验[J]. 管理评论, 2023, 35(2):28-37.
|
| [24] |
|
| [25] |
张大永, 陈映彤, 姬强. 气候风险与外商直接投资:基于城市层面的实证研究[J]. 财贸研究, 2023, 34(12):1-13.
|
| [26] |
张俊美, 佟家栋, 李建桐. 极端高温如何影响多产品企业的出口表现——来自中国的证据[J]. 国际贸易问题, 2024(9):159-174.
|
| [27] |
|
| [28] |
|
| [29] |
汤长安, 邱佳炜, 张丽家, 等. 要素流动、产业协同集聚对区域经济增长影响的空间计量分析——以制造业与生产性服务业为例[J]. 经济地理, 2021, 41(7):146-154.
|
| [30] |
赵天一, 王宏起, 李玥, 等. 新兴产业创新生态系统综合优势形成机理——以新能源汽车产业为例[J]. 科学学研究, 2023, 41(12):2267-2278.
|
/
| 〈 |
|
〉 |