
Spatial-Temporal Pattern and Coupling Coordination Evolution of Weakened Agricultural Labor and Agricultural Mechanization in China and its Effect on Grain Production
Received date: 2023-09-06
Revised date: 2024-10-23
Online published: 2025-11-20
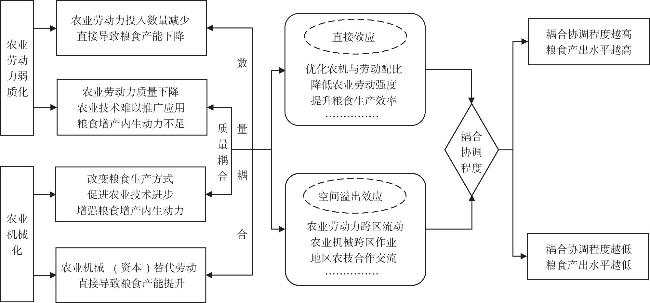
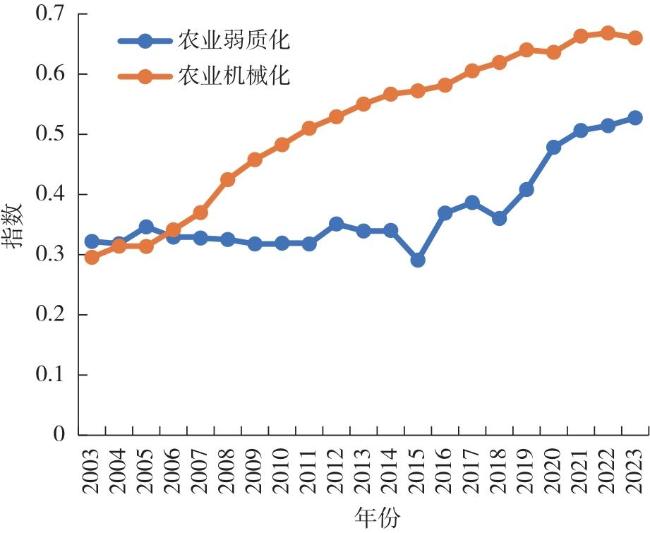
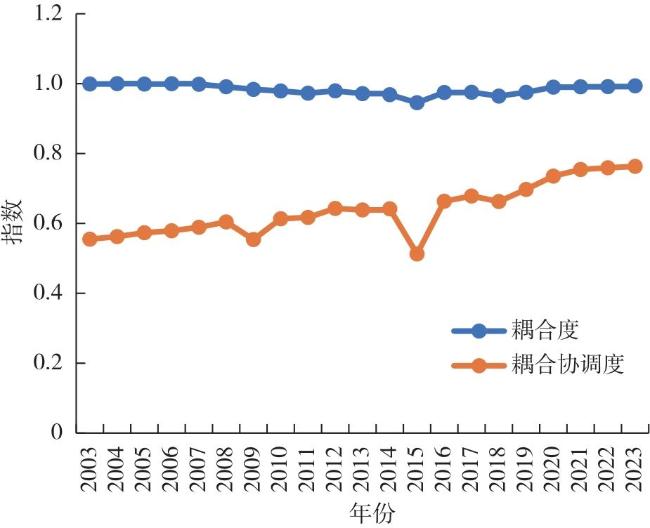
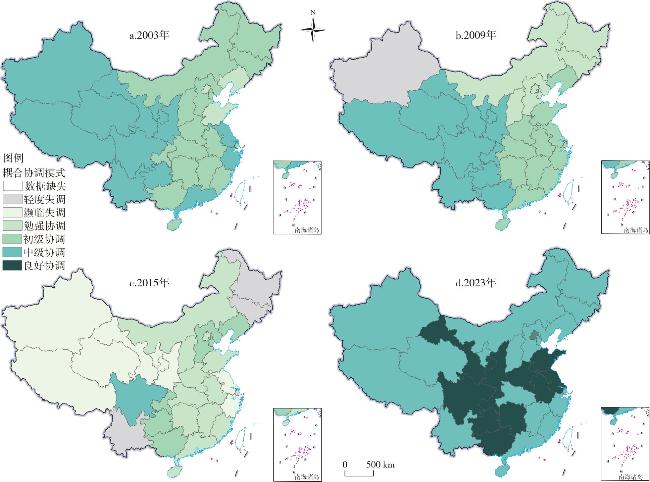
It is difficult to reveal the overall characteristics of the change of agricultural labor force and its coupling relationship with agricultural mechanization by focusing on the reduction or aging of agricultural labor force, feminization, childishness and low education. By constructing an evaluation index for agricultural labor force weakness and agricultural mechanization, this study quantitatively measured the development of agricultural labor force weakness and agricultural mechanization in China and its provinces from 2003 to 2023. Then, the coupling coordination degree model was employed to analyze the spatiotemporal evolution characteristics of the two systems, and the quadrant diagram model was further used to reveal the evolutionary pathways of provincial grain production under varying coupling coordination conditions. Finally, the spatial econometric model was used to quantitatively reveal the impact of the coupling coordination between the two and other agricultural production factors on China's grain production. The results showed that:1) The weakness of China's agricultural labor force showed a two-stage change from 2003 to 2023, with a fluctuating decline from 2003 to 2009 and a steady increase from 2010 to 2023, while the level of agricultural mechanization continued to improve. 2) In 2003, the coupling coordination degree of agricultural labor weakness and agricultural mechanization decreased from west to east. In 2009, the coupling coordination degree decreased from west to east and from south to north. In 2015 and 2023, the coupling coordination degree was degraded and greatly improved, respectively. 3) In the two periods from 2003 to 2009 and 2010 to 2015, the coupling coordination degree of agricultural labor weakness and agricultural mechanization decreased in more than 60% of provinces, but grain output increased, and the opposite was true in 2016 to 2023. 4) The improvement of the coupling coordination degree of agricultural labor weakness and agricultural mechanization in 2003-2009 and 2010-2015 had a significant positive spatial spillover effect on grain production, however in 2016-2023, the spatial spillover effect on grain production turned to significantly negative.
YAO Chengsheng , YANG Yidan , MIU Lanzhi . Spatial-Temporal Pattern and Coupling Coordination Evolution of Weakened Agricultural Labor and Agricultural Mechanization in China and its Effect on Grain Production[J]. Economic geography, 2025 , 45(10) : 180 -191 . DOI: 10.15957/j.cnki.jjdl.2025.10.019
表1 农业劳动力弱质化和农业机械化发展评价指标体系及说明Tab.1 Evaluation index system and description for the development of agricultural mechanization and the weakening of agricultural labor quality |
| 系统层 | 指标层 | 指标说明 | 权重 | 属性 |
|---|---|---|---|---|
| 农业劳动力弱质化 | 农业劳动力转移率(%) | (农村从业人口-第一产业从业人口/乡村从业人口)·100% | 0.121 | + |
| 农业劳动力老龄化(%) | (农村65岁及以上老龄人口/农村16~64岁劳动力)·100% | 0.520 | + | |
| 农业劳动力女性化(%) | (农村16~64岁女性劳动力/农村16~64岁劳动力)·100% | 0.074 | + | |
| 农业劳动力少儿化(%) | (农村15岁及以下人口/农村16~64岁劳动力)·100% | 0.181 | + | |
| 农业劳动力低学历化(年) | 农民人均受教育年限=(文盲人数·1+小学学历人数·6+初中学历人数·9+高中和中专学历人数·12+大专及本科以上学历人数·16)/6岁以上人口总数 | 0.104 | - | |
| 农业机械化 | 机耕率(%) | 机耕面积/(农作物播种面积-免耕面积)·100% | 0.400 | + |
| 机播率(%) | 机播面积/农作物播种面积·100% | 0.300 | + | |
| 机收率(%) | 机收面积/实际收获面积·100% | 0.300 | + |
表2 耦合协调度等级划分Tab.2 Classification of coupling coordination degree |
| 耦合协调度 | (0.00,0.09] | (0.09,0.19] | (0.19,0.29] | (0.29,0.39] | (0.39,0.49] | (0.49,0.59] | (0.59,0.69] | (0.69,0.79] | (0.79,0.89] | (0.89,1.00] |
|---|---|---|---|---|---|---|---|---|---|---|
| 协调等级 | 极度失调 | 严重失调 | 中度失调 | 轻度失调 | 濒临失调 | 勉强协调 | 初级协调 | 中级协调 | 良好协调 | 优质协调 |
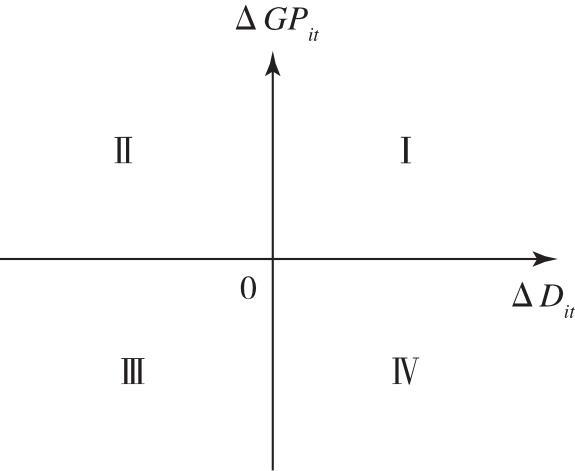
表3 2003—2023年农业劳动力弱质化与农业机械化耦合条件下中国省域粮食生产变化Tab.3 Changes in provincial grain production in China under the coupling of agricultural labor weakening and agricultural mechanization from 2003 to 2023 |
| 阶段 | 第Ⅰ象限 | 第Ⅱ象限 | 第Ⅲ象限 | 第Ⅳ象限 |
|---|---|---|---|---|
| 第1阶段 | 辽宁、山东、上海、湖南、四川 | 北京、天津、海南、河北、江苏、黑龙江、吉林、河南、湖北、安徽、江西、内蒙古、重庆、贵州、云南、广西、陕西、甘肃、青海、宁夏、新疆 | 浙江、福建、广东、山西、西藏 | |
| 第2阶段 | 天津、河北、内蒙古、辽宁、新疆 | 山东、江苏、黑龙江、吉林、山西、河南、湖北、湖南、安徽、江西、四川、贵州、云南、广西、西藏、陕西、甘肃、青海、宁夏 | 北京、上海、浙江、福建、广东、海南、重庆 | |
| 第3阶段 | 天津、浙江、福建、广东、河北、辽宁、山东、江苏、河南、山西、内蒙古、四川、重庆、云南、西藏、陕西、甘肃、青海、宁夏 | 北京、上海、海南、黑龙江、吉林、湖北、湖南、安徽、江西、广西、贵州、新疆 |
表4 空间杜宾回归结果Tab.4 Results of spatial Dubin regression |
| 变量 | SDM模型估计结果 | 分时段空间溢出效应 | ||||
|---|---|---|---|---|---|---|
| 本地效应 | 空间溢出效应 | 2003—2009 | 2010—2015 | 2016—2023 | ||
| lnD | 0.349***(0.173) | 0.126***(0.326) | 0.169**(0.017) | 0.078*(0.055) | -0.038*(-1.656) | |
| lnAREA | 1.318***(0.002) | -0.469**(-0.019) | -0.924***(0.000) | 0.771***(0.000) | 0.545***(0.000) | |
| lnEIA | 0.543***(0.001) | 0.173***(0.001) | 0.007(0.881) | 0.128***(0.002) | 0.003(0.963) | |
| lnFER | 0.798***(0.002) | 0.729***(0.000) | 0.193***(0.002) | 0.087(0.320) | 0.698***(0.000) | |
| lnPES | -0.005(0.958) | -0.311(-0.000) | -0.054*(0.083) | 0.089**(0.034) | -0.453***(0.000) | |
| lnAPF | -0.216(0.216) | -0.129(-0.062) | 0.079***(0.000) | 0.078***(0.001) | 0.105(0.412) | |
| Rho | 0.444***(0.696) | 0.190***(0.001) | 0.346***(0.000) | -0.656***(0.000) | ||
| Sigma2_e | 0.378***(0.279) | 0.002***(0.000) | 0.002***(0.000) | 0.545***(0.000) | ||
注:***、**和*分别表示在1%、5%和10%的显著性水平下显著,括号内数值为t检验值。 |
| [1] |
成升魁, 李云云, 刘晓洁, 等. 关于新时代我国粮食安全观的思考[J]. 自然资源学报, 2018, 33(6):911-926.
|
| [2] |
姚成胜, 肖雅雯, 杨一单. 农业劳动力转移与农业机械化对中国粮食生产的关联影响分析[J]. 农业现代化研究, 2022, 43(2):306-317.
|
| [3] |
蔡昉. 农业劳动力转移潜力耗尽了吗?[J]. 中国农村经济, 2018, 34(9):2-13.
|
| [4] |
程名望, 黄甜甜, 刘雅娟. 农村劳动力外流对粮食生产的影响:来自中国的证据[J]. 中国农村观察, 2015(6):15-21,46,94.
|
| [5] |
王跃梅, 姚先国, 周明海. 农村劳动力外流、区域差异与粮食生产[J]. 管理世界, 2013(11):67-76.
|
| [6] |
黄季焜, 靳少泽. 未来谁来种地:基于我国农户劳动力就业代际差异视角[J]. 农业技术经济, 2015(1):4-10.
|
| [7] |
王欣. 农村劳动力结构变化对粮食生产技术效率的影响研究[D]. 杭州: 浙江财经大学, 2020.
|
| [8] |
秦聪, 郭婧. 谁在种地?——农村居民生产经营选择的影响因素分析[J]. 中国软科学, 2021(4):129-136.
|
| [9] |
|
| [10] |
|
| [11] |
王欧, 唐轲, 郑华懋. 农业机械对劳动力替代强度和粮食产出的影响[J]. 中国农村经济, 2016(12):46-59.
|
| [12] |
蔡键, 唐忠. 华北平原农业机械化发展及其服务市场形成[J]. 改革, 2016(10):65-72.
|
| [13] |
姜磊, 柏玲, 吴玉鸣. 中国省域经济、资源与环境协调分析——兼论三系统耦合公式及其扩展形式[J]. 自然资源学报, 2017, 32(5):788-799.
|
| [14] |
郑旭媛, 徐志刚. 资源禀赋约束、要素替代与诱致性技术变迁——以中国粮食生产的机械化为例[J]. 经济学(季刊), 2017, 16(1):45-66.
|
| [15] |
朱勤, 刘玥, 杨晶晶. 数字化转型促进区域贸易竞争力提升的空间效应[J]. 经济地理, 2023, 43(12):126-134.
|
| [16] |
杨一单, 姚成胜, 刘伟芳. 中国粮食安全系统转型的时空特征及驱动因素[J]. 地理学报, 2024, 79(9):2372-2388.
|
| [17] |
陆岐楠, 张崇尚, 仇焕广. 农业劳动力老龄化、非农劳动力兼业化对农业生产环节外包的影响[J]. 农业经济问题, 2017, 38(10):27-34.
|
| [18] |
文华成. 中国农业劳动力女性化:程度、成因与影响——基于历史宏观截面数据的验证[J]. 人口学刊, 2014, 36(4):64-73.
|
| [19] |
黄灿. 农村劳动力选择性转移对我国二元经济发展的影响[D]. 武汉: 武汉大学, 2010.
|
| [20] |
王国刚, 刘彦随, 刘玉. 城镇化进程中农村劳动力转移响应机理与调控——以东部沿海地区为例[J]. 自然资源学报, 2013, 28(1):1-9.
|
| [21] |
邓蒙芝. 粮食核心产区农业劳动力弱质化特征调查研究[J]. 经济纵横, 2017(5):85-91.
|
| [22] |
马玉婷, 高强. 粮食安全视角下农业机械化对农业种植结构的影响研究[J]. 现代经济探讨, 2023(10):98-111.
|
| [23] |
方师乐, 卫龙宝, 伍骏骞. 农业机械化的空间溢出效应及其分布规律——农机跨区服务的视角[J]. 管理世界, 2017(11):65-78,187-188.
|
| [24] |
伍骏骞, 方师乐, 李谷成, 等. 中国农业机械化发展水平对粮食产量的空间溢出效应分析——基于跨区作业的视角[J]. 中国农村经济, 2017(6):44-57.
|
| [25] |
姚成胜, 何永波, 曹紫怡. 中国主粮生产机械化水平的时空演变及其驱动机制[J]. 中国农业大学学报 2021, 26(5):208-220.
|
| [26] |
廖重斌. 环境与经济协调发展的定量评判及其分类体系——以珠江三角洲城市群为例[J]. 热带地理, 1999(2):76-82.
|
| [27] |
马丽君, 刘聪, 唐盈. 省域旅游业高质量发展促进共同富裕的空间效应分析[J]. 经济地理, 2024, 44(4):210-219.
|
| [28] |
卢新海, 柯楠, 匡兵. 中国粮食生产能力的区域差异和影响因素[J]. 中国土地科学, 2020, 34(8):53-62.
|
| [29] |
李昊儒, 毛丽丽, 梅旭荣, 等. 近30年来我国粮食产量波动影响因素分析[J]. 中国农业资源与区划, 2018, 39(10):1-10,16.
|
| [30] |
赵雪雁, 刘江华, 王蓉, 等. 基于市域尺度的中国化肥施用与粮食产量的时空耦合关系[J]. 自然资源学报, 2019, 34(7):1471-1482.
|
| [31] |
辛翔飞, 刘锐, 王济民. 破除自给率越高粮食越安全的迷误[J]. 农业经济问题, 2020(10):19-31.
|
| [32] |
|
| [33] |
刘钦普, 濮励杰. 中国粮食主产区化肥施用时空特征及生态经济合理性分析[J]. 农业工程学报, 2019, 35 (23):142-150.
|
/
| 〈 |
|
〉 |