
The Spatial Imbalance of Inclusive Green Development in the Yangtze River Economic Belt and Its Formation Mechanisms
Received date: 2024-01-15
Revised date: 2025-04-01
Online published: 2025-11-20
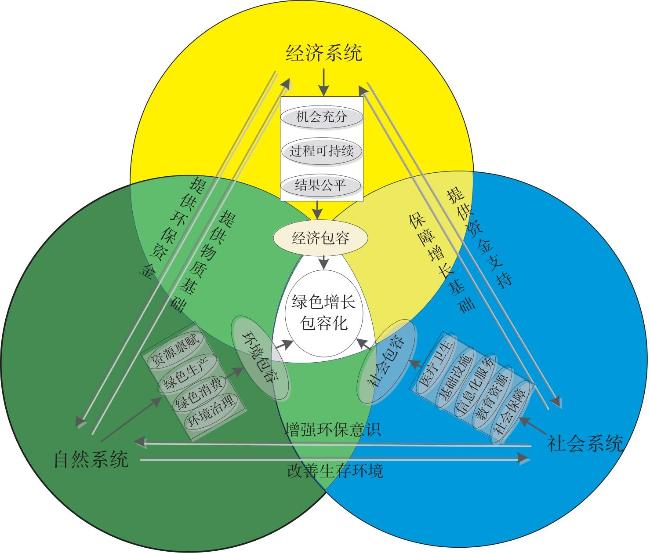
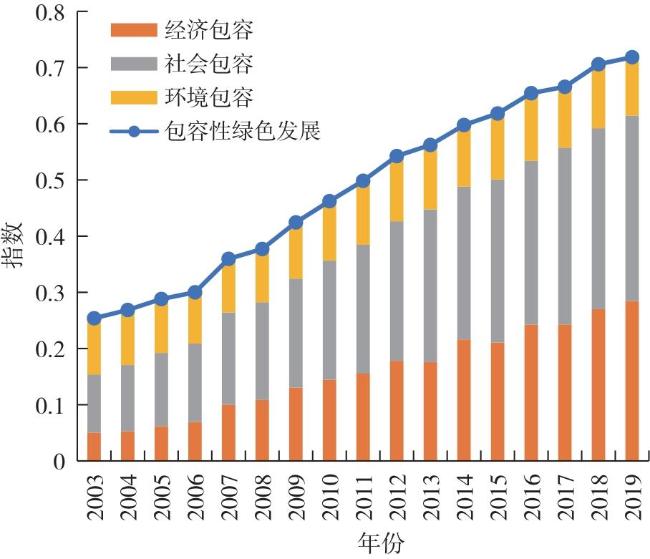
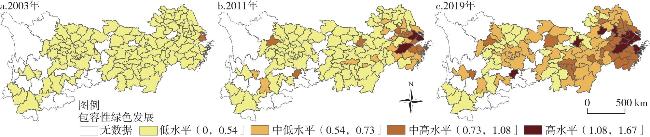
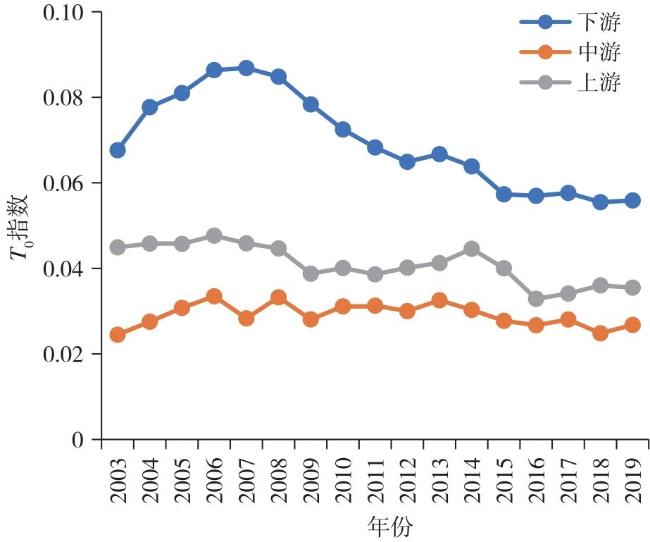
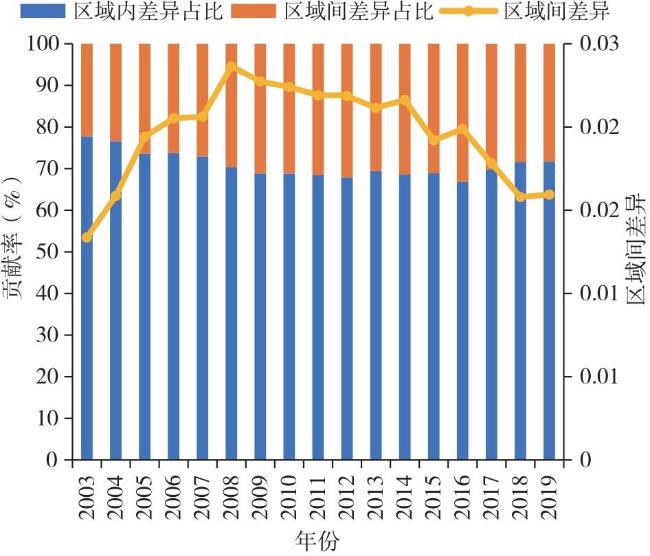
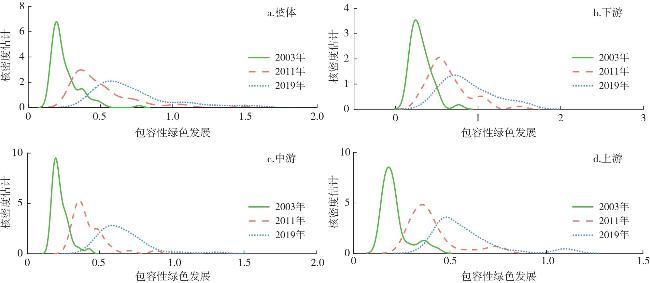
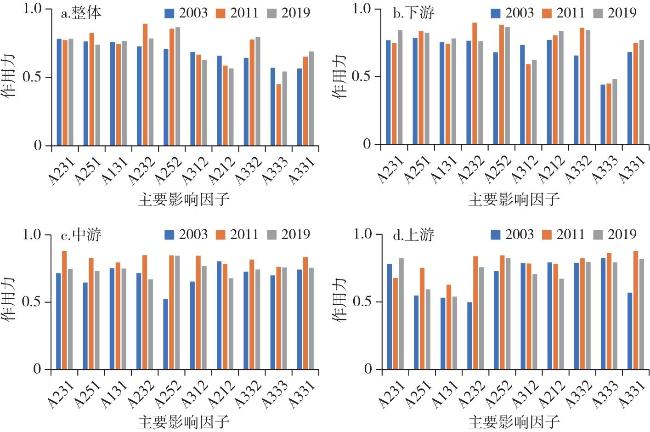
Inclusive green development aims to achieve coordinated development of the economy, society and natural systems, which is an important underpinning for achieving Chinese modernization. It provides an important basis for promoting high-quality development by exploring the spatial imbalance and formation mechanism of inclusive green development in the Yangtze River Economic Belt, and can provide a model for other regions. This paper defines the concept of inclusive green development based on the composite ecosystem of economy-society-nature, and constructs an evaluation system to measure the inclusive green development of 108 cities in the Yangtze River Economic Belt from 2003 to 2019. Then we describe the characteristics of spatial imbalance and dynamic evolution, and analyze the formation mechanism of spatial disequilibrium by using the geographic detector. The study shows that: 1) the inclusive green development is steadily improving in the Yangtze River Economic Belt from 2003 to 2019, and its spatial distribution shows a ladder pattern of downstream>midstream>upstream. 2) The spatial imbalance of inclusive green development increased first and then decreased in the Yangtze River Economic Belt, with the inflection point occurring in 2008. The intra-regional differences were the main source and inter-regional differences are relatively small. 3) The dynamic evolution of the spatial unbalanced of inclusive green development in the Yangtze River Economic Belt shows that the absolute differences increase in the whole region and each region. But the trend of polarization gradually disappears. 4) The social inclusion dimension factors are the main cause of the disequilibrium of inclusive green development space in the Yangtze River Economic Belt as a whole and in various regions. The environmental inclusion dimension factors also gradually play an important role, and the interaction of factors has a stronger effect on the disequilibrium of inclusive green development space in the Yangtze River Economic Belt than the single factor.
XIAO Xiaodong , LIU Yaobin , GUO Yan , FU Ruyi . The Spatial Imbalance of Inclusive Green Development in the Yangtze River Economic Belt and Its Formation Mechanisms[J]. Economic geography, 2025 , 45(10) : 11 -21 . DOI: 10.15957/j.cnki.jjdl.2025.10.002
表1 区域包容性绿色发展评价指标体系及说明Tab.1 Evaluation index system of inclusive green development |
| 目标层 | 维度层 | 领域层 | 基础指标 | 单位 | 属性 | 权重 |
|---|---|---|---|---|---|---|
| 包 容 性 绿 色 发 展 (A) | 经济包容(A1) | 经济增长机会充分(A11) | 二三产业就业率(A111) | % | + | 0.0035 |
| 城镇登记失业率(A112) | % | - | 0.0040 | |||
| 经济增长过程可持续(A12) | 第二产业产值比重(A121) | % | - | 0.0141 | ||
| 第三产业产值比重(A122) | % | + | 0.0154 | |||
| 科技支出占GDP比重(A123) | % | + | 0.0668 | |||
| 经济增长结果公平(A13) | 人均GDP(A131) | 元/人 | + | 0.0731 | ||
| 财政收入占GDP比重(A132) | % | + | 0.0055 | |||
| 城乡人均收入比(A133) | / | - | 0.0344 | |||
| 社会包容(A2) | 医疗卫生公平(A21) | 万人拥有卫生技术人员数(A211) | 人/万人 | + | 0.0246 | |
| 万人拥有医疗卫生机构床位数(A212) | 张/万人 | + | 0.0257 | |||
| 基础设施公平(A22) | 人均城市道路面积(A221) | m2/人 | + | 0.0260 | ||
| 万人拥有公交车数量(A222) | 辆/万人 | + | 0.0440 | |||
| 信息化服务公平(A23) | 人均移动电话数(A231) | 部/人 | + | 0.0671 | ||
| 互联网覆盖率(A232) | % | + | 0.0936 | |||
| 教育资源公平(A24) | 万人拥有教育资源(A241) | 所/万人 | + | 0.0392 | ||
| 教育经费投入强度(A242) | % | + | 0.0503 | |||
| 社会保障公平(A25) | 基本养老保险覆盖率(A251) | % | + | 0.0556 | ||
| 基本医疗保险覆盖率(A252) | % | + | 0.0548 | |||
| 环境包容(A3) | 资源禀赋(A31) | 人均公园绿地面积(A311) | m2/人 | + | 0.0111 | |
| 建成区绿化覆盖率(A312) | % | + | 0.0731 | |||
| 绿色生产(A32) | 单位GDP电耗(A321) | kW·h/万元 | - | 0.0077 | ||
| 单位GDP水耗(A322) | m3/万元 | - | 0.0044 | |||
| 单位GDP工业废水排放量(A323) | t/万元 | - | 0.0086 | |||
| 单位GDP工业SO2排放量(A324) | t/亿元 | - | 0.0073 | |||
| 单位GDP工业烟粉尘排放量(A325) | t/亿元 | - | 0.0029 | |||
| 绿色消费(A33) | 人均居民生活用水(A331) | m3/人 | - | 0.0051 | ||
| 人均城乡居民用电量(A332) | kW·h/人 | - | 0.0044 | |||
| 万人拥有出租车数量(A333) | 辆/万人 | + | 0.0960 | |||
| 环境治理(A34) | 污水处理厂集中处理率(A341) | % | + | 0.0458 | ||
| 生活垃圾无害化处理率(A342) | % | + | 0.0163 | |||
| 一般工业固体废物综合利用率(A343) | % | + | 0.0197 |
注:“+”表示正向指标,“-”表示负向指标。正向指标越大,负向指标越小,指数值越大。 |
表2 2003—2019年长江经济带整体包容性绿色发展测度结果Tab.2 Measurement results of overall difference of inclusive green development in the Yangtze River Economic Belt from 2003 to 2019 |
| 年份 | 基尼系数 | T0 | T1 | 基尼系数 增长率(%) | T0增长率(%) | T1增长率(%) |
|---|---|---|---|---|---|---|
| 2003 | 0.1955 | 0.0601 | 0.0656 | - | - | - |
| 2004 | 0.2074 | 0.0677 | 0.0740 | 6.08 | 12.64 | 12.77 |
| 2005 | 0.2170 | 0.0735 | 0.0801 | 4.62 | 8.65 | 8.24 |
| 2006 | 0.2234 | 0.0781 | 0.0860 | 2.96 | 6.26 | 7.32 |
| 2007 | 0.2203 | 0.0762 | 0.0840 | -1.37 | -2.51 | -2.26 |
| 2008 | 0.2258 | 0.0797 | 0.0876 | 2.51 | 4.67 | 4.24 |
| 2009 | 0.2155 | 0.0730 | 0.0803 | -4.60 | -8.50 | -8.27 |
| 2010 | 0.2148 | 0.0718 | 0.0779 | -0.32 | -1.59 | -3.06 |
| 2011 | 0.2106 | 0.0693 | 0.0757 | -1.96 | -3.44 | -2.81 |
| 2012 | 0.2088 | 0.0680 | 0.0740 | -0.85 | -1.87 | -2.29 |
| 2013 | 0.2106 | 0.0692 | 0.0750 | 0.90 | 1.64 | 1.38 |
| 2014 | 0.2104 | 0.0688 | 0.0738 | -0.09 | -0.57 | -1.57 |
| 2015 | 0.1992 | 0.0617 | 0.0663 | -5.35 | -10.27 | -10.19 |
| 2016 | 0.1957 | 0.0598 | 0.0645 | -1.76 | -3.01 | -2.63 |
| 2017 | 0.1938 | 0.0588 | 0.0636 | -0.95 | -1.66 | -1.44 |
| 2018 | 0.1884 | 0.0555 | 0.0597 | -2.79 | -5.74 | -6.12 |
| 2019 | 0.1901 | 0.0563 | 0.0600 | 0.88 | 1.44 | 0.44 |
表3 主要指标因子交互作用结果Tab.3 Main index factor interaction |
| 年份 | 整体 | 下游 | 中游 | 上游 |
|---|---|---|---|---|
| 2003 | A131∩A131(0.7580) | A131∩A131(0.7554) | A131∩A131(0.7531) | A131∩A131(0.5313) |
| A212∩A131(0.8998) | A212∩A131(0.9419) | A212∩A131(0.9114) | A212∩A131(0.8066) | |
| A232∩A131(0.8297) | A232∩A131(0.8548) | A232∩A131(0.8662) | A232∩A131(0.6408) | |
| A331∩A131(0.8524) | A331∩A131(0.9117) | A331∩A131(0.8132) | A331∩A131(0.8153) | |
| A332∩A131(0.8498) | A332∩A131(0.8776) | A332∩A131(0.8617) | A332∩A131(0.8045) | |
| 2011 | A131∩A131(0.7441) | A131∩A131(0.7431) | A131∩A131(0.7954) | A131∩A131(0.6269) |
| A212∩A131(0.8387) | A212∩A131(0.9040) | A212∩A131(0.9093) | A212∩A131(0.9044) | |
| A232∩A131(0.9205) | A232∩A131(0.9333) | A232∩A131(0.9356) | A232∩A131(0.8794) | |
| A331∩A131(0.8185) | A331∩A131(0.8759) | A331∩A131(0.9204) | A331∩A131(0.8905) | |
| A332∩A131(0.9009) | A332∩A131(0.9436) | A332∩A131(0.8959) | A332∩A131(0.8960) | |
| 2019 | A131∩A131(0.7668) | A131∩A131(0.7832) | A131∩A131(0.7501) | A131∩A131(0.5394) |
| A212∩A131(0.8588) | A212∩A131(0.9276) | A212∩A131(0.8358) | A212∩A131(0.8804) | |
| A232∩A131(0.8604) | A232∩A131(0.8712) | A232∩A131(0.8148) | A232∩A131(0.8748) | |
| A331∩A131(0.8301) | A331∩A131(0.8506) | A331∩A131(0.8456) | A331∩A131(0.8619) | |
| A332∩A131(0.8803) | A332∩A131(0.9151) | A332∩A131(0.8071) | A332∩A131(0.8845) |
注:表中A131、A212、A232等指标解释见表1。 |
| [1] |
周小亮, 吴武林. 中国包容性绿色增长的测度及分析[J]. 数量经济技术经济研究, 2018, 35(8):3-20.
|
| [2] |
赵林, 刘焱序, 曹乃刚, 等. 中国包容性绿色效率时空格局与溢出效应分析[J]. 地理科学进展, 2021, 40(3):382-396.
|
| [3] |
周小亮. 包容性绿色发展:理论阐释与制度支撑体系[J]. 学术月刊, 2020, 52(11):41-54.
|
| [4] |
|
| [5] |
赵林, 高晓彤, 刘焱序, 等. 中国包容性绿色效率空间关联网络结构演变特征分析[J]. 经济地理, 2021, 41(9):69-78,90.
|
| [6] |
吴武林, 何诚颖. 包容性绿色发展的理论阐释及系统耦合协调性研究[J]. 福建师范大学学报(哲学社会科学版), 2023(5):19-32,171.
|
| [7] |
|
| [8] |
吴武林, 周小亮. 中国包容性绿色增长测算评价与影响因素研究[J]. 社会科学研究, 2018(1):27-37.
|
| [9] |
|
| [10] |
陈明华, 谢琳霄, 李倩, 等. 黄河流域包容性绿色增长绩效评价及地区差距——基于减污降碳和共同富裕双重目标的经验考察[J]. 资源科学, 2023, 45(3):564-578.
|
| [11] |
吴雨阳, 曹煜玲, 朱悦, 等. 中国包容性绿色发展的空间关联网络与区域分异及收敛性研究[J]. 自然资源学报, 2025, 40(2):436-458.
|
| [12] |
彭箫慧, 张进峰, 宋鹏飞. 中国城市包容性绿色效率的区域差异及时空演变分析[J]. 经济问题探索, 2025(2):124-143.
|
| [13] |
赵伟, 黄兰, 李威, 等. 中国乡村包容性绿色发展水平分异及其驱动因素[J]. 经济地理, 2023, 43(3):68-77.
|
| [14] |
马茜, 廖甍, 张红兵. 网络基础设施建设、知识流动与城市包容性绿色增长——基于调节中介与链式中介的综合分析框架[J]. 统计研究, 2024, 41(8):98-111.
|
| [15] |
周锐波, 吴云峰, 宋佳晞. 共生共荣:工业智能化发展与包容性绿色增长[J]. 中国人口·资源与环境, 2024, 34(5):162-174.
|
| [16] |
杜志雄, 肖卫东, 詹琳. 包容性增长理论的脉络、要义与政策内涵[J]. 中国农村经济, 2010(11):4-14,25
|
| [17] |
孙才志, 刘玲, 王嵩. 基于社会机会函数的中国沿海地区包容性增长研究[J]. 经济地理, 2017, 37(10):27-36.
|
| [18] |
胡鞍钢, 周绍杰. 绿色发展:功能界定、机制分析与发展战略[J]. 中国人口·资源与环境, 2014, 24(1):14-20.
|
| [19] |
田光辉, 李江苏, 苗长虹, 等. 基于非期望产出的中国城市绿色发展效率及影响因素分析[J]. 经济地理, 2022, 42(6):83-91.
|
| [20] |
任嘉敏, 马延吉. 东北老工业基地绿色发展评价及障碍因素分析[J]. 地理科学, 2018, 38(7):1042-1050.
|
| [21] |
吴武林, 周小亮. 中国包容性绿色增长绩效评价体系的构建及应用[J]. 中国管理科学, 2019, 27(9):183-194.
|
| [22] |
曾刚, 胡森林. 技术创新对黄河流域城市绿色发展的影响研究[J]. 地理科学, 2021, 41(8):1314-1323.
|
| [23] |
张旭, 魏福丽, 袁旭梅. 中国省域高质量绿色发展水平评价与演化[J]. 经济地理, 2020, 40(2):108-116.
|
| [24] |
王小鲁, 樊纲, 胡李鹏. 中国分省份市场化指数报告(2018)[M]. 北京: 社会科学文献出版社, 2019.
|
| [25] |
|
| [26] |
|
| [27] |
王劲峰, 徐成东. 地理探测器:原理与展望[J]. 地理学报, 2017, 72(1):116-134.
|
| [28] |
刘凯, 刘涛. 中国市域经济发展质量水平的格局演变及其驱动因子[J]. 经济地理, 2023, 43(12):80-90.
|
| [29] |
史利江, 李永宁, 李前锦, 等. 资源型地区地级市绿色发展水平的时空演变及影响因素——以山西省为例[J]. 经济地理, 2024, 44(1):77-87,173.
|
| [30] |
吴武林, 罗世华, 刘祥官. 长江经济带包容性绿色发展的测度评价、动态分布与收敛趋势[J]. 江西财经大学学报, 2022(6):13-28.
|
| [31] |
蔡佩汝, 汪侠, 闫艺涵, 等. 中国儿童多维贫困时空格局变化及其影响因素[J]. 地理学报, 2021, 76(10):2551-2567.
|
/
| 〈 |
|
〉 |