


Spatiotemporal Evolution and Influencing Factors of Market-Oriented and Government-Oriented Coworking Space: Evidence from Central Guangzhou City
Received date: 2024-09-12
Revised date: 2025-02-26
Online published: 2025-10-17
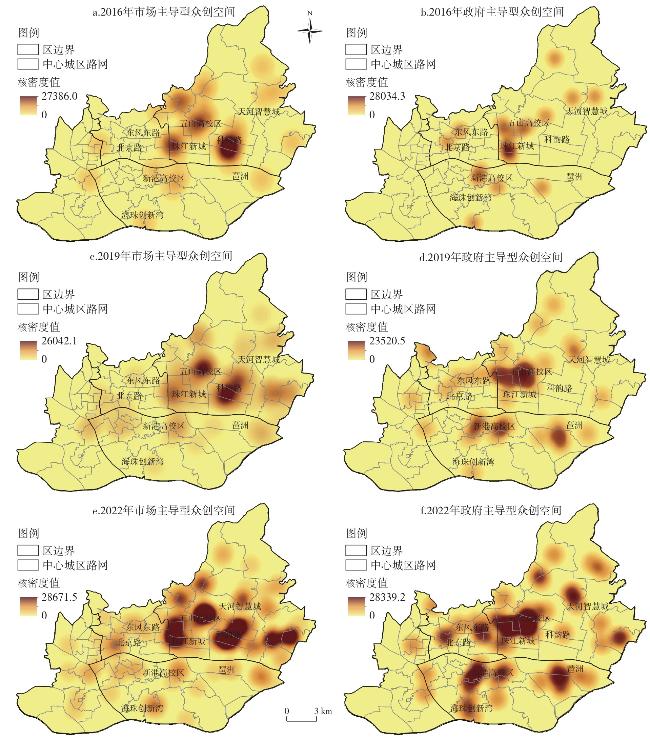
This paper divides coworking space into market-oriented and government-oriented coworking space according to the investment and operation entity. Taking central Guangzhou City as a case, this study collects multi-source data on coworking space and built environment characteristics from the micro-scale (500 m×500 m cells) in 2016, 2019, and 2020, respectively. The dataset are then adopted to vividly show the spatiotemporal evolution of market-oriented and government-oriented coworking space in 2016-2022. Negative binominal regression models are further developed to reveal how different built environment factors influence the distribution of market-oriented and government-oriented coworking space, respectively. Our results show that: 1) both market-oriented and government-oriented coworking space have rapidly increased and respectively formulated spatial structures of "Wushan Education Area-Zhujiang New Town -Keyun Road" cores and "Wushan Education Area-Xingang Education Area" cores. 2) Market-oriented coworking space shows much higher degree of agglomeration compared to government-oriented coworking space. 3) Compared to the built environment associated with roles of workplace providers and community hosts, those related to the role of incubation generators exert greater influence on the distribution of both market-oriented and government-oriented coworking space. 4) Capital investment facilities have the greatest influence on the distribution of market-oriented coworking space, while research facilities have the biggest impact on the distribution of government-oriented coworking space.
WANG Bo , WANG Li , AIMAITIKALI Wumaieraili . Spatiotemporal Evolution and Influencing Factors of Market-Oriented and Government-Oriented Coworking Space: Evidence from Central Guangzhou City[J]. Economic geography, 2025 , 45(9) : 77 -84 . DOI: 10.15957/j.cnki.jjdl.2025.09.008
表1 市场主导型与政府主导型众创空间差异Tab.1 Difference between market-oriented and government-oriented coworking space |
| 市场主导型 | 政府主导型 | |
|---|---|---|
| 投资运营主体 | 个体或民营科技企业、投资机构主导出资 | 政府部门、事业单位(科研院所、高等院校、医院等)、国企主导出资 |
| 服务对象 | “苗圃期—孵化期—加速期”全周期小型创新创业团队、自由职业者 | 苗圃期小型创新创业团队 |
| 盈利模式 | 工位费(700~1300元/月/人)+服务性收费+股权投资 | 工位费(300~800元/月/人)+股权投资 |
| 职能 | 实现技术转化和外溢 | 人才培养和知识扩散 |
| 代表性众创空间 | 万科云工坊、创富港众创空间、华南黑马会、伯乐咖啡等 | 天河区港澳青年之家创业基地、289艺术park、中大创新谷等 |
注:数据和资料源自作者调研整理。 |
表2 众创空间分布的建成环境影响因素指标及说明Tab.2 The influencing built environment factors of the location of coworking space |
| 指标 | 含义 | 数据来源 | |
|---|---|---|---|
| 办公空间 | 公共交通X1 | 空间单元内公共交通站点(公交站点、地铁站点)数量(个) | 高德地图 |
| 绿化环境X2 | 空间单元内公园绿地面积(m2,取对数) | 土地利用 | |
| 商业配套X3 | 空间单元内商超(商场、超市、便利店等)数量(个) | 高德地图 | |
| 社区空间 | 休闲娱乐设施X4 | 空间单元内休闲娱乐设施(KTV、游戏厅、电影院、健身房等)数量(个) | 高德地图 |
| 餐饮式社交场所X5 | 空间单元内餐饮式社交场所(咖啡馆、酒吧等)数量(个) | 高德地图 | |
| 孵化空间 | 风险投资机构X6 | 空间单元内风险投资机构数量(个) | 天眼查 |
| 专业服务机构X7 | 空间单元内专业服务机构(法律、财务等服务公司)数量(个) | 天眼查 | |
| 科研机构X8 | 空间单元内科研院所和高等院校数量(个) | 高德地图 | |
| 文化创意机构X9 | 空间单元内文化创意企业数量(个) | 天眼查 | |
| 信息技术企业X10 | 空间单元内信息技术服务企业数量(个) | 天眼查 | |
表3 2016—2022年广州市中心城区市场主导型与政府主导型众创空间演化Tab.3 Evolution of market-oriented and government-oriented coworking space in central Guangzhou City in 2016-2022 |
| 指标 | 2016 | 2019 | 2022 | |||||
|---|---|---|---|---|---|---|---|---|
| 市场 主导型 | 政府 主导型 | 市场 主导型 | 政府 主导型 | 市场 主导型 | 政府 主导型 | |||
| 总数(个) | 34 | 18 | 84 | 36 | 154 | 61 | ||
| 标准差 | 0.170 | 0.112 | 0.319 | 0.162 | 0.468 | 0.241 | ||
| NNI | 0.976 | 1.303 | 0.688 | 0.958 | 0.586 | 0.874 | ||
| L(d)(km) | 0.121 | 0.100 | 0.193 | 0.121 | 0.917 | 0.289 | ||
表4 广州市中心城区市场主导型与政府主导型众创空间分布建成环境影响因素回归结果Tab.4 Regression results of the factors influencing market-oriented and government-oriented coworking space in central Guangzhou City |
| 变量 | 2016 | 2019 | 2022 | ||||||
|---|---|---|---|---|---|---|---|---|---|
| 市场主导型 | 政府主导型 | 市场主导型 | 政府主导型 | 市场主导型 | 政府主导型 | ||||
| 办公空间 | 公共交通 | 0.212*(0.141) | 0.208*(0.155) | 0.251*(0.156) | 0.244*(0.153) | 0.258*(0.158) | 0.249*(0.156) | ||
| 绿化环境 | 0.050(0.040) | 0.062(0.052) | 0.040(0.038) | 0.059(0.050) | 0.042(0.040) | 0.060(0.051) | |||
| 商业配套 | 0.050*(0.031) | 0.081*(0.046) | 0.069*(0.040) | 0.105*(0.063) | 0.063*(0.040) | 0.109*(0.066) | |||
| 社区空间 | 休闲娱乐设施 | 0.118*(0.067) | 0.020(0.015) | 0.128*(0.082) | 0.027(0.020) | 0.139*(0.083) | 0.041(0.033) | ||
| 餐饮式社交场所 | 0.079*(0.045) | 0.054(0.055) | 0.129*(0.081) | 0.026(0.021) | 0.163*(0.090) | 0.030(0.027) | |||
| 孵化空间 | 风险资本机构 | 0.684***(0.228) | 0.291**(0.145) | 0.801***(0.240) | 0.356**(0.171) | 1.098***(0.255) | 0.398**(0.180) | ||
| 专业服务机构 | 0.137**(0.065) | 0.402***(0.200) | 0.163**(0.081) | 0.440***(0.210) | 0.169**(0.084) | 0.494***(0.222) | |||
| 科研机构 | 0.130**(0.066) | 0.670***(0.233) | 0.115**(0.053) | 0.666***(0.230) | 0.087**(0.043) | 0.664***(0.235) | |||
| 文化创意机构 | 0.110**(0.050) | 0.104**(0.050) | 0.129**(0.056) | 0.125*(0.079) | 0.141**(0.060) | 0.127*(0.083) | |||
| 信息技术企业 | 0.134**(0.070) | 0.201*(0.120) | 0.155*(0.071) | 0.273*(0.181) | 0.158*(0.077) | 0.361*(0.205) | |||
| 截距项 | -4.230 | -4.230 | -5.167 | -2.321 | -5.151 | -2.590 | |||
| 调整R2 | 0.276 | 0.228 | 0.366 | 0.286 | 0.385 | 0.288 | |||
注:*、**、***分别表示在10%、5%、1%水平上显著。 |
| [1] |
颜子明, 杜德斌, 刘承良, 等. 西方创新地理研究的知识图谱可视化分析[J]. 地理学报, 2018, 73(2):362-379.
|
| [2] |
朱竑, 吕祖宜, 钱俊希. 文化经济地理学:概念、理论和实践[J]. 经济地理, 2019, 39(9):1-11.
|
| [3] |
韦胜, 王磊, 曹珺涵. 长三角地区创新空间分布特征与影响因素——以“双创”机构为例[J]. 经济地理, 2020, 40(8):36-42.
|
| [4] |
贺灿飞, 朱晟君. 企业家精神与南昌众创空间涌现——基于演化经济地理学视角[J]. 经济地理, 2020, 40(3):141-151.
|
| [5] |
周岚, 崔曙平. 新常态下城市规划的新空间[J]. 城市规划. 2016, 40(4):9-14,26.
|
| [6] |
王波, 甄峰, 朱贤强. 互联网众创空间的内涵及其发展与规划策略——基于上海的调研分析[J]. 城市规划, 2017, 41(9):30-37,121.
|
| [7] |
王波, 王莉, 陈蔚蕾, 等. 广州中心城区众创空间满意度分析——基于创新创业者的调研[J]. 地理科学进展, 2023, 42(12):2350-2361.
|
| [8] |
|
| [9] |
|
| [10] |
|
| [11] |
鲍宏雷, 唐根年, 邬惠婷. 中国特色众创空间分布及其影响因素分析——来自全国1337家众创空间的数据分析[J]. 科技与经济, 2017, 30(4):36-40.
|
| [12] |
苏瑞波, 何悦. 基于统计数据的广东省众创空间现状分析[J]. 科技管理研究, 2017, 37(15):89-96.
|
| [13] |
滕堂伟, 覃柳婷, 胡森林. 长三角地区众创空间的地理分布及影响机制[J]. 地理科学, 2018, 38(8):1266-1272.
|
| [14] |
赵逸靖, 千庆兰. 中国国家级众创空间分布特征与影响因素分析[J]. 广州大学学报(自然科学版), 2018, 17(3):83-89.
|
| [15] |
|
| [16] |
|
| [17] |
刘向杰, 王敏, 刘承良. 创业空间的微区位模式及影响因素——以广州市为例[J]. 世界地理研究, 2023, 32(8):73-87.
|
| [18] |
唐凯, 翟国方, 何仲禹, 等. 南京市众创空间时空分布格局及演化机制研究[J]. 现代城市研究, 2019(4):52-59.
|
| [19] |
陈衎, 马文军. 共享办公选址策略分析——以上海为例[J]. 建筑与文化, 2019(1):191-193.
|
| [20] |
|
| [21] |
|
| [22] |
王晶, 甄峰. 城市众创空间的特征、机制及其空间规划应对[J]. 规划师, 2016, 32(9):5-10.
|
| [23] |
中国科学技术信息研究所. 国家创新型城市创新能力评价报告2020[M]. 北京: 科学技术文献出版社, 2020.
|
| [24] |
|
| [25] |
古恒宇, 沈体雁. 中国省级高技能人才迁移的时空演化机制J]. 地理学报, 2022, 77(10):2457-2473.
|
| [26] |
王波, 谢金燕, 王莉. 城市内部创新空间集聚烟花与环境要素对创新产出的影响——以深圳市为例[J]. 经济地理, 2024, 44(4):84-90.
|
/
| 〈 |
|
〉 |