
Quantitative Measurement and Multi-dimensional Comparison of a Major Growth Pole of China's Economy in the Chengdu-Chongqing Region
Received date: 2024-03-26
Revised date: 2025-07-27
Online published: 2025-10-17
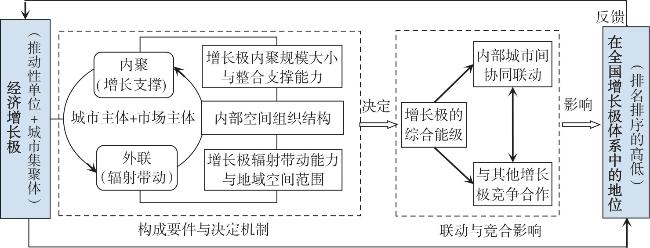
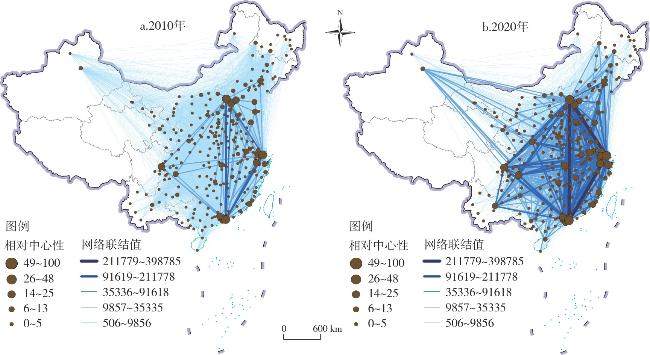
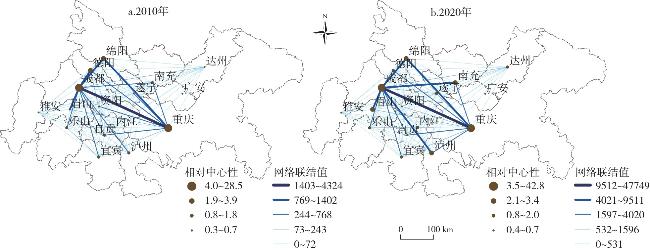
From the perspective of urban networks, this paper constructs a theoretical framework and measurement index system for the internal cohesion support and external driving force of growth poles, unified at a comprehensive level and influenced by the internal spatial organizational structure of the growth pole. The Chengdu-Chongqing economic circle in the Chengdu-Chongqing region is considered a key assessment object for China's major economic growth pole. Utilizing nationwide urban network data from 2000 to 2020 based on connections with China's top 1000 listed companies and 66,300 enterprises, the research quantitatively measures and comparatively analyzes its role, position, and evolution in the national urban network and the top ten growth poles. The results show that: 1) Under dual-core leadership, the breadth and depth of external connections, along with their radiating driving ability, continue to strengthen, gradually participating in shaping and expanding China's diamond-shaped multipolar network spatial development pattern. 2) Despite surpassing the Shandong Peninsula city cluster in comprehensive level ranking during the observation period and ranking fourth among the top ten growth poles nationwide, significant gaps persist in internal cohesion, external connectivity, and comprehensive levels compared to the existing three national-level growth poles. 3) Imbalances in internal spatial organizational structures, such as low network density, city polarization, and low poly-centrality, pose challenges to the development of small and medium-sized cities, limiting the further enhancement of comprehensive levels. In the future, concerted efforts should focus on optimizing structure, strengthening internal cohesion, and expanding external connections to effectively transform the Chengdu-Chongqing economic circle into a growth pole with national influence and a new source of momentum.
DING Ruxi , QIAO Yingying , MAO Zhonggen . Quantitative Measurement and Multi-dimensional Comparison of a Major Growth Pole of China's Economy in the Chengdu-Chongqing Region[J]. Economic geography, 2025 , 45(9) : 44 -54 . DOI: 10.15957/j.cnki.jjdl.2025.09.005
表1 增长极内聚性、外联度与内部空间结构测度指标及说明Tab.1 Index system and calculation method of cohesion, outreach and internal organization structure of growth pole |
| 维度 | 指标 | 计算方法及说明 | ||
|---|---|---|---|---|
| 节点城市层面 | 增长极(城市群)层面 | |||
| 综合 能级 | 内 聚 性 | 集聚性 | | 增长极内各节点城市联结值的加总 |
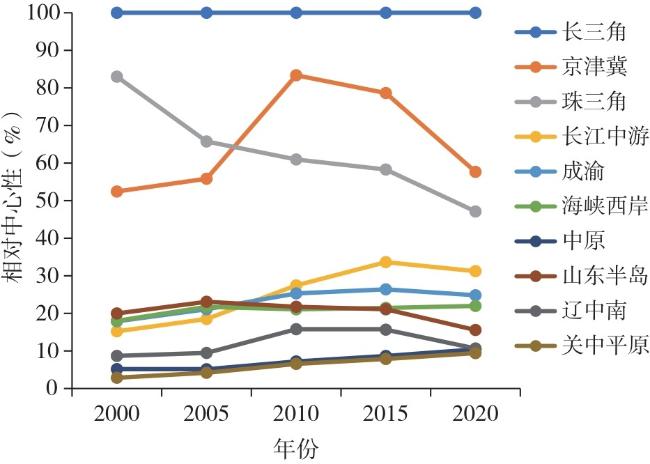
| 相对中心性 | | 各增长极全部城市联结集聚规模占十大增长极中最大联结集聚规模的比重 | ||
| 外 联 度 | 外联广度 | | 各增长极内所有城市外联广度的人口加权平均 | |
| 外联深度 | | 增长极外部联结值占当年全国城市网络联结总规模的比重 | ||
| 内部 空间 结构 | 网络密度 | - | D= | |
| 首位度 | - | | ||
| 多中心度 | - | | ||
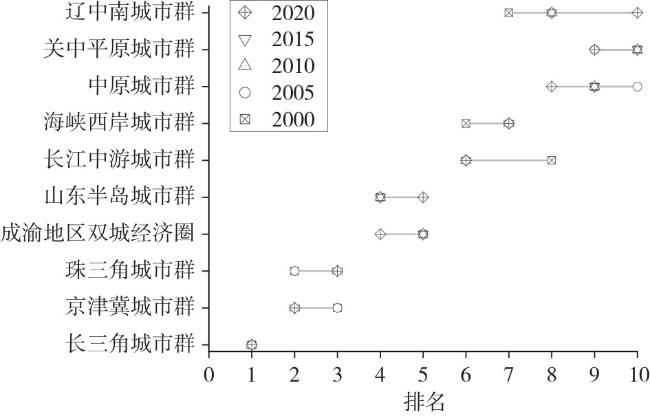
表2 全国十大增长极综合能级排名(2000—2020年)Tab.2 The index score and ranking of the top ten national growth poles(2000-2020) |
| 增长极 | 综合能级排名 | ||||
|---|---|---|---|---|---|
| 2000 | 2005 | 2010 | 2015 | 2020 | |
| 长三角城市群 | 1 | 1 | 1 | 1 | 1 |
| 京津冀城市群 | 3 | 3 | 2 | 2 | 2 |
| 珠三角城市群 | 2 | 2 | 3 | 3 | 3 |
| 成渝地区双城经济圈 | 5 | 5 | 5 | 5 | 4 |
| 山东半岛城市群 | 4 | 4 | 4 | 4 | 5 |
| 长江中游城市群 | 8 | 6 | 6 | 6 | 6 |
| 海峡西岸城市群 | 6 | 7 | 7 | 7 | 7 |
| 中原城市群 | 9 | 10 | 9 | 9 | 8 |
| 关中平原城市群 | 10 | 9 | 10 | 10 | 9 |
| 辽中南城市群 | 7 | 8 | 8 | 8 | 10 |
表3 全国十大增长极综合能级指标得分及排名(2020年)Tab.3 The index score and ranking of the top ten national growth poles in 2020 |
| 增长极 | 指数得分(标准化后) | 综合能级 排名 | ||
|---|---|---|---|---|
| 内聚性 | 外联度 | 综合能级 | ||
| 长三角城市群 | 1.000 | 1.000 | 1.000 | 1 |
| 京津冀城市群 | 0.482 | 0.823 | 0.651 | 2 |
| 珠三角城市群 | 0.316 | 0.678 | 0.494 | 3 |
| 成渝地区双城经济圈 | 0.116 | 0.333 | 0.220 | 4 |
| 山东半岛城市群 | 0.049 | 0.364 | 0.202 | 5 |
| 长江中游城市群 | 0.173 | 0.208 | 0.186 | 6 |
| 海峡西岸城市群 | 0.103 | 0.130 | 0.112 | 7 |
| 关中平原城市群 | 0.000 | 0.100 | 0.045 | 8 |
| 中原城市群 | 0.012 | 0.012 | 0.007 | 9 |
| 辽中南城市群 | 0.011 | 0.000 | 0.000 | 10 |
表4 基于分行业城市网络的测度结果及比较(2020年)Tab.4 Measurement results and comparison of urban networks by industry in 2020 |
| 增长极 | 制造业 | 科学研究和技术服务业 | 信息传输、软件和信息技术服务业 | |||||||||||
|---|---|---|---|---|---|---|---|---|---|---|---|---|---|---|
| 指数得分(标准化后) | 综合能级排名 | 指数得分(标准化后) | 综合能级排名 | 指数得分(标准化后) | 综合能级排名 | |||||||||
| 内聚性 | 外联度 | 综合能级 | 内聚性 | 外联度 | 综合能级 | 内聚性 | 外联度 | 综合能级 | ||||||
| 长三角城市群 | 1.000 | 1.000 | 1.000 | 1 | 1.000 | 0.910 | 1.000 | 1 | 0.770 | 1.000 | 0.903 | 2 | ||
| 京津冀城市群 | 0.353 | 0.659 | 0.496 | 3 | 0.904 | 1.000 | 0.997 | 2 | 0.252 | 0.792 | 0.528 | 3 | ||
| 珠三角城市群 | 0.378 | 0.727 | 0.543 | 2 | 0.220 | 0.462 | 0.337 | 3 | 1.000 | 0.959 | 1.000 | 1 | ||
| 成渝地区双城经济圈 | 0.152 | 0.449 | 0.286 | 5 | 0.078 | 0.286 | 0.166 | 4 | 0.122 | 0.529 | 0.324 | 4 | ||
| 长江中游城市群 | 0.431 | 0.484 | 0.446 | 4 | 0.129 | 0.159 | 0.125 | 5 | 0.119 | 0.348 | 0.229 | 5 | ||
| 山东半岛城市群 | 0.104 | 0.309 | 0.190 | 6 | 0.050 | 0.229 | 0.120 | 6 | 0.050 | 0.280 | 0.158 | 6 | ||
| 海峡西岸城市群 | 0.148 | 0.021 | 0.065 | 8 | 0.056 | 0.000 | 0.000 | 10 | 0.024 | 0.000 | 0.000 | 10 | ||
| 中原城市群 | 0.041 | 0.000 | 0.000 | 10 | 0.008 | 0.051 | 0.002 | 9 | 0.000 | 0.064 | 0.021 | 9 | ||
| 关中平原城市群 | 0.000 | 0.092 | 0.026 | 9 | 0.000 | 0.120 | 0.035 | 8 | 0.010 | 0.254 | 0.124 | 7 | ||
| 辽中南城市群 | 0.047 | 0.125 | 0.067 | 7 | 0.014 | 0.113 | 0.038 | 7 | 0.016 | 0.149 | 0.073 | 8 | ||
表5 2000、2010和2020年增长极的网络密度Tab.5 Network density of growth poles in 2000, 2010 and 2020 |
| 年份 | 京津冀城市群 | 长三角城市群 | 珠三角城市群 | 长江 中游 城市群 | 海峡 西岸 城市群 | 山东 半岛 城市群 | 成渝地区双城 经济圈 |
|---|---|---|---|---|---|---|---|
| 2000 | 0.198 | 0.163 | 0.250 | 0.185 | 0.184 | 0.321 | 0.175 |
| 2010 | 0.244 | 0.191 | 0.306 | 0.214 | 0.232 | 0.393 | 0.167 |
| 2020 | 0.321 | 0.225 | 0.333 | 0.209 | 0.184 | 0.429 | 0.200 |
表6 2000—2020年增长极的首位度指数Tab.6 Primacy index of growth poles from 2000 to 2020 |
| 年份 | 京津冀城市群 | 长三角城市群 | 珠三角城市群 | 长江 中游 城市群 | 海峡 西岸 城市群 | 山东 半岛 城市群 | 成渝地区双城 经济圈 |
|---|---|---|---|---|---|---|---|
| 2000 | 0.619 | 0.418 | 0.687 | 0.240 | 0.315 | 0.274 | 0.472 |
| 2005 | 0.502 | 0.369 | 0.643 | 0.224 | 0.264 | 0.360 | 0.397 |
| 2010 | 0.390 | 0.310 | 0.607 | 0.223 | 0.232 | 0.283 | 0.416 |
| 2015 | 0.421 | 0.297 | 0.554 | 0.246 | 0.203 | 0.281 | 0.418 |
| 2020 | 0.368 | 0.252 | 0.402 | 0.294 | 0.252 | 0.325 | 0.434 |
表7 2000、2010和2020年增长极内部多中心度指数(PF)Tab.7 Index of inner polycentricity of growth poles in 2000, 2010 and 2020(PF) |
| 年份 | 京津冀城市群 | 长三角城市群 | 珠三角城市群 | 长江 中游 城市群 | 海峡 西岸 城市群 | 山东 半岛 城市群 | 成渝地区双城 经济圈 |
|---|---|---|---|---|---|---|---|
| 2000 | 0.122 | 0.118 | 0.137 | 0.124 | 0.124 | 0.148 | 0.108 |
| 2010 | 0.151 | 0.137 | 0.170 | 0.150 | 0.155 | 0.175 | 0.097 |
| 2020 | 0.195 | 0.159 | 0.186 | 0.146 | 0.120 | 0.226 | 0.116 |
| [1] |
樊杰, 王亚飞. 40年来中国经济地理格局变化及新时代区域协调发展[J]. 经济地理, 2019, 39(1):1-7.
|
| [2] |
范恒山. 成渝地区双城经济圈建设的价值与使命[J]. 宏观经济管理, 2021(1):12-14.
|
| [3] |
陈子曦, 青梅, 杨玉琴. 成渝地区双城经济圈高质量发展水平测度及其时空收敛性[J]. 经济地理, 2022, 42(4):65-73.
|
| [4] |
李小建. 经济地理学(第二版)[M]. 北京: 高等教育出版社, 2006.
|
| [5] |
安虎森. 增长极形成机制及增长极与外围区的关系[J]. 南开学报(哲学社会科学版), 2007(4):90-101.
|
| [6] |
刘安长. 四大城市群竞争中国经济“第四极”的比较研究[J]. 理论月刊, 2013(10):118-122.
|
| [7] |
安江林. 现代化区域增长极体系建设:高质量发展的重要战略途径[J]. 甘肃社会科学, 2021(4):131-139.
|
| [8] |
王业强. 中国区域经济增长格局演变与国家增长极体系建设[J]. 当代经济科学, 2014, 36(1):39-45,125.
|
| [9] |
林喜庆. 角逐“中国经济第四增长极”研究——对各竞争主体的SWOT分析[J]. 重庆大学学报(社会科学版), 2009, 15(1):9-13.
|
| [10] |
何伟, 曾礼, 汪晓凤. “西三角”经济圈与中国经济增长第四极研究[J]. 探索, 2010(2):77-79.
|
| [11] |
魏后凯, 成艾华. 携手共同打造中国经济发展第四极——长江中游城市群发展战略研究[J]. 江汉论坛, 2012(4):5-15.
|
| [12] |
刘朝明, 董晖, 韩斌. 西部增长极与成渝经济区战略目标定位研究[J]. 经济学家, 2006(2):104-108.
|
| [13] |
张建升, 冉建宇. 成渝经济区与三大经济区区域差距比较[J]. 经济体制改革, 2011(4):56-59.
|
| [14] |
丁如曦, 倪鹏飞. 中国经济空间的新格局:基于城市房地产视角[J]. 中国工业经济, 2017(5):94-112.
|
| [15] |
|
| [16] |
|
| [17] |
|
| [18] |
|
| [19] |
|
| [20] |
|
| [21] |
|
| [22] |
|
| [23] |
尹俊, 甄峰, 王春慧. 基于金融企业布局的中国城市网络格局研究[J]. 经济地理, 2011, 31(5):754-759.
|
| [24] |
李兰冰, 刘秉镰. “十四五”时期中国区域经济发展的重大问题展望[J]. 管理世界, 2020, 36(5):36-51,8.
|
| [25] |
涂建军, 姚兰, 王静松, 等. 企业流视角下成渝城市群网络空间结构演变[J]. 经济地理, 2023, 43(4):83-95.
|
| [26] |
李培鑫, 张学良. 城市群集聚空间外部性与劳动力工资溢价[J]. 管理世界, 2021, 37(11):121-136.
|
| [27] |
潘文卿, 李子奈. 三大增长极对中国内陆地区经济的外溢性影响研究[J]. 经济研究, 2008(6):85-94.
|
| [28] |
涂建军, 况人瑞, 毛凯, 等. 成渝城市群高质量发展水平评价[J]. 经济地理, 2021, 41(7):50-60.
|
| [29] |
蒋小荣, 杨永春, 汪胜兰, 等. 基于上市公司数据的中国城市网络空间结构[J]. 城市规划, 2017, 41(6):18-26.
|
| [30] |
盛科荣, 王云靓, 樊杰. 中国城市网络空间结构的演化特征及机理研究——基于上市公司500强企业网络视角[J]. 经济地理, 2019, 39(11):84-93.
|
| [31] |
叶雅玲, 杨博飞, 何紫云, 等. 中国城市网络空间结构研究——基于A股上市医药公司网络[J]. 地理科学进展, 2018, 37(8):1096-1105.
|
| [32] |
马学广, 唐承辉. 中国城市网络化空间联系与格局——基于高铁客运流的大数据分析[J]. 经济地理, 2018, 38(4):55-64.
|
| [33] |
丁如曦, 赵磊, 李东坤. “一带一路”沿线城市网络的联结及其集聚性影响因素研究——基于生产性服务业跨国公司联系的视角[J]. 国际经贸探索, 2021, 37(11):37-51.
|
| [34] |
王雨飞, 倪鹏飞. 国家中心城市分功能评价与测度——基于多源采集数据[J]. 社会科学研究, 2020(3):31-42.
|
| [35] |
马海涛, 徐楦钫, 江凯乐. 中国城市群技术知识多中心性演化特征及创新效应[J]. 地理学报, 2023, 78(2):273-292.
|
| [36] |
肖金成. 我国城市群的发展阶段与十大城市群的功能定位[J]. 改革, 2009(9):5-23.
|
| [37] |
方创琳, 王振波, 马海涛. 中国城市群形成发育规律的理论认知与地理学贡献[J]. 地理学报, 2018, 73(4):651-665.
|
| [38] |
曾鹏, 黄图毅, 阙菲菲. 中国十大城市群空间结构特征比较研究[J]. 经济地理, 2011, 31(4):603-608.
|
| [39] |
王录仓, 刘海洋, 刘清. 基于腾讯迁徙大数据的中国城市网络研究[J]. 地理学报, 2021, 76(4):853-869.
|
/
| 〈 |
|
〉 |