
Coupling Coordination and Interactive Response of Population, Social Economy, Resources and Environment in the Qinghai-Tibet Plateau Region
Received date: 2024-07-25
Revised date: 2025-03-28
Online published: 2025-10-17
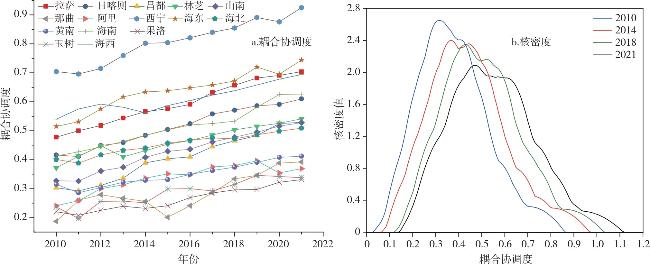
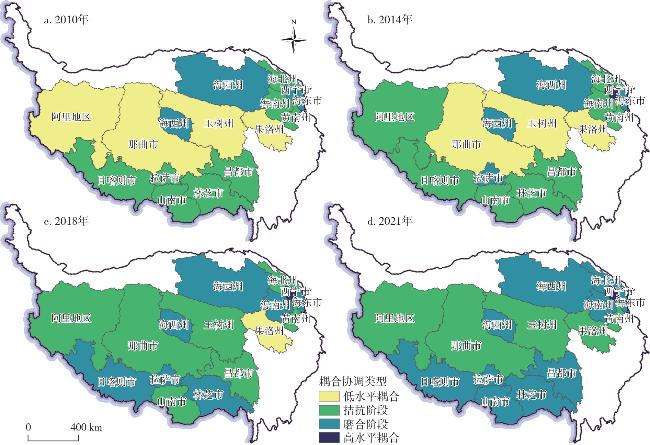
The Qinghai-Tibet Plateau region with many characteristics such as poor environment, fragile ecology and lagging development is a relatively special region in China in terms of ecological environment and socio-economic development. Based on the measurement of the development index of population, social economy and resource environment in the Qinghai-Tibet Plateau region by adopting the entropy method, this study comprehensively employs the coupling coordination model, Kernel density estimation, Dagum Gini coefficient and PVAR model to explore the spatio-temporal evolution characteristics of the coupling coordination relationship of the "population-social economy-resource and environment" complex system in the Qinghai-Tibet Plateau region and the interactive response relationship among subsystems. The results show that: 1) During the study period, the overall population and social economy evaluation index of the Qinghai-Tibet Plateau region showed an upward trend, while the evaluation index of resources and environment remained stable, and the population, social economy as well as resources and environment of most cities were in the middle and low level. 2) The coupling and mutual feedback effect of the composite system regarding "population-social economy-resource and environment" in Qinghai-Tibet Plateau region had become stronger; the cities with a higher degree of coupling coordination were mainly located in the eastern and southern regions, which were relatively low-lying and rich in water resources. 3) The social economy in the Qinghai-Tibet Plateau region had a positive impact on the population. The mutual effects between the social economy and the resource environment are initially positive, but they will gradually weaken until they turn negative.
LIU Qingfang , LI Mengqi , SONG Jinping , MIAO Lianjun . Coupling Coordination and Interactive Response of Population, Social Economy, Resources and Environment in the Qinghai-Tibet Plateau Region[J]. Economic geography, 2025 , 45(9) : 32 -43 . DOI: 10.15957/j.cnki.jjdl.2025.09.004
表1 区域人口、社会经济和资源环境评价指标体系及说明Tab.1 The evaluation indexes of population,social economy,as well as resource and environment |
| 系统层 | 准则层 | 指标层 | 属性 | 单位 | 权重 |
|---|---|---|---|---|---|
| 人 口 | 人口结构 | 城镇化率 | + | % | 0.5011 |
| 人口生活 | 城乡收入比 | - | / | 0.0602 | |
| 人均可支配收入 | + | 元 | 0.2877 | ||
| 恩格尔系数 | - | / | 0.0904 | ||
| 人均消费支出占人均可支配收入比例 | + | / | 0.0605 | ||
| 社 会 经 济 | 经济规模 | GDP | + | 万元 | 0.1506 |
| 一般公共预算收入 | + | 亿元 | 0.1882 | ||
| 社会消费品零售总额 | + | 亿元 | 0.2109 | ||
| 固定资产投资总额 | + | 万元 | 0.1379 | ||
| 经济结构 | 第三产业产值比重 | + | % | 0.0308 | |
| 人均GDP | + | 元 | 0.0804 | ||
| 一般公共预算收入占GDP的比重 | + | % | 0.0775 | ||
| S&T人员占比 | + | / | 0.0779 | ||
| 社会发展 | 生师比 | - | / | 0.0062 | |
| 教育人员平均工资水平 | + | 元 | 0.0233 | ||
| 卫生和社会工作人员平均工资水平 | + | 元 | 0.0165 | ||
| 资 源 环 境 | 资源禀赋 | 耕地面积 | + | hm2 | 0.7666 |
| 环境压力 | 化肥施用量 | - | 万t | 0.1293 | |
| 空气质量达到及好于二级的天数占比 | + | % | 0.0304 | ||
| PM2.5均值 | - | μg/m3 | 0.0737 |
表2 2010—2021年青藏高原地区人口综合评价指数Tab.2 Comprehensive assessment index of population in the Qinghai-Tibet Plateau region from 2010 to 2021 |
| 省区 | 地市州 | 2010 | 2011 | 2012 | 2013 | 2014 | 2015 | 2016 | 2017 | 2018 | 2019 | 2020 | 2021 |
|---|---|---|---|---|---|---|---|---|---|---|---|---|---|
| 西藏 | 拉萨 | 0.361 | 0.381 | 0.383 | 0.414 | 0.445 | 0.462 | 0.485 | 0.511 | 0.546 | 0.571 | 0.631 | 0.671 |
| 日喀则 | 0.187 | 0.184 | 0.200 | 0.215 | 0.240 | 0.260 | 0.279 | 0.304 | 0.331 | 0.359 | 0.363 | 0.397 | |
| 昌都 | 0.115 | 0.110 | 0.114 | 0.130 | 0.188 | 0.182 | 0.196 | 0.215 | 0.224 | 0.246 | 0.333 | 0.368 | |
| 林芝 | 0.284 | 0.292 | 0.303 | 0.324 | 0.393 | 0.425 | 0.457 | 0.492 | 0.512 | 0.545 | 0.592 | 0.633 | |
| 山南 | 0.153 | 0.146 | 0.170 | 0.183 | 0.238 | 0.270 | 0.266 | 0.298 | 0.320 | 0.356 | 0.429 | 0.468 | |
| 那曲 | 0.090 | 0.129 | 0.140 | 0.129 | 0.120 | 0.122 | 0.147 | 0.152 | 0.199 | 0.205 | 0.318 | 0.353 | |
| 阿里 | 0.137 | 0.150 | 0.179 | 0.220 | 0.258 | 0.284 | 0.314 | 0.370 | 0.389 | 0.412 | 0.489 | 0.535 | |
| 青海 | 西宁 | 0.536 | 0.450 | 0.475 | 0.593 | 0.674 | 0.624 | 0.643 | 0.655 | 0.676 | 0.761 | 0.732 | 0.839 |
| 海东 | 0.255 | 0.265 | 0.334 | 0.384 | 0.382 | 0.355 | 0.366 | 0.377 | 0.387 | 0.488 | 0.419 | 0.526 | |
| 海北 | 0.318 | 0.284 | 0.317 | 0.327 | 0.341 | 0.363 | 0.384 | 0.401 | 0.399 | 0.419 | 0.441 | 0.456 | |
| 黄南 | 0.257 | 0.236 | 0.257 | 0.287 | 0.300 | 0.304 | 0.317 | 0.328 | 0.338 | 0.357 | 0.376 | 0.394 | |
| 海南 | 0.290 | 0.286 | 0.307 | 0.317 | 0.327 | 0.332 | 0.345 | 0.354 | 0.363 | 0.513 | 0.541 | 0.537 | |
| 果洛 | 0.218 | 0.181 | 0.183 | 0.202 | 0.217 | 0.214 | 0.228 | 0.239 | 0.252 | 0.275 | 0.290 | 0.306 | |
| 玉树 | 0.217 | 0.098 | 0.134 | 0.155 | 0.172 | 0.184 | 0.193 | 0.200 | 0.219 | 0.244 | 0.267 | 0.279 | |
| 海西 | 0.611 | 0.633 | 0.644 | 0.781 | 0.797 | 0.671 | 0.686 | 0.698 | 0.723 | 0.762 | 0.772 | 0.798 |
表3 2010—2021年青藏高原地区社会经济综合评价指数Tab.3 Comprehensive evaluation index of social economy in the Qinghai-Tibet Plateau region from 2010 to 2021 |
| 省区 | 地市州 | 2010 | 2011 | 2012 | 2013 | 2014 | 2015 | 2016 | 2017 | 2018 | 2019 | 2020 | 2021 |
|---|---|---|---|---|---|---|---|---|---|---|---|---|---|
| 西藏 | 拉萨 | 0.150 | 0.188 | 0.226 | 0.274 | 0.318 | 0.340 | 0.376 | 0.443 | 0.500 | 0.553 | 0.525 | 0.539 |
| 日喀则 | 0.090 | 0.086 | 0.114 | 0.116 | 0.130 | 0.145 | 0.164 | 0.193 | 0.196 | 0.202 | 0.207 | 0.220 | |
| 昌都 | 0.075 | 0.072 | 0.087 | 0.089 | 0.096 | 0.122 | 0.119 | 0.155 | 0.179 | 0.183 | 0.193 | 0.181 | |
| 林芝 | 0.083 | 0.122 | 0.179 | 0.108 | 0.113 | 0.129 | 0.137 | 0.150 | 0.162 | 0.158 | 0.168 | 0.181 | |
| 山南 | 0.081 | 0.084 | 0.104 | 0.110 | 0.118 | 0.128 | 0.139 | 0.156 | 0.170 | 0.181 | 0.181 | 0.189 | |
| 那曲 | 0.088 | 0.096 | 0.113 | 0.109 | 0.114 | 0.127 | 0.135 | 0.121 | 0.132 | 0.132 | 0.137 | 0.133 | |
| 阿里 | 0.058 | 0.066 | 0.094 | 0.089 | 0.105 | 0.110 | 0.098 | 0.108 | 0.109 | 0.122 | 0.121 | 0.120 | |
| 青海 | 西宁 | 0.309 | 0.343 | 0.384 | 0.456 | 0.526 | 0.573 | 0.585 | 0.632 | 0.675 | 0.720 | 0.765 | 0.836 |
| 海东 | 0.095 | 0.105 | 0.119 | 0.146 | 0.170 | 0.193 | 0.199 | 0.208 | 0.222 | 0.242 | 0.260 | 0.272 | |
| 海北 | 0.070 | 0.067 | 0.078 | 0.091 | 0.096 | 0.101 | 0.102 | 0.103 | 0.099 | 0.106 | 0.109 | 0.118 | |
| 黄南 | 0.059 | 0.044 | 0.048 | 0.054 | 0.056 | 0.066 | 0.071 | 0.071 | 0.076 | 0.082 | 0.086 | 0.089 | |
| 海南 | 0.067 | 0.074 | 0.082 | 0.098 | 0.116 | 0.133 | 0.144 | 0.145 | 0.149 | 0.156 | 0.182 | 0.198 | |
| 果洛 | 0.041 | 0.039 | 0.045 | 0.050 | 0.053 | 0.071 | 0.077 | 0.071 | 0.070 | 0.065 | 0.067 | 0.071 | |
| 玉树 | 0.034 | 0.047 | 0.059 | 0.050 | 0.044 | 0.062 | 0.059 | 0.053 | 0.062 | 0.074 | 0.059 | 0.059 | |
| 海西 | 0.232 | 0.285 | 0.321 | 0.269 | 0.259 | 0.258 | 0.266 | 0.299 | 0.326 | 0.331 | 0.414 | 0.407 |
表4 2010—2021年青藏高原地区资源环境综合评价指数Tab.4 Comprehensive assessment index of resources and environment in the Qinghai-Tibet Plateau region from 2010 to 2021 |
| 省区 | 地市州 | 2010 | 2011 | 2012 | 2013 | 2014 | 2015 | 2016 | 2017 | 2018 | 2019 | 2020 | 2021 |
|---|---|---|---|---|---|---|---|---|---|---|---|---|---|
| 西藏 | 拉萨 | 0.321 | 0.313 | 0.312 | 0.310 | 0.309 | 0.307 | 0.304 | 0.327 | 0.332 | 0.341 | 0.345 | 0.346 |
| 日喀则 | 0.500 | 0.505 | 0.505 | 0.501 | 0.504 | 0.500 | 0.496 | 0.517 | 0.518 | 0.525 | 0.528 | 0.528 | |
| 昌都 | 0.374 | 0.374 | 0.373 | 0.373 | 0.371 | 0.363 | 0.363 | 0.368 | 0.373 | 0.382 | 0.386 | 0.385 | |
| 林芝 | 0.275 | 0.280 | 0.278 | 0.278 | 0.277 | 0.282 | 0.281 | 0.285 | 0.295 | 0.305 | 0.301 | 0.301 | |
| 山南 | 0.308 | 0.311 | 0.312 | 0.313 | 0.311 | 0.314 | 0.315 | 0.321 | 0.322 | 0.324 | 0.324 | 0.323 | |
| 那曲 | 0.216 | 0.217 | 0.218 | 0.217 | 0.214 | 0.186 | 0.191 | 0.213 | 0.225 | 0.233 | 0.233 | 0.231 | |
| 阿里 | 0.225 | 0.224 | 0.225 | 0.224 | 0.221 | 0.224 | 0.223 | 0.228 | 0.228 | 0.230 | 0.200 | 0.204 | |
| 青海 | 西宁 | 0.574 | 0.585 | 0.576 | 0.546 | 0.554 | 0.558 | 0.585 | 0.600 | 0.601 | 0.623 | 0.570 | 0.604 |
| 海东 | 0.822 | 0.823 | 0.820 | 0.807 | 0.805 | 0.796 | 0.806 | 0.810 | 0.820 | 0.839 | 0.775 | 0.824 | |
| 海北 | 0.345 | 0.349 | 0.354 | 0.347 | 0.344 | 0.358 | 0.367 | 0.374 | 0.375 | 0.383 | 0.392 | 0.389 | |
| 黄南 | 0.248 | 0.258 | 0.261 | 0.258 | 0.257 | 0.240 | 0.249 | 0.265 | 0.267 | 0.275 | 0.288 | 0.281 | |
| 海南 | 0.420 | 0.434 | 0.428 | 0.418 | 0.421 | 0.429 | 0.444 | 0.449 | 0.453 | 0.464 | 0.524 | 0.493 | |
| 果洛 | 0.201 | 0.204 | 0.207 | 0.205 | 0.196 | 0.193 | 0.200 | 0.210 | 0.216 | 0.217 | 0.233 | 0.233 | |
| 玉树 | 0.245 | 0.247 | 0.248 | 0.247 | 0.240 | 0.257 | 0.260 | 0.258 | 0.262 | 0.269 | 0.285 | 0.273 | |
| 海西 | 0.274 | 0.285 | 0.287 | 0.273 | 0.258 | 0.303 | 0.318 | 0.323 | 0.325 | 0.342 | 0.329 | 0.349 |
表5 方差分解结果Tab.5 The results of variance decomposition |
| 响应变量 | 冲击变量 | |||
|---|---|---|---|---|
| 预测期 | POP | ECO | ENV | |
| POP | 1 | 1.000 | 0.000 | 0.000 |
| POP | 5 | 0.871 | 0.076 | 0.053 |
| POP | 15 | 0.812 | 0.104 | 0.084 |
| POP | 20 | 0.810 | 0.105 | 0.085 |
| ECO | 1 | 0.004 | 0.996 | 0.000 |
| ECO | 5 | 0.098 | 0.886 | 0.015 |
| ECO | 15 | 0.236 | 0.745 | 0.019 |
| ECO | 20 | 0.245 | 0.734 | 0.021 |
| ENV | 1 | 0.072 | 0.022 | 0.906 |
| ENV | 5 | 0.204 | 0.029 | 0.767 |
| ENV | 15 | 0.346 | 0.073 | 0.581 |
| ENV | 20 | 0.348 | 0.075 | 0.576 |
| [1] |
尹力, 魏伟, 李泓锐, 等. 中国陆域国土空间格局演变的时空分异与影响因素——基于胡焕庸线与博台线的对比分析[J]. 地理研究, 2025, 44(2):552-576.
|
| [2] |
杨振, 张小雷, 李建刚, 等. 中国地级单元城镇化与经济发展关系的时空格局——基于2000年和2010年人口普查数据的探析[J]. 地理研究, 2020, 39(1):25-40.
|
| [3] |
刘庆芳, 杨定, 杨振山, 等. 青藏高原国家公园群人文生态系统耦合协调评价及障碍因子识别[J]. 地理学报, 2023, 78(5):1119-1135.
|
| [4] |
|
| [5] |
|
| [6] |
|
| [7] |
|
| [8] |
|
| [9] |
|
| [10] |
|
| [11] |
|
| [12] |
|
| [13] |
虎陈霞, 傅伯杰, 陈利顶. 浅析退耕还林还草对黄土丘陵沟壑区农业与农村经济发展的影响——以安塞县为例[J]. 干旱区资源与环境, 2006(4):67-72.
|
| [14] |
王帅, 傅伯杰, 武旭同, 等. 黄土高原社会—生态系统变化及其可持续性[J]. 资源科学, 2020, 42(1):96-103.
|
| [15] |
傅伯杰. 黄土高原土地利用变化的生态环境效应[J]. 科学通报, 2022, 67(32):3769-3779,3768.
|
| [16] |
刘浩, 张毅, 郑文升. 城市土地集约利用与区域城市化的时空耦合协调发展评价——以环渤海地区城市为例[J]. 地理研究, 2011, 30(10):1805-1817.
|
| [17] |
黄木易, 程志光. 区域城市化与社会经济耦合协调发展度的时空特征分析——以安徽省为例[J]. 经济地理, 2012, 32(2):77-81.
|
| [18] |
王毅, 丁正山, 余茂军, 等. 基于耦合模型的现代服务业与城市化协调关系量化分析——以江苏省常熟市为例[J]. 地理研究, 2015, 34(1):97-108.
|
| [19] |
苗龙, 文炳勋, 文倩雅. 中国地方财政教育投入与经济发展水平的时空耦合协调关系研究[J]. 经济地理, 2021, 41(12):149-157.
|
| [20] |
钟业喜, 陆玉麒. 鄱阳湖生态经济区人口与经济空间耦合研究[J]. 经济地理, 2011, 31(2):195-200.
|
| [21] |
李恒吉, 曲建升, 庞家幸, 等. 甘肃省人口—经济—社会—资源—环境系统耦合协调及可持续发展时空综合测度研究[J]. 干旱区地理, 2020, 43(6):1622-1634.
|
| [22] |
曹黎. 川甘青结合部藏区经济发展特征[J]. 开发研究, 2017, 191(4):79-84.
|
| [23] |
冯雨雪, 李广东. 青藏高原城镇化与生态环境交互影响关系分析[J]. 地理学报, 2020, 75(7):1386-1405.
|
| [24] |
吴传钧. 论地理学的研究核心——人地关系地域系统[J]. 经济地理, 1991, 11(3):1-6.
|
| [25] |
杨青山. 对人地关系地域系统协调发展的概念性认识[J]. 经济地理, 2002, 22(3):289-292.
|
| [26] |
吴文恒, 牛叔文. 甘肃省人口与资源环境耦合的演进分析[J]. 中国人口科学, 2006(2):81-86,96.
|
| [27] |
饶清华, 林秀珠, 李家兵, 等. 流域社会经济与水环境质量耦合协调度分析[J]. 中国环境科学, 2019, 39(4):1784-1792.
|
| [28] |
王敏, 张晓平. 生态脆弱区社会经济与资源环境耦合协调度研究:以云南省昭通市为例[J]. 中国科学院大学学报, 2017, 34(6):684-691.
|
| [29] |
马志远, 段学军, 王磊, 等. 长江经济带区域发展与资源环境承载力空间耦合特征及高质量发展路径[J]. 长江流域资源与环境, 2022, 31(9):1873-1883.
|
| [30] |
姜磊, 柏玲, 吴玉鸣. 中国省域经济、资源与环境协调分析——兼论三系统耦合公式及其扩展形式[J]. 自然资源学报, 2017, 32(5):788-799.
|
| [31] |
兰利, 李钢, 李秉承, 等. 河南省盗掘文物犯罪的案件特征、空间格局与形成机制[J]. 地理科学进展, 2024, 43(11):2312-2326.
|
| [32] |
邵汉华, 王庆祥, 何铿辉. 绿色技术创新对省域减污与降碳协同水平的影响及其驱动机制[J]. 经济地理, 2025, 45(1):17-24,35.
|
| [33] |
徐海峰, 王晓东. 现代服务业是否有助于推动城镇化?——基于产城融合视角的PVAR模型分析[J]. 中国管理科学, 2020, 28(4):195-206.
|
/
| 〈 |
|
〉 |