
Spatial Distribution and Heterogeneity of Influencing Factors for National Key Leading Enterprises in China's Agricultural Industrialization
Received date: 2025-04-02
Revised date: 2025-08-12
Online published: 2025-10-17
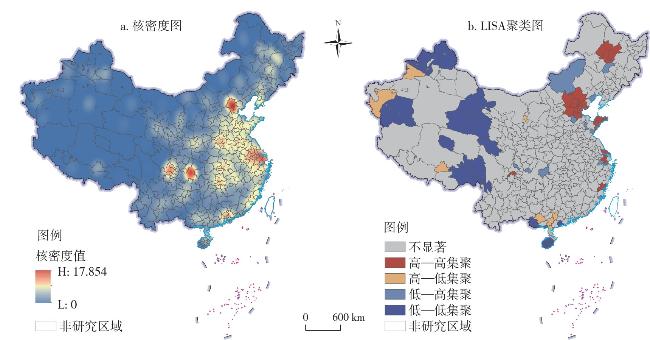
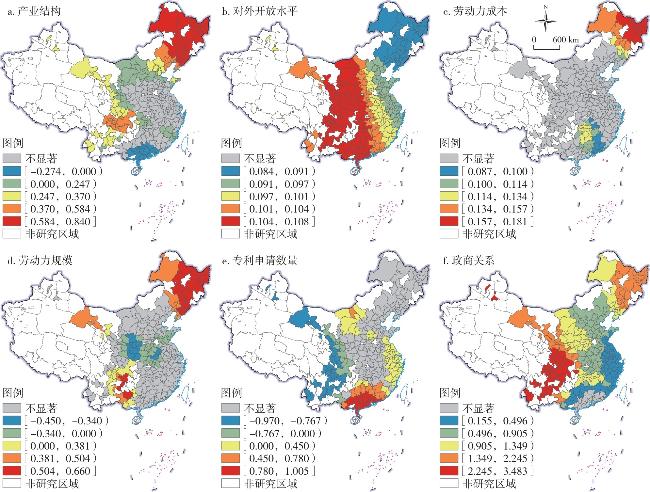
The article is based on data from 2285 national key leading enterprises in China's agricultural industrialization. It uses kernel density estimation, spatial autocorrelation analysis, optimal parameter geographic detector, and multi-scale geographic weighted regression (MGWR) models to explore the spatial pattern, influencing factors, and spatial heterogeneity of the distribution of national key leading enterprises in China's agricultural industrialization. The results show that: 1) National key leading enterprises in China's agricultural industrialization generally exhibit an "east-heavy, west-light" spatial distribution pattern, with a density that displays a "tripolar, multi-core" characteristic. 2) Natural geographical environment, economic development environment, technological innovation capabilities, transportation location conditions, and policy support all jointly influence the distribution of key national agricultural industrialization enterprises, and there are significant differences in the explanatory power of different influencing factors. 3) The dominant factors influencing the distribution of key national leading enterprises in China's agricultural industrialization exhibit different scale effects. The level of openness to the outside world is a global variable, while labor costs, the number of patent applications, industrial structure, labor force size, and government-business relations are local variables. 4) The distribution of national key leading enterprises in China's agricultural industrialization exhibits spatial heterogeneity in influencing factors. Among these, the Northeast region shows high values for the impacts of industrial structure, labor costs, and labor scale. The influence of openness to the outside world presents an east-west spatial differentiation pattern. The Pearl River Delta urban cluster demonstrates high values for the impact of patent application volume, while western regions exhibit high values for the influence of government-business relations.
QIN Lingui , LIU Songqi , SHEN Tiyan , MA Nan . Spatial Distribution and Heterogeneity of Influencing Factors for National Key Leading Enterprises in China's Agricultural Industrialization[J]. Economic geography, 2025 , 45(9) : 110 -118 . DOI: 10.15957/j.cnki.jjdl.2025.09.011
表1 变量定义及说明Tab.1 Definition and explanation of variables |
| 变量类型 | 变量名称 | 变量描述 | 数据来源 | |
|---|---|---|---|---|
| 因变量 | 龙头企业数量 | 农业产业化国家重点龙头企业数量(家) | 农业农村部、企查查 | |
| 自变量 | 自然地理环境 | 气温 | 平均气温(℃) | Global Surface Summary of the Day (GSOD) |
| 降水 | 年降水量(mm) | Global Surface Summary of the Day (GSOD) | ||
| 坡度 | 平均坡度(°) | ASTER Global Digital Elevation Model V003 | ||
| 高程 | 平均高程(m) | ASTER Global Digital Elevation Model V003 | ||
| 经济发展环境 | 产业结构 | 第一产业产值/GDP(%) | 《中国城市统计年鉴(2023)》 | |
| 对外开放水平 | 实际利用外商直接投资额/GDP(%) | 《中国城市统计年鉴(2023)》 | ||
| 劳动力成本 | 在岗职工平均工资(元) | 《中国城市统计年鉴(2023)》 | ||
| 劳动力规模 | 第一产业从业人员数(万人) | 《中国城市统计年鉴(2023)》 | ||
| 技术创新能力 | 专利申请数量 | 专利申请数量(件) | 国家知识产权局 | |
| 交通区位条件 | 公路密度 | 公路里程/行政区面积(km/km2) | 《中国城市统计年鉴(2023)》 | |
| 距省会城市距离 | 距离最近省会城市的距离(km) | 全国基础地理数据库 | ||
| 政策支持力度 | 政商关系 | 政商关系健康指数(-) | 《中国城市政商关系评价报告(2023)》 | |
| 地方财政支出 | 一般公共预算支出/GDP(%) | 《中国城市统计年鉴(2023)》 | ||
表2 中国农业产业化国家重点龙头企业分布影响因素的地理探测结果Tab.2 Geographical detection results of factors influencing the distribution of national key leading enterprises in China's agricultural industrialization |
| 变量 | q值 | P值 | 排名 |
|---|---|---|---|
| 气温 | 0.049 | 0.182 | 13 |
| 降水 | 0.055 | 0.084 | 11 |
| 坡度 | 0.073 | 0.029 | 10 |
| 高程 | 0.050 | 0.329 | 12 |
| 产业结构 | 0.166 | 0.002 | 4 |
| 对外开放水平 | 0.130 | 0.057 | 5 |
| 劳动力成本 | 0.293 | 0.000 | 3 |
| 劳动力规模 | 0.109 | 0.001 | 6 |
| 专利申请数量 | 0.410 | 0.000 | 1 |
| 公路密度 | 0.095 | 0.005 | 7 |
| 距省会城市距离 | 0.091 | 0.107 | 9 |
| 政商关系 | 0.315 | 0.000 | 2 |
| 地方财政支出 | 0.093 | 0.005 | 8 |
表3 OLS、GWR、MGWR模型回归结果对比Tab.3 Comparison of regression results of OLS, GWR, and MGWR models |
| 模型 | OLS | GWR | MGWR |
|---|---|---|---|
| R2 | 0.355 | 0.784 | 0.786 |
| Adj. R2 | 0.340 | 0.719 | 0.741 |
| 残差平方和 | 175.480 | 58.722 | 58.139 |
| AICc | 669.239 | 521.517 | 469.497 |
| Log-L | -326.346 | -177.465 | -176.109 |
表4 MGWR模型回归系数描述性统计结果Tab.4 Descriptive statistics of MGWR model regression coefficients |
| 变量 | 显著的样本量(比例/%) | 均值 | 标准差 | 最小值 | 中位数 | 最大值 |
|---|---|---|---|---|---|---|
| 产业结构 | 144(52.94) | 0.298 | 0.308 | -0.274 | 0.268 | 0.840 |
| 对外开放水平 | 272(100.00) | 0.100 | 0.006 | 0.084 | 0.101 | 0.108 |
| 劳动力成本 | 50(18.38) | 0.126 | 0.028 | 0.087 | 0.118 | 0.181 |
| 劳动力规模 | 101(37.13) | 0.116 | 0.405 | -0.450 | 0.295 | 0.660 |
| 专利申请数量 | 131(48.16) | 0.080 | 0.678 | -0.970 | 0.305 | 1.005 |
| 政商关系 | 248(91.18) | 1.154 | 0.856 | 0.155 | 0.947 | 3.483 |
| [1] |
万江红, 李城. 农业产业化龙头企业层级化联结产业组织模式研究——以鄂西N公司为例[J]. 武汉大学学报(哲学社会科学版), 2025, 78(2):96-109.
|
| [2] |
张延龙, 王明哲, 钱静斐, 等. 中国农业产业化龙头企业发展特点、问题及发展思路[J]. 农业经济问题, 2021(8):135-144.
|
| [3] |
黄连贵, 张照新, 张涛. 我国农业产业化发展现状、成效及未来发展思路[J]. 经济研究参考, 2008(31):23-33.
|
| [4] |
蒋辉, 刘兆阳. 中国农业产业化龙头企业空间分布特征及其影响因素[J]. 吉首大学学报(社会科学版), 2020, 41(6):94-101.
|
| [5] |
|
| [6] |
李扬, 盛科荣, 卢超. 农业产业化发展的区域差异及影响因素[J]. 江苏农业学报, 2021, 37(3):763-771.
|
| [7] |
杨明洪, 孙继琼. 农业产业化发展的空间分布与影响因素分析——以农业产业化国家重点龙头企业为例[J]. 财经科学, 2008(7):103-110.
|
| [8] |
刘宇鹏, 李彤, 赵慧峰. 农业产业化促进农民收入增长的影响因素分析——基于河北省坝上地区的实地调查[J]. 江苏农业科学, 2012, 40(3):375-378.
|
| [9] |
乔晗, 刘奥龙, 邱珂欣. 农业产业集聚与县域经济增长——来自河南现代农业产业园设立准自然实验的证据[J]. 商业经济与管理, 2023(11):87-100.
|
| [10] |
朱伟永, 明辉, 王冲. 龙头企业、专利投入与农业产业高质量发展研究[J]. 中国农业资源与区划, 2021, 42(5):22-31.
|
| [11] |
薛洲, 高强. 农业产业化国家重点龙头企业认定政策能促进企业创新吗[J]. 农业技术经济, 2024(10):125-144.
|
| [12] |
周科选, 余林徽. 农业龙头企业认定对中国食品制造企业出口的影响——来自农业产业化国家重点龙头企业的证据[J]. 兰州学刊, 2022(3):131-148.
|
| [13] |
张笑寒, 汤晓倩. 农业产业化联合体参与主体的绿色生产行为研究——基于政府激励视角[J]. 农林经济管理学报, 2021, 20(2):187-198.
|
| [14] |
谢金丽, 胡冰川. 农产品电商对农业产业化龙头企业的影响分析——基于倾向值匹配法(PSM)估计[J]. 农村经济, 2020(5):129-136.
|
| [15] |
熊友云, 张明军, 刘园园, 等. 中国农业产业化龙头企业空间分布特征——以国家级重点龙头企业为例[J]. 地理科学进展, 2009, 28(6):991-997.
|
| [16] |
张国防, 程秀娟, 熊肖雷. 我国农业龙头企业发展:基本态势、现实困境及路径选择[J]. 农业经济, 2024(5):7-10.
|
| [17] |
李雨欣, 张平宇, 杨奇峰, 等. 中俄边境地区外贸企业资本分布的影响因素及尺度效应[J]. 经济地理, 2024, 44(2):102-111.
|
| [18] |
卢盛峰, 王靖, 陈思霞. 行政中心的经济收益——来自中国政府驻地迁移的证据[J]. 中国工业经济, 2019(11):24-41.
|
| [19] |
于英杰, 杜德斌, 段德忠. 中国科技型企业的空间分布及影响因素[J]. 地理科学, 2025, 45(3):518-530.
|
| [20] |
张国俊, 王运喆, 陈宇, 等. 中国城市群高质量发展的时空特征及分异机理[J]. 地理研究, 2022, 41(8):2109-2124.
|
| [21] |
冉钊, 刘彦随, 高建华. 黄河中下游地区人水关系多尺度演化及其影响因素[J]. 资源科学, 2025, 47(3):572-586.
|
| [22] |
沈体雁, 于瀚辰, 周麟, 等. 北京市二手住宅价格影响机制——基于多尺度地理加权回归模型(MGWR)的研究[J]. 经济地理, 2020, 40(3):75-83.
|
| [23] |
牛彦龙, 王毅. 基于MGWR模型的太行山区传统村落空间分异格局与影响机制研究[J]. 干旱区资源与环境, 2024, 38(9):87-96.
|
| [24] |
古恒宇, 沈体雁. 中国高学历人才的空间演化特征及驱动因素[J]. 地理学报, 2021, 76(2):326-340.
|
| [25] |
|
| [26] |
张国俊, 邓鸿鹄. 珠江三角洲地区服务业与城镇化协调关系的时空演变[J]. 地理科学, 2018, 38(7):1118-1128.
|
| [27] |
叶长盛, 王枫. 珠江三角洲地区土地利用和景观格局变化研究[J]. 水土保持通报, 2012, 32(1):238-243.
|
| [28] |
沈静, 陈烈, 孙海燕. 全球化背景下的湛江市域发展战略研究[J]. 经济地理, 2004, 24(4):494-498.
|
| [29] |
张磊, 张曙霄. 中国对外贸易地理空间结构发展现状及重构研究[J]. 求是学刊, 2019, 46(5):72-80.
|
| [30] |
|
| [31] |
王雷. 劳动力成本、就业保护与企业技术创新[J]. 中国人口科学, 2017(1):71-80.
|
| [32] |
张星星, 曾辉. 基于多尺度主成分面板模型的中国耕地压力动态变化及驱动力分析[J]. 中国人口·资源与环境, 2014, 24(S3):204-208.
|
| [33] |
肖凡, 王姣娥, 黄宇金, 等. 中国高新技术企业分布影响因素的空间异质性与尺度效应[J]. 地理研究, 2022, 41(5):1338-1351.
|
| [34] |
张杨, 宋林, 朱小宝. 两阶段视角下中国区域专利结构效率研究[J]. 情报杂志, 2020, 39(1):201-207.
|
| [35] |
许岩, 曾国平, 曹跃群. 市场化改革对人力资本外部性的影响研究[J]. 重庆大学学报(社会科学版), 2017, 23(5):18-29.
|
/
| 〈 |
|
〉 |