
Impact Mechanism of the Digital Economy on the Green Development Efficiency in the Yangtze River Delta Region
Received date: 2024-06-22
Revised date: 2025-01-15
Online published: 2025-07-07
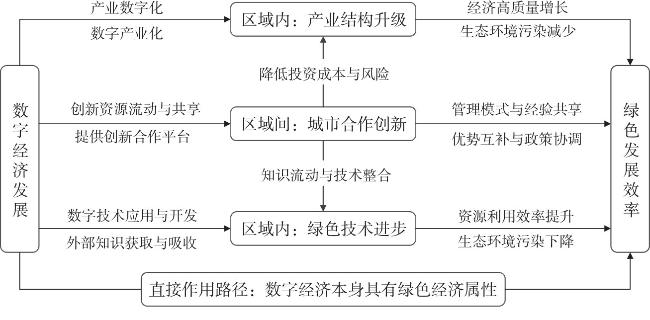
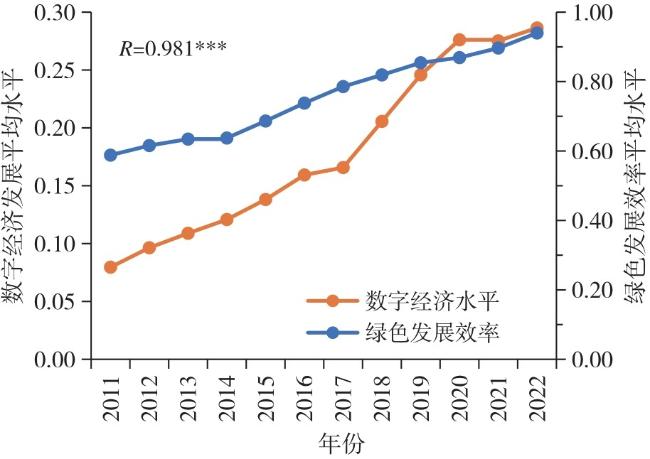
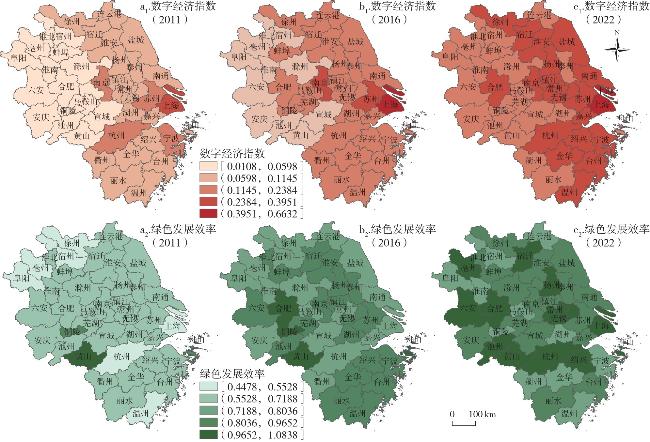
Digital economy is an important force driving the regional green development and a strategic need to empower the high-quality integration in the Yangtze River Delta (YRD) region. This paper uses the methods of econometric regression model and chain mediation model to explore the mechanism of digital development on the green development efficiency in the Yangtze River Delta region. It's found that: 1) Both digital development and green development efficiency in the YRD region are rapidly improving, and have significant spatial and temporal heterogeneity and non-equilibrium development characteristics. 2) The digital economy can positively affect the green development efficiency through the parallel intermediary paths and chain intermediary paths of urban intercity cooperation on innovation, industrial structure upgrading and green technological innovation, with the total intermediary effect coefficient of 0.861, and the independent intermediary effect and chain intermediary effect accounting for 70.15% and 29.85%, respectively. 3) The impact intensity of the digital economy on the green development efficiency has heterogeneity in different grades of cities, the digital economy development is more able to promote the improvement of urban green development efficiency in high-grade cities. The research conclusions can provide decision-making references for the coordinated development of digitalization and greening in the Yangtze River Delta region and other areas.
CHEN Hongji , HU Senlin , ZENG Gang , CHEN Pengxin , WANG Jiawei , WAN Yuanyuan . Impact Mechanism of the Digital Economy on the Green Development Efficiency in the Yangtze River Delta Region[J]. Economic geography, 2025 , 45(5) : 13 -22 . DOI: 10.15957/j.cnki.jjdl.2025.05.002
表1 区域绿色发展效率评价体系及说明Tab.1 Evaluation system of green development efficiency and its explanation |
| 一级指标 | 二级指标 | 三级指标 | 代理指标 | 属性 | |
|---|---|---|---|---|---|
| 绿 色 发 展 效 率 | 投入 | 资本投入 | 环境治理投入费用、政府教育支出和政府科学事业费支出三者之和作为资本投入(万元) | + | |
| 劳动投入 | 科研技术服务业就业人数(万人) | + | |||
| 资源投入 | 全社会用电量(亿kW·h) | + | |||
| 产出 | 期望产出 | 经济效益 | 城市人均GDP(元/人) | + | |
| 社会效益 | 社会消费品零售总额(万元) | + | |||
| 生态效益 | 建成区绿化覆盖率(%) | + | |||
| 非期望产出 | 废水排放 | 工业废水排放量(t) | - | ||
| 废气排放 | 工业SO2排放量(t) | - | |||
| 粉尘排放 | 工业烟尘排放量(t) | - | |||
表2 区域数字经济发展水平评价指标体系及说明Tab.2 Evaluation system of regional digital economy and its explanation |
| 一级指标 | 二级指标 | 三级指标 | 熵值法权重 | 层次分析法权重 | 综合权重 |
|---|---|---|---|---|---|
| 数字基础设施 | 固定宽带基础 | 每百人互联网用户数(户/百人) | 0.0437 | 0.0324 | 0.0381 |
| 互联网基础 | 每百人移动电话用户数(户/百人) | 0.0504 | 0.0325 | 0.0415 | |
| 数字发展环境 | 数字行业从业人数 | 信息传输、软件和信息技术服务从业人员(万人) | 0.0506 | 0.2031 | 0.1269 |
| 数字经济重视程度 | 数字经济关注度 | 0.2416 | 0.0231 | 0.1323 | |
| 科学技术支出 | 科学技术支出(万元) | 0.0696 | 0.1765 | 0.1231 | |
| 数字产业化 | 电信业务 | 人均电信业务总量(万元/人) | 0.1768 | 0.0677 | 0.1223 |
| 邮政业务 | 人均邮政业务总量(万元/人) | 0.1856 | 0.0678 | 0.1267 | |
| 产业数字化 | 数字创新水平 | 数字专利(件) | 0.1502 | 0.2979 | 0.2241 |
| 数字金融水平 | 数字普惠金融指数 | 0.0316 | 0.0992 | 0.0654 |
表3 2011—2022年长三角地区数字经济与绿色发展效率的回归结果Tab.3 Regression results of digital economy and green development efficiency in the Yangtze River Delta region from 2011 to 2022 |
| 解释 变量 | 模型1 | 模型2 | 模型3 | 模型4 | 模型5 |
|---|---|---|---|---|---|
| GDE | GDE | lnUCI | lnINS | lnGTI | |
| lnDEI | 1.297*** | 1.014*** | 0.239*** | 0.868*** | 0.368*** |
| (27.723) | (15.880) | (3.332) | (20.883) | (7.785) | |
| lnUED | 0.073*** | 0.095*** | -0.060*** | 0.126*** | |
| (4.994) | (5.752) | (-6.263) | (11.584) | ||
| lnDGS | -0.179 | 0.126 | -0.036 | 0.162 | |
| (-1.308) | (0.814) | (-0.403) | (1.599) | ||
| lnLOU | -0.846*** | -0.209 | -0.483** | 0.212 | |
| (-2.657) | (-0.584) | (-2.330) | (0.898) | ||
| lnER | 3.611*** | -4.728*** | 5.037*** | -2.247** | |
| (2.776) | (-3.230) | (5.949) | (-2.334) |
表4 多重中介路径逐步回归结果Tab.4 Results of stepwise regression with multiple intermediary paths |
| 变量 | 模型1 | 模型2 | 模型3 | 模型4 | 模型5 | 模型6 | 模型7 |
|---|---|---|---|---|---|---|---|
| GDE | GDE | GDE | lnINS | lnGTI | GDE | GDE | |
| lnDEI | 0.972***(15.321) | 0.560***(6.628) | 0.943***(13.984) | 0.860***(20.456) | 0.249***(7.904) | 0.535***(6.425) | 0.976***(14.386) |
| lnUCI | 0.174***(4.221) | 0.132***(4.154) | 0.495***(24.080) | 0.158***(4.060) | 0.182***(2.895) | ||
| lnINS | 0.523***(7.632) | 0.508***(7.530) | |||||
| lnGTI | 0.293***(4.044) | 0.115***(3.155) | |||||
| 控制变量 | 是 | 是 | 是 | 是 | 是 | 是 | 是 |
表5 多重中介效应检验结果Tab.5 Test results of multiple mediation effects |
| 检验方法 | 总中介效应 | UCI的中介效应 | INS的中介效应 | GTI的中介效应 | UCI与INS的链式中介效应 | UCI与GTI的链式中介效应 |
|---|---|---|---|---|---|---|
| Bootstrap抽样法 | 0.861***(7.674) | 0.231***(3.192) | 0.252***(7.101) | 0.121***(3.842) | 0.142***(3.831) | 0.115***(2.991) |
表6 城市异质性分析结果Tab.6 Results of heterogeneity analysis in different grades of cities |
| 变量 | 高等级城市 | 一般等级城市 | |||||||
|---|---|---|---|---|---|---|---|---|---|
| 模型1 | 模型2 | 模型3 | 模型4 | 模型1 | 模型2 | 模型3 | 模型4 | ||
| GDE | GDE | GDE | GDE | GDE | GDE | GDE | GDE | ||
| lnDEI | 0.879***(11.955) | 0.831***(11.001) | 0.383***(3.909) | 0.750***(9.523) | 0.504***(2.708) | 0.412**(2.430) | 0.297**(2.622) | 0.147**(2.242) | |
| lnUCI | 0.357**(2.488) | 0.192***(3.867) | |||||||
| lnINS | 0.488***(7.134) | 0.729(1.537) | |||||||
| lnGTI | 0.546***(4.069) | 0.391***(4.324) | |||||||
| 控制变量 | 是 | 是 | 是 | 是 | 是 | 是 | 是 | 是 | |
| [1] |
曾刚, 王丰龙. 长三角区域城市一体化发展能力评价及其提升策略[J]. 改革, 2018(12):103-111.
|
| [2] |
胡森林, 鲍涵, 郝均, 等. 环境规制对长三角城市绿色发展的影响——基于技术创新的作用路径分析[J]. 自然资源学报, 2022, 37(6):1572-1585.
|
| [3] |
程丹亚, 曾刚, 胡森林. 国外环境经济地理研究进展[J]. 经济地理, 2023, 43(3):44-56.
|
| [4] |
王胜鹏, 滕堂伟, 夏启繁, 等. 中国数字经济发展水平时空特征及其创新驱动机制[J]. 经济地理, 2022, 42(7):33-43.
|
| [5] |
韩晶, 陈曦, 冯晓虎. 数字经济赋能绿色发展的现实挑战与路径选择[J]. 改革, 2022(9):11-23.
|
| [6] |
周亮, 车磊, 周成虎. 中国城市绿色发展效率时空演变特征及影响因素[J]. 地理学报, 2019, 74(10):2027-2044.
|
| [7] |
邓宗兵, 肖沁霖, 王炬, 等. 中国数字经济与绿色发展耦合协调的时空特征及驱动机制[J]. 地理学报, 2024, 79(4):971-990.
|
| [8] |
窦睿音, 焦贝贝, 张文洁, 等. 西部资源型城市绿色发展效率时空分异与驱动力[J]. 自然资源学报, 2023, 38(1):238-254.
|
| [9] |
|
| [10] |
|
| [11] |
范丹, 孙晓婷. 环境规制、绿色技术创新与绿色经济增长[J]. 中国人口·资源与环境, 2020, 30(6):105-115.
|
| [12] |
|
| [13] |
|
| [14] |
|
| [15] |
程丹亚, 曾刚. 长三角区域绿色技术创新对工业二氧化碳排放影响的空间效应研究[J]. 长江流域资源与环境, 2023, 32(6):1152-1164.
|
| [16] |
余博, 潘爱民. 数字经济、人才流动与长三角地区高质量发展[J]. 自然资源学报, 2022, 37(6):1481-1493.
|
| [17] |
|
| [18] |
|
| [19] |
|
| [20] |
|
| [21] |
周灿, 曾刚, 尚勇敏. 演化经济地理学视角下创新网络研究进展与展望[J]. 经济地理, 2019, 39(5):27-36.
|
| [22] |
司月芳, 曾刚, 曹贤忠, 等. 基于全球—地方视角的创新网络研究进展[J]. 地理科学进展, 2016, 35(5):600-609.
|
| [23] |
范斐, 连欢, 王雪利, 等. 区域协同创新对创新绩效的影响机制研究[J]. 地理科学, 2020, 40(2):165-172.
|
| [24] |
孙大明, 原毅军. 空间外溢视角下的协同创新与区域产业升级[J]. 统计研究, 2019, 36(10):100-114.
|
| [25] |
周灿, 曾刚, 王丰龙, 等. 中国电子信息产业创新网络与创新绩效研究[J]. 地理科学, 2017, 37(5):661-671.
|
| [26] |
|
| [27] |
吴启余, 曾刚, 杨阳, 等. 长三角城市绿色创新效率时空演变与绿色创新网络驱动效应[J]. 长江流域资源与环境, 2024, 33(3):461-471.
|
| [28] |
盛科荣, 李晓瑞, 孙威, 等. 中国城市网络地位对碳排放效率的影响[J]. 地理学报, 2023, 78(11):2864-2882.
|
| [29] |
赵涛, 张智, 梁上坤. 数字经济、创业活跃度与高质量发展——来自中国城市的经验证据[J]. 管理世界, 2020, 36(10):65-76.
|
| [30] |
徐维祥, 周建平, 刘程军. 数字经济发展对城市碳排放影响的空间效应[J]. 地理研究, 2022, 41(1):111-129.
|
| [31] |
戴靓, 丁子军, 曹湛, 等. 长三角地区城市协同创新网络的演化特征及其驱动力[J]. 资源科学, 2023, 45(5):1006-1019.
|
| [32] |
黄寰, 黄辉, 肖义, 等. 产业结构升级、政府生态环境注意力与绿色创新效率——基于中国115个资源型城市的证据[J]. 自然资源学报, 2024, 39(1):104-124.
|
| [33] |
|
| [34] |
郭艺, 曹贤忠, 魏文栋, 等. 长三角区域一体化对城市碳排放的影响研究[J]. 地理研究, 2022, 41(1):181-192.
|
/
| 〈 |
|
〉 |