
Research on the Spatial Flows and Complexity of the Global Foreign Direct Investment
Received date: 2024-07-11
Revised date: 2025-05-03
Online published: 2025-07-07
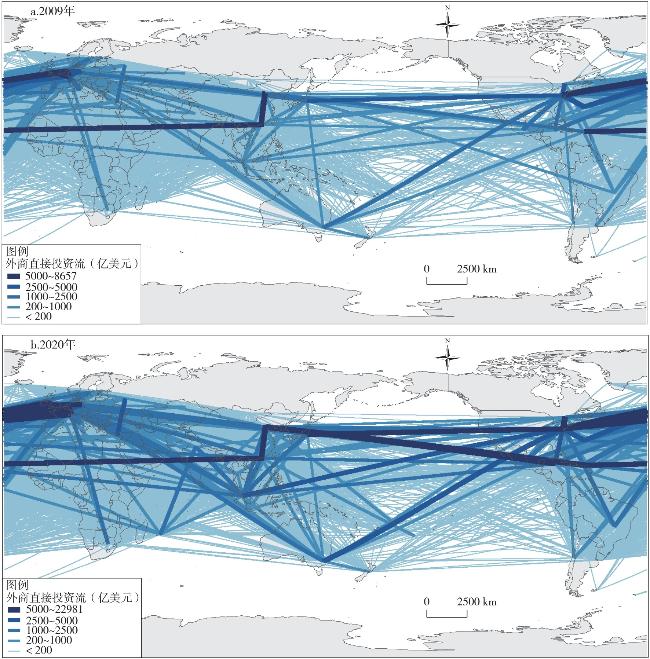
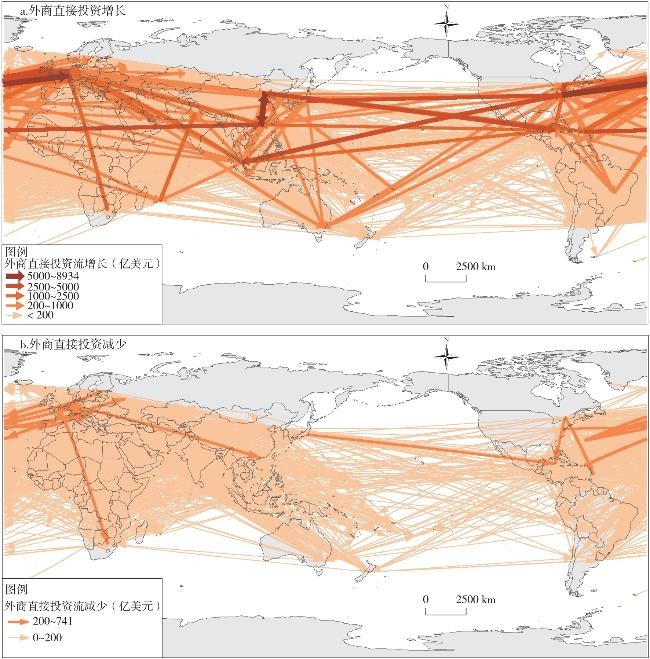
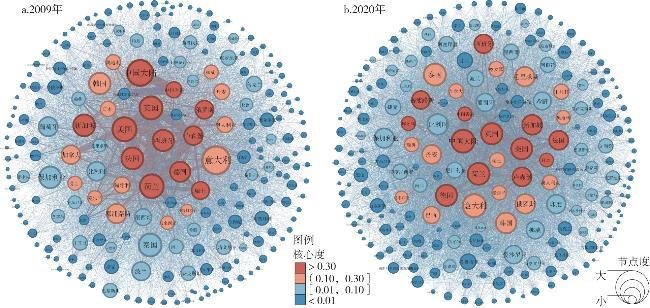
With globalization driving the transnational flow of capital, technology, and services, a complex, multilayered, and interwoven global foreign direct investment (FDI) network has gradually emerged among world economies. Analyzing the spatial dynamics and structural shifts of global FDI from a network perspective is essential for deepening our understanding of the complexity of the global FDI system and for advancing the research paradigm toward a more network-oriented approach. From the perspective of FDI mobility, this paper constructs a global FDI network dataset, integrates various network analysis methods to depict the evolution of global FDI flow patterns and explore the topological complexity of the global FDI network from macro, meso, and micro perspectives. The results show that: 1) The scale of global FDI has expanded continuously, giving rise to a spatial flow pattern characterized by clear hierarchical structures, increasing complexity, and significant spatial differentiation. FDI flows are notably concentrated in North America, Europe, and East Asia, with offshore financial centers playing a critical hub role in mediating global FDI movements. 2) The global FDI network has become increasingly dense, with improvements in connectivity, accessibility, and transmission efficiency. The network exhibits a pronounced core-periphery structure, with distinct hierarchical boundaries between core and peripheral components. 3) Countries such as China, the United States, the Netherlands, the United Kingdom, Luxembourg, Germany, France, and Switzerland occupy central positions in the network. Meanwhile, Canada, Japan, Ireland, Hong Kong (China), Bermuda, the Cayman Islands, and the British Virgin Islands exert significant global influence. Countries including Italy, Thailand, South Korea, Singapore, and Belgium serve important bridging roles. 4) In 2009-2020, the status of some developing countries is becoming increasingly prominent in the global FDI system. International events such as the Belt and Road Initiative, Brexit, and the COVID-19 pandemic have had varying degrees of impact on the evolution of the global FDI landscape.
CHEN Wei , ZHAO Xiquan . Research on the Spatial Flows and Complexity of the Global Foreign Direct Investment[J]. Economic geography, 2025 , 45(5) : 1 -12 . DOI: 10.15957/j.cnki.jjdl.2025.05.001
表1 全球外商直接投资网络的宏观拓扑描述Tab.1 Macro topological description of the global FDI network |
| 拓扑属性 | 2009 | 2012 | 2015 | 2018 | 2020 |
|---|---|---|---|---|---|
| 图规模 | 5444 | 6606 | 7137 | 7805 | 7782 |
| 网络密度 | 0.2180 | 0.2645 | 0.2858 | 0.3125 | 0.3116 |
| 全局集聚系数 | 0.5260 | 0.5613 | 0.5809 | 0.5870 | 0.5911 |
| 平均路径长度 | 1.1437 | 0.1298 | 0.3410 | 0.3525 | 0.2583 |
表2 全球外商直接投资网络中心性指标测度(排名前20位)Tab.2 Results of centrality indicators of the global FDI network (Top20) |
| 2009年 | 2020年 | ||||||||||
|---|---|---|---|---|---|---|---|---|---|---|---|
| 国家 (地区) | 加权 节点度 | 国家 (地区) | 中介 中心性 | 国家 (地区) | 特征向量 中心性 | 国家 (地区) | 加权 节点度 | 国家 (地区) | 中介 中心性 | 国家 (地区) | 特征向量 中心性 |
| 荷兰 | 58191 | 意大利 | 2677.32 | 荷兰 | 1.00 | 美国 | 114770 | 中国大陆 | 1237.94 | 美国 | 1.00 |
| 美国 | 56401 | 中国大陆 | 2155.20 | 美国 | 0.96 | 荷兰 | 92162 | 意大利 | 1194.34 | 荷兰 | 0.83 |
| 英国 | 36473 | 泰国 | 1285.94 | 英国 | 0.85 | 卢森堡 | 72735 | 泰国 | 1041.59 | 卢森堡 | 0.75 |
| 卢森堡 | 35661 | 美国 | 1230.15 | 卢森堡 | 0.71 | 英国 | 56137 | 荷兰 | 790.10 | 英国 | 0.65 |
| 法国 | 22242 | 荷兰 | 1084.67 | 法国 | 0.45 | 中国大陆 | 48748 | 韩国 | 765.76 | 瑞士 | 0.36 |
| 德国 | 20355 | 韩国 | 901.02 | 德国 | 0.42 | 中国香港 | 48737 | 美国 | 724.11 | 德国 | 0.34 |
| 中国香港 | 18445 | 英国 | 791.28 | 瑞士 | 0.32 | 德国 | 31340 | 毛里求斯 | 704.73 | 爱尔兰 | 0.33 |
| 瑞士 | 14754 | 保加利亚 | 787.03 | 百慕大 | 0.28 | 瑞士 | 29822 | 保加利亚 | 665.21 | 加拿大 | 0.29 |
| 中国大陆 | 14423 | 新加坡 | 779.22 | 加拿大 | 0.28 | 法国 | 24994 | 英国 | 586.22 | 中国香港 | 0.28 |
| 加拿大 | 11389 | 法国 | 645.47 | 比利时 | 0.25 | 英属维尔京群岛 | 24983 | 比利时 | 568.21 | 中国大陆 | 0.27 |
| 百慕大 | 11275 | 葡萄牙 | 630.70 | 西班牙 | 0.21 | 爱尔兰 | 24950 | 德国 | 562.80 | 法国 | 0.25 |
| 英属维尔京群岛 | 11148 | 西班牙 | 614.57 | 日本 | 0.20 | 新加坡 | 24439 | 新加坡 | 446.61 | 日本 | 0.24 |
| 西班牙 | 11125 | 塞浦路斯 | 401.27 | 爱尔兰 | 0.18 | 日本 | 21727 | 俄罗斯 | 410.13 | 开曼群岛 | 0.20 |
| 比利时 | 11038 | 德国 | 397.88 | 意大利 | 0.18 | 开曼群岛 | 21433 | 葡萄牙 | 386.05 | 百慕大 | 0.20 |
| 日本 | 10156 | 墨西哥 | 334.30 | 开曼群岛 | 0.15 | 加拿大 | 19858 | 法国 | 333.96 | 新加坡 | 0.20 |
| 意大利 | 8661 | 波兰 | 322.69 | 澳大利亚 | 0.12 | 百慕大 | 17535 | 卢森堡 | 325.46 | 英属维尔京群岛 | 0.17 |
| 爱尔兰 | 7432 | 比利时 | 316.42 | 中国香港 | 0.12 | 比利时 | 14936 | 西班牙 | 317.11 | 比利时 | 0.17 |
| 开曼群岛 | 6770 | 加拿大 | 314.93 | 瑞典 | 0.11 | 西班牙 | 14146 | 丹麦 | 314.38 | 西班牙 | 0.12 |
| 新加坡 | 6588 | 卢森堡 | 292.30 | 中国大陆 | 0.09 | 澳大利亚 | 10582 | 印度 | 301.44 | 澳大利亚 | 0.11 |
| 瑞典 | 6356 | 俄罗斯 | 286.09 | 新加坡 | 0.09 | 意大利 | 10348 | 爱沙尼亚 | 296.58 | 意大利 | 0.09 |
| [1] |
刘卫东,
|
| [2] |
|
| [3] |
|
| [4] |
|
| [5] |
黎明, 夏昕鸣, 朱晟君, 等. 中国对非直接投资时空演化及其影响因素[J]. 经济地理, 2017, 37(11):19-27.
|
| [6] |
李子枫, 薛德升. 我国地理学关于跨国投资的研究进展[J]. 人文地理, 2022, 37(6):1-11.
|
| [7] |
许志桦, 叶嘉安. 1980—2003年广东省外商投资的时空变化分析[J]. 地理学报, 2008, 63(12):1277-1288.
|
| [8] |
|
| [9] |
李涛, 刘家明, 王磊, 等. 中国外商旅游饭店业投资的空间动态差异与驱动要素解析[J]. 地理学报, 2017, 72(10):1904-1919.
|
| [10] |
范毓婷, 刘卫东. 中国纺织企业海外直接投资空间格局[J]. 地理科学进展, 2018, 37(3):418-426.
|
| [11] |
|
| [12] |
|
| [13] |
|
| [14] |
|
| [15] |
|
| [16] |
|
| [17] |
|
| [18] |
|
| [19] |
|
| [20] |
李文韬, 李诗韵, 贺灿飞. 全球对外直接投资网络的环节分异与空间特征[J]. 地理科学进展, 2023, 42(2):221-236.
|
| [21] |
|
| [22] |
黄晓东, 杜德斌, 刘承良. 全球跨境并购网络的空间格局演化及形成机制[J]. 地理学报, 2021, 76(10):2536-2550.
|
| [23] |
计启迪, 陈伟, 刘卫东. 全球跨境并购网络结构及其演变特征[J]. 地理研究, 2020, 39(3):527-538.
|
| [24] |
|
| [25] |
|
| [26] |
|
| [27] |
|
| [28] |
杨文龙, 杜德斌. “一带一路”沿线国家投资网络结构及其影响因素:基于ERGM模型的研究[J]. 世界经济研究, 2018, 291(5):80-94,136-137.
|
| [29] |
|
| [30] |
|
| [31] |
|
| [32] |
|
| [33] |
|
| [34] |
|
| [35] |
|
| [36] |
|
| [37] |
|
| [38] |
|
/
| 〈 |
|
〉 |