
Spatiotemporal Differentiation and Influencing Factors of Green Development Efficiency in the Yangtze River Delta Urban Agglomeration
Received date: 2024-10-25
Revised date: 2025-03-05
Online published: 2025-06-24
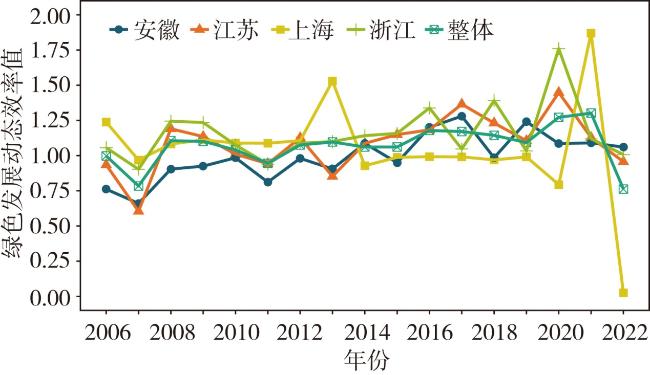
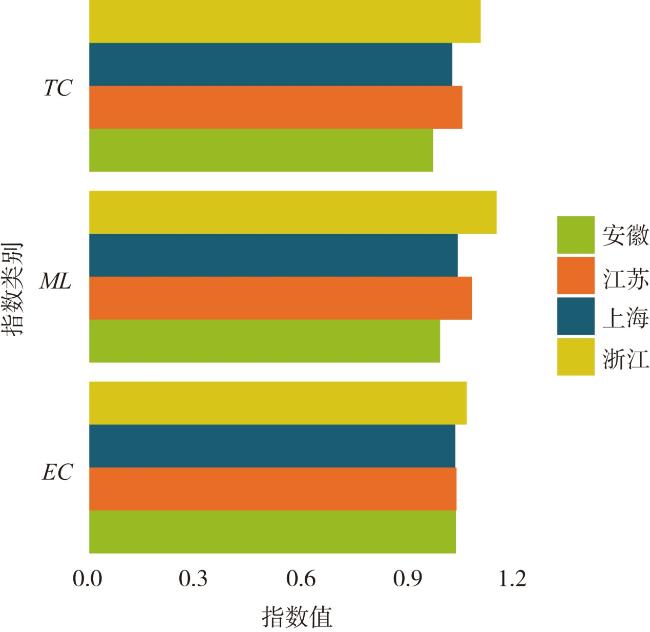
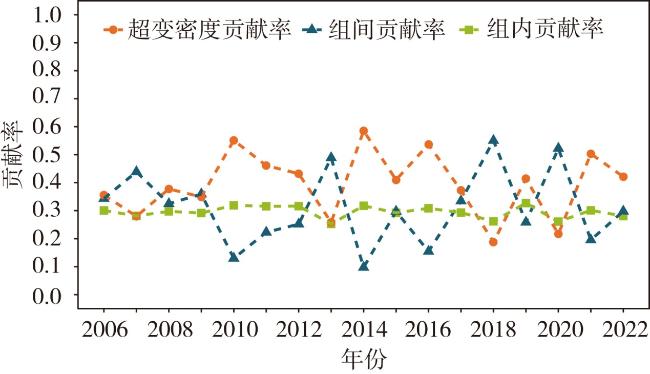
Based on the data of 41 cities in the Yangtze River Delta (YRD) urban agglomeration from 2006 to 2022, this paper measures the green development efficiency of the YRD urban agglomeration, analyzes its spatiotemporal dynamic pattern using the SBM model of super-efficient network considering non-expected outputs and the Malmquist-Luenberger (ML) index. It explores the intrinsic mechanism affecting the green development efficiency based on the geographic detector. It's found that: 1) The static efficiency of green development generally shows a fluctuating upward trend in the YRD urban agglomeration from 2006 to 2022, but there are significant differences and imbalances among cities. It has higher efficiency of green development in Wenzhou, Chizhou and Shaoxing, while it has lower efficiency of green development in Yancheng and Wuhu. 2) Dynamic efficiency of green development shows different change characteristics at different stages. The Dagum index analysis shows that the overall Gini coefficient decreases, but the efficiency gap among three provinces and Shanghai fluctuates greatly. 3) Fiscal decentralisation, urbanization level, and the degree of openness to the outside world have an important impact on the efficiency of green development, and the interaction between urbanization level and market size, fiscal decentralisation and financial development plays a key role in improving efficiency in a given year.
CHEN Hongzhang , DAI Yufang , HUANG Ting , WEN Youdong . Spatiotemporal Differentiation and Influencing Factors of Green Development Efficiency in the Yangtze River Delta Urban Agglomeration[J]. Economic geography, 2025 , 45(4) : 47 -55 . DOI: 10.15957/j.cnki.jjdl.2025.04.005
表1 交互探测因素交互作用强弱的判断标准及说明Tab.1 Criteria and explanation for judging the strength of interaction among interactive detection factors |
| 判断标准 | 交互作用 |
|---|---|
| q(x1∩x2) | 非线性减弱 |
| min[q(x1),q(x2)]<q(x1∩x2)<max[(q(x1),q(x2)] | 单因子非线性减弱 |
| q(x1∩x2)>max[(q(x1),q(x2)] | 双因子增强 |
| q(x1∩x2)>q(x1)+q(x2) | 非线性增强 |
| q(x1∩x2)=q(x1)+q(x2) | 相互独立 |
表2 绿色发展效率指标体系及说明Tab.2 Indicator system of green development efficiency and its explanation |
| 分类 | 指标名称 | 指标描述 | 数据来源 |
|---|---|---|---|
| 投入 变量 | 资本要素 | 固定资产投资总额(万元) | 《中国城市统计年鉴》 |
| 科学技术支出(万元) | |||
| 教育支出(万元) | |||
| 劳动力要素 | 年末单位从业人员数(万人) | ||
| 技术要素 | 专利申请数(件) | ||
| 资源要素 | 新质生产力政策支持度(%) | 地方政府工作报告 | |
| 中间 产出 | 中间产出 | 专利授权数(件) | 《中国城市统计年鉴》 |
| 产业结构整体升级(%) | |||
| 产出 变量 | 期望产出 | 地区生产总值(万元) | 《中国城市统计年鉴》 |
| 非期望产出 | 工业废水排放量(万t) | ||
| 工业SO2排放量(t) | |||
| 工业烟粉尘产生量(t) |
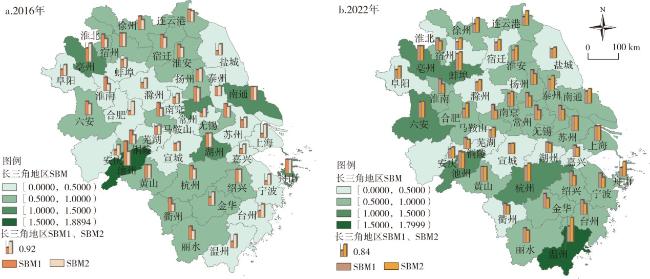
表3 2006—2022年长三角城市群部分城市绿色发展效率及排名Tab.3 Green development efficiency of selected cities in the YRD urban agglomeration from 2006 to 2022 |
| 城市 | 2006 | 2022 | 均值 | 排名 |
|---|---|---|---|---|
| 温州 | 0.4690 | 1.7999 | 1.7279 | 1 |
| 池州 | 1.8894 | 1.3025 | 1.1214 | 2 |
| 舟山 | 1.0652 | 0.5803 | 1.1003 | 3 |
| 绍兴 | 1.0000 | 0.6699 | 1.0622 | 4 |
| 黄山 | 1.0000 | 1.0000 | 1.0000 | 5 |
| 南通 | 1.0442 | 0.8281 | 0.5932 | 20 |
| 金华 | 0.5925 | 0.6723 | 0.5902 | 21 |
| 铜陵 | 0.6596 | 0.4505 | 0.5707 | 22 |
| 淮安 | 0.7495 | 0.7204 | 0.5671 | 23 |
| 泰州 | 0.4950 | 0.7318 | 0.5595 | 24 |
| 合肥 | 0.2815 | 0.6174 | 0.4148 | 37 |
| 嘉兴 | 0.2501 | 0.4929 | 0.4074 | 38 |
| 滁州 | 0.2910 | 0.4765 | 0.4041 | 39 |
| 芜湖 | 0.4072 | 0.3344 | 0.3692 | 40 |
| 盐城 | 0.2590 | 0.4521 | 0.3347 | 41 |
表4 2006—2022年长三角城市群绿色发展效率的Dagum基尼系数Tab.4 Dagum Gini coefficient of green development efficiency in the YRD urban agglomeration from 2006 to 2022 |
| 年份 | 基尼系数 | |||
|---|---|---|---|---|
| 总体 | 组内基尼系数Gw | 组间基尼系数Gb | 超变密度基尼系数Gt | |
| 2006 | 0.232 | 0.070 | 0.080 | 0.083 |
| 2007 | 0.202 | 0.057 | 0.088 | 0.056 |
| 2008 | 0.229 | 0.068 | 0.074 | 0.086 |
| 2009 | 0.183 | 0.053 | 0.066 | 0.064 |
| 2010 | 0.152 | 0.048 | 0.020 | 0.084 |
| 2011 | 0.177 | 0.056 | 0.039 | 0.082 |
| 2012 | 0.129 | 0.041 | 0.032 | 0.056 |
| 2013 | 0.131 | 0.033 | 0.064 | 0.034 |
| 2014 | 0.136 | 0.043 | 0.013 | 0.080 |
| 2015 | 0.160 | 0.047 | 0.048 | 0.066 |
| 2016 | 0.187 | 0.058 | 0.029 | 0.100 |
| 2017 | 0.162 | 0.048 | 0.054 | 0.060 |
| 2018 | 0.144 | 0.038 | 0.079 | 0.027 |
| 2019 | 0.166 | 0.054 | 0.043 | 0.069 |
| 2020 | 0.221 | 0.058 | 0.115 | 0.048 |
| 2021 | 0.120 | 0.036 | 0.024 | 0.061 |
| 2022 | 0.156 | 0.044 | 0.047 | 0.066 |
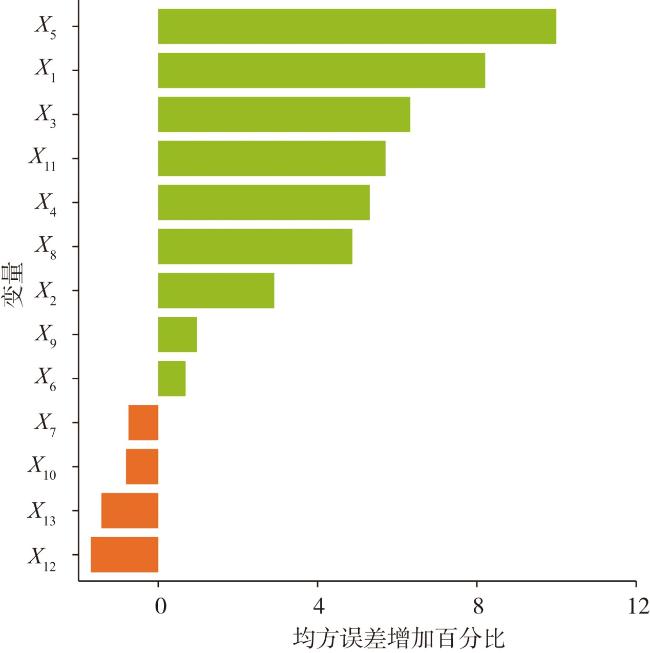
表5 长三角城市群绿色发展效率影响因子探测结果Tab.5 Detection results of influencing factors of green development efficiency in the YRD urban agglomeration |
| 年份 | X1 | X2 | X3 | X4 | X5 | X6 | X8 | X9 | X11 |
|---|---|---|---|---|---|---|---|---|---|
| 2008 | 0.137 | 0.139 | 0.244 | 0.277 | 0.469*** | 0.453*** | 0.163 | 0.260 | 0.413* |
| 2018 | 0.356*** | 0.184 | 0.371*** | 0.321 | 0.413*** | 0.246 | 0.405*** | 0.209 | 0.336*** |
| 2021 | 0.525*** | 0.526*** | 0.973*** | 0.124*** | 0.236*** | 0.532*** | 0.534*** | 0.164*** | 0.965*** |
注:***、**、*分别表示影响因素在1%、5%与10%水平上显著。 |
表6 长三角城市群绿色发展效率双因子增强交互探测结果Tab.6 Interactive detection results of dual-factor enhancement of green development efficiency in the YRD urban agglomeration |
| 2008 | 2018 | 2021 | |||
|---|---|---|---|---|---|
| 主导交互因素 | 值 | 主导交互因素 | 值 | 主导交互因素 | 值 |
| X3∩X11 | 0.6048 | X3∩X8 | 0.6610 | X5∩X6 | 0.5490 |
| X8∩X11 | 0.5545 | X1∩X4 | 0.6504 | X1∩X2 | 0.5265 |
| X2∩X11 | 0.5106 | X3∩X4 | 0.6266 | X4∩X9 | 0.2186 |
| X4∩X11 | 0.4718 | X8∩X4 | 0.6073 | ||
| X1∩X11 | 0.4716 | X3∩X11 | 0.5957 | ||
| [1] |
樊杰. “健全主体功能区制度体系”的经济地理学讨论[J]. 经济地理, 2024, 44(8):1-7.
|
| [2] |
胡鞍钢, 周绍杰. 绿色发展:功能界定、机制分析与发展战略[J]. 中国人口·资源与环境, 2014, 24(1):14-20.
|
| [3] |
马建堂, 蔡昉, 高培勇, 等. 学习贯彻落实党的二十届三中全会精神笔谈[J]. 中国工业经济, 2024(7):5-28.
|
| [4] |
|
| [5] |
魏后凯, 叶兴庆, 黄祖辉, 等. 进一步全面深化改革,开创高质量发展新局面——权威专家研究阐释党的二十届三中全会精神[J]. 中国农村经济, 2024(9):2-21.
|
| [6] |
任保平, 程至瑜, 宗景辉. 新质生产力形成中制造业新质化发展水平测度与时空演进[J]. 数量经济技术经济研究, 2024, 41(12):5-24.
|
| [7] |
邹德玲, 丛海彬, 李钰, 等. 长三角城市群内小城镇产业集聚效率时空演变与影响因素[J]. 经济地理, 2023, 43(4):73-82.
|
| [8] |
|
| [9] |
卢丽文, 宋德勇, 李小帆. 长江经济带城市发展绿色效率研究[J]. 中国人口·资源与环境, 2016, 26(6):35-42.
|
| [10] |
秦炳涛, 柳佳男. 长三角绿色发展效率时空演变及空间溢出分析——基于Super-SBM模型和Tobit回归[J]. 生态经济, 2022, 38(11):64-71.
|
| [11] |
杨志江, 文超祥. 中国绿色发展效率的评价与区域差异[J]. 经济地理, 2017, 37(3):10-18.
|
| [12] |
黄磊, 吴传清. 长江经济带城市工业绿色发展效率及其空间驱动机制研究[J]. 中国人口·资源与环境, 2019, 29(8):40-49.
|
| [13] |
卢新海, 杨喜, 陈泽秀. 中国城市土地绿色利用效率测度及其时空演变特征[J]. 中国人口·资源与环境, 2020, 30(8):83-91.
|
| [14] |
辛龙, 孙慧, 王慧, 等. 基于地理探测器的绿色经济效率时空分异及驱动力研究[J]. 中国人口·资源与环境, 2020, 30(9):128-138.
|
| [15] |
周亮, 车磊, 周成虎. 中国城市绿色发展效率时空演变特征及影响因素[J]. 地理学报, 2019, 74(10):2027-2044.
|
| [16] |
施建刚, 段锴丰, 吴光东, 等. 碳排放约束下长三角地区城乡融合发展效率[J]. 经济地理, 2021, 41(6):57-67.
|
| [17] |
王素凤, 曹开心. 基于三阶段DEA模型的长三角城市雾霾治理效率研究[J]. 南京信息工程大学学报(自然科学版), 2023, 15(5):621-630.
|
| [18] |
王淑婧, 李俊峰. 长三角城市群高质量绿色发展的均衡性特征及障碍因素[J]. 自然资源学报, 2022, 37(6):1540-1554.
|
| [19] |
周雪琼. 新质生产力、颠覆性技术创新与碳福利绩效[J]. 工业技术经济, 2024, 43(6):40-48.
|
| [20] |
田光辉, 李江苏, 苗长虹, 等. 基于非期望产出的中国城市绿色发展效率及影响因素分析[J]. 经济地理, 2022, 42(6):83-91.
|
| [21] |
陈明华, 刘文斐, 王山, 等. 黄河流域绿色发展绩效评价、差异分解及驱动因素[J]. 中国人口·资源与环境, 2022, 32(4):126-133.
|
| [22] |
张国兴, 张婧钰. 黄河流域资源型城市高质量发展的时空演变[J]. 中国人口·资源与环境, 2023, 33(2):124-133.
|
| [23] |
王洪艳. 新质生产力对碳排放效率的影响——基于产业结构高度化和合理化的双重视角[J]. 统计与决策, 2024, 40(17):24-29.
|
| [24] |
张鹏伟. 新质生产力赋能制造业绿色转型探析[J]. 财会月刊, 2024, 45(20):116-122.
|
| [25] |
张启航, 张亚连, 谭桂菲, 等. 中国林业碳汇效率时空演化特征——基于三阶段超效率数据包络分析模型[J]. 生态学报, 2024, 44(15):6769-6782.
|
| [26] |
|
| [27] |
|
| [28] |
|
| [29] |
郭庆宾, 马梦瑶, 程叶青. 海南自由贸易港城乡融合发展水平的时空特征及其驱动机理[J]. 经济地理, 2024, 44(12):62-71.
|
| [30] |
杜锦, 苗长虹, 许家伟, 等. 中原城市群城市高质量发展时空格局与影响因素[J]. 经济地理, 2025, 45(01):67-76.
|
| [31] |
周思杨, 李巍, 陈佳璇, 等. 矿产资源型城市工业路径依赖综合诊断方法——基于改进的柯布—道格拉斯生产函数[J]. 中国环境科学, 2019, 39(1):412-419.
|
| [32] |
谢婷婷, 李玉梅, 潘宇. 外商直接投资、技术进步与产业结构升级——基于中国省域空间计量分析[J]. 工业技术经济, 2018, 37(8):35-43.
|
| [33] |
汪伟, 刘玉飞, 彭冬冬. 人口老龄化的产业结构升级效应研究[J]. 中国工业经济, 2015(11):47-61.
|
/
| 〈 |
|
〉 |
