
Network Pattern and Spatio-temporal Evolution of Aviation Flows of Chinese Urban Agglomeration System
Received date: 2023-12-28
Revised date: 2024-12-24
Online published: 2025-06-24
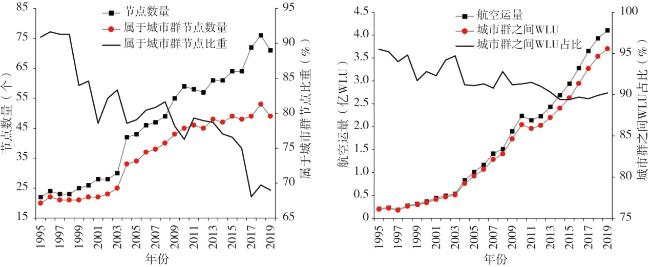
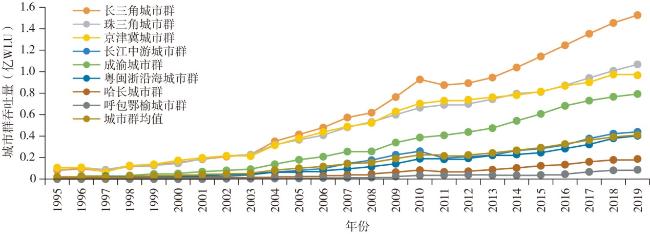
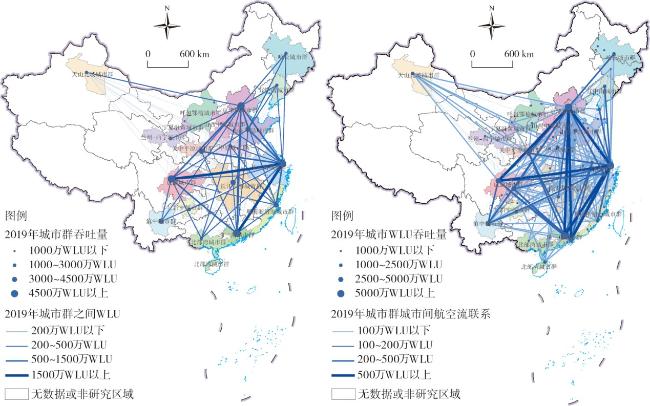
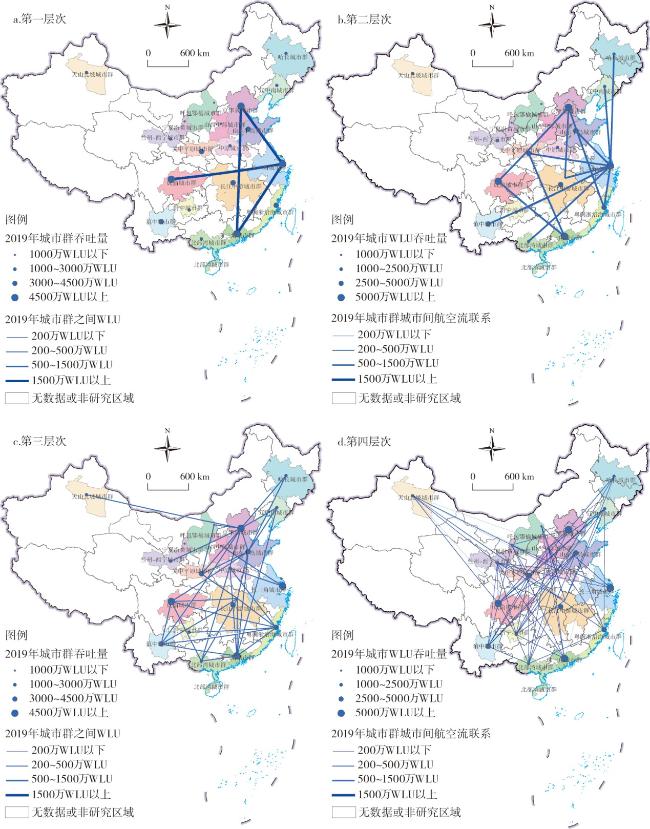
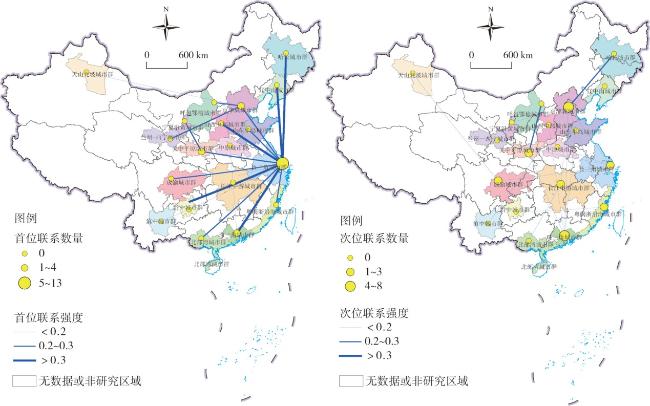
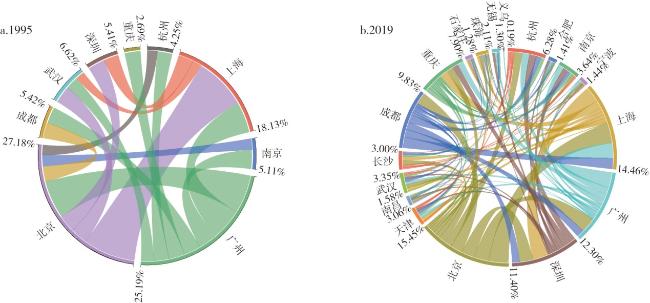
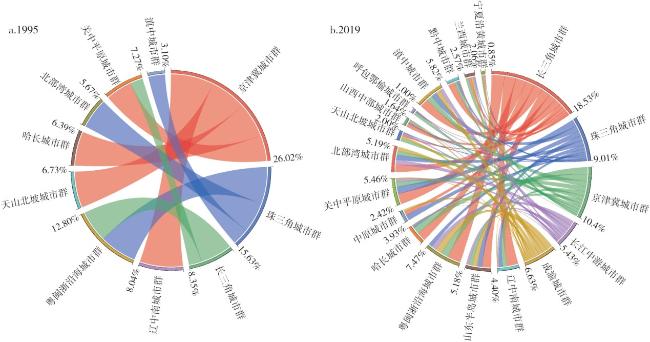
Based on the flow data of air passenger and cargo, and using the methods of spatial visualization and complex network analysis, this paper analyzes the network pattern and spatiotemporal characteristics of aviation flows of China's urban agglomeration system in 19 urban agglomerations. The study shows that: 1) The aviation traffic between 19 urban agglomerations accounts for more than 90% of the overall aviation traffic in the country. 2) The aviation network of China's urban agglomeration system exhibits a multi-center, tiered structure with uneven spatial distribution. Major hubs—Beijing-Tianjin-Hebei, Yangtze River Delta, Pearl River Delta, and Chengdu-Chongqing—form a four-core, spoke-and-axis framework, all located in the southeast of the Hu Huanyong Line. This aligns with the "5+5+9" spatial configuration outlined in China's 14th Five-Year Plan. 3)In 1995-2019, the aviation flow of Chengdu-Chongqing urban agglomeration experienced the most rapid growth, the Yangtze River Delta urban agglomeration surpassed the Beijing-Tianjin-Hebei urban agglomeration as the leading hub, widening its dominance. The ranking of urban agglomerations such as Mid-southern Liaoning, Harbin-Changchun, and Central Yunnan declined. The status of nodes such as Hangzhou, Nanjing, Ningbo, Shenzhen and Chongqing has rapidly been rapidly improved, and they tend to form a healthy development in the hierarchical structure of urban agglomerations. Guangdong-Fujian-Zhejiang coastal urban agglomeration, Shandong Peninsula urban agglomeration and Beibu Gulf urban agglomeration have multiple internal nodes, with weak hierarchical structure, while other urban agglomerations show nascent but immature internal structure. 4) The changes in airline attractiveness of the five major urban agglomerations to the rest 14 urban agglomerations indicate that the influence of distance on inter-urban agglomeration linkages is weakening, while the improvement of urban agglomerations competitiveness level will deepen the linkages with the other urban agglomerations all over the country.
WEN Yuyuan , SHENG Lei . Network Pattern and Spatio-temporal Evolution of Aviation Flows of Chinese Urban Agglomeration System[J]. Economic geography, 2025 , 45(4) : 35 -46 . DOI: 10.15957/j.cnki.jjdl.2025.04.004
表1 1995、2003、2011和2019年中国WLU吞吐量前十位城市群(单位:万WLU)Tab.1 Top 10 urban agglomerations in terms of WLU throughput in 1995, 2003, 2011 and 2019 (unit: ten thousand WLU) |
| 排序 | 1995 | 2003 | 2011 | 2019 | |||||||
|---|---|---|---|---|---|---|---|---|---|---|---|
| 城市群 | 吞吐量 | 城市群 | 吞吐量 | 城市群 | 吞吐量 | 城市群 | 吞吐量 | ||||
| 1 | 京津冀 | 1062.83 | 长三角 | 2281.34 | 长三角 | 8435.38 | 长三角 | 14691.75 | |||
| 2 | 珠三角 | 993.92 | 珠三角 | 2194.31 | 京津冀 | 7069.86 | 珠三角 | 10486.25 | |||
| 3 | 长三角 | 803.87 | 京津冀 | 2132.52 | 珠三角 | 6677.26 | 京津冀 | 9278.93 | |||
| 4 | 成渝 | 213.00 | 成渝 | 859.70 | 成渝 | 3582.44 | 成渝 | 7362.11 | |||
| 5 | 粤闽浙沿海 | 190.13 | 粤闽浙沿海 | 478.93 | 长江中游 | 1916.94 | 长江中游 | 4171.43 | |||
| 6 | 长江中游 | 136.12 | 滇中 | 455.89 | 粤闽浙沿海 | 1812.05 | 粤闽浙沿海 | 4034.07 | |||
| 7 | 辽中南 | 119.36 | 长江中游 | 398.31 | 关中平原 | 1495.39 | 关中平原 | 3454.70 | |||
| 8 | 关中平原 | 107.98 | 北部湾 | 372.92 | 滇中 | 1405.49 | 山东半岛 | 3075.64 | |||
| 9 | 天山北坡 | 99.99 | 辽中南 | 275.82 | 山东半岛 | 1200.79 | 滇中 | 2984.48 | |||
| 10 | 哈长 | 94.93 | 关中平原 | 251.13 | 辽中南 | 1164.46 | 北部湾 | 2637.80 | |||
表2 1995、2003、2011和2019年中国前十位城市群间WLU运输量Tab.2 Top 10 inter-urban agglomerations of WLU traffic in China in 1995, 2003, 2011 and 2019 |
| 排序 | 1995 | 2003 | 2011 | 2019 |
|---|---|---|---|---|
| 1 | 长三角—京津冀 | 长三角—珠三角 | 长三角—珠三角 | 长三角—珠三角 |
| 2 | 长三角—珠三角 | 长三角—京津冀 | 长三角—京津冀 | 长三角—京津冀 |
| 3 | 珠三角—京津冀 | 珠三角—京津冀 | 珠三角—京津冀 | 长三角—成渝 |
| 4 | 珠三角—成渝 | 珠三角—成渝 | 长三角—成渝 | 珠三角—京津冀 |
| 5 | 京津冀—辽中南 | 珠三角—北部湾 | 珠三角—成渝 | 珠三角—成渝 |
| 6 | 珠三角—粤闽浙沿海 | 长三角—粤闽浙沿海 | 京津冀—成渝 | 京津冀—成渝 |
| 7 | 京津冀—天山北坡 | 京津冀—成渝 | 长三角—粤闽浙沿海 | 长三角—粤闽浙沿海 |
| 8 | 京津冀—哈长 | 京津冀—辽中南 | 长三角—辽中南 | 长三角—辽中南 |
| 9 | 长三角—粤闽浙沿海 | 珠三角—长江中游 | 珠三角—粤闽浙沿海 | 长三角—关中平原 |
| 10 | 珠三角—北部湾 | 长三角—成渝 | 京津冀—长江中游 | 长三角—哈长 |
| [1] |
方创琳, 宋吉涛. 中国城市群结构体系的组成与空间分异格局[J]. 地理学报, 2005(5):827-840.
|
| [2] |
|
| [3] |
方创琳, 祁巍锋, 宋吉涛. 中国城市群紧凑度的综合测度分析[J]. 地理学报, 2008, 63(10):1011-1021.
|
| [4] |
黄妍妮, 高波, 魏守华. 中国城市群空间结构分布与演变特征[J]. 经济学家, 2016(9):50-58.
|
| [5] |
|
| [6] |
|
| [7] |
|
| [8] |
|
| [9] |
王少剑, 高爽, 王宇渠. 基于流空间视角的城市群空间结构研究——以珠三角城市群为例[J]. 地理研究, 2019, 38(8):1849-1861.
|
| [10] |
方大春, 孙明月. 高铁时代下长三角城市群空间结构重构——基于社会网络分析[J]. 经济地理, 2015, 35(10):50-56.
|
| [11] |
吴凤连, 郝丽莎, 王晓歌, 等. 基于高铁联系的中国东部城市服务业发展潜力格局——社会网络分析视角[J]. 经济地理, 2020, 40(4):145-154.
|
| [12] |
顾朝林, 庞海峰. 基于重力模型的中国城市体系空间联系与层域划分[J]. 地理研究, 2008, 27(1):1-12.
|
| [13] |
|
| [14] |
顾朝林. 城市群研究进展与展望[J]. 地理研究, 2011, 30(5):771-784.
|
| [15] |
赵璟, 党兴华, 王修来. 城市群空间结构的演变——来自中国西部地区的经验证据[J]. 经济评论, 2009(4):27-34.
|
| [16] |
|
| [17] |
孙斌栋, 王婷, 刘鹏飞. 中国城市群空间结构演化的影响因素分析——基于铁路客运的功能联系视角[J]. 人文地理, 2019, 34(5):78-84.
|
| [18] |
|
| [19] |
|
| [20] |
张浩然, 衣保中. 城市群空间结构特征与经济绩效——来自中国的经验证据[J]. 经济评论, 2012(1):42-47,115.
|
| [21] |
于斌斌, 郭东. 城市群空间结构的经济效率:理论与实证[J]. 经济问题探索, 2021(7):148-164.
|
| [22] |
刘修岩, 李松林, 秦蒙. 城市空间结构与地区经济效率——兼论中国城镇化发展道路的模式选择[J]. 管理世界, 2017(1):51-64.
|
| [23] |
陈维肖, 刘玮辰, 段学军. 基于“流空间”视角的铁路客运空间组织分析——以长三角城市群为例[J]. 地理研究, 2020, 39(10):2330-2344.
|
| [24] |
马学广, 鹿宇. 基于航空客运流的中国城市空间格局与空间联系[J]. 经济地理, 2018, 38(8):47-57.
|
| [25] |
王姣娥, 景悦. 中国城市网络等级结构特征及组织模式——基于铁路和航空流的比较[J]. 地理学报, 2017, 72(8):1508-1519.
|
| [26] |
王成, 王茂军, 柴箐. 城市网络地位与网络权力的关系——以中国汽车零部件交易链接网络为例[J]. 地理学报, 2015, 70(12):1953-1972.
|
| [27] |
路旭, 马学广, 李贵才. 基于国际高级生产者服务业布局的珠三角城市网络空间格局研究[J]. 经济地理, 2012, 32(4):50-54.
|
| [28] |
|
| [29] |
|
| [30] |
|
| [31] |
|
| [32] |
朱政, 朱翔, 李霜霜. 长江中游城市群空间结构演变历程与特征[J]. 地理学报, 2021, 76(4):799-817.
|
| [33] |
方创琳. 中国城市群研究取得的重要进展与未来发展方向[J]. 地理学报, 2014, 69(8):1130-1144.
|
| [34] |
李娜, 于涛方, 郭怀成. 中国城市体系格局与演变:航空流视角(英文)[J]. 北京大学学报(自然科学版), 2010, 46(6):972-984.
|
| [35] |
|
| [36] |
周灿, 曾刚, 曹贤忠. 中国城市创新网络结构与创新能力研究[J]. 地理研究, 2017, 36(7):1297-1308.
|
| [37] |
陈伟, 修春亮, 柯文前, 等. 多元交通流视角下的中国城市网络层级特征[J]. 地理研究, 2015, 34(11):2073-2083.
|
/
| 〈 |
|
〉 |

