
Nonlinear Effects and Spatial Differentiation of Synergy in Pollution Reduction and Carbon Emission Reduction Driven by Science and Technology under the Background of New Quality Productive Forces
Received date: 2024-08-20
Revised date: 2024-12-30
Online published: 2025-06-24
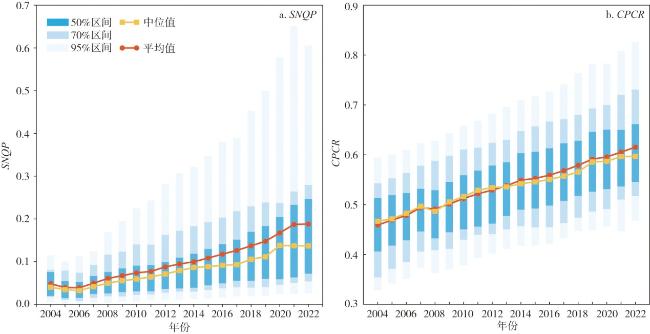
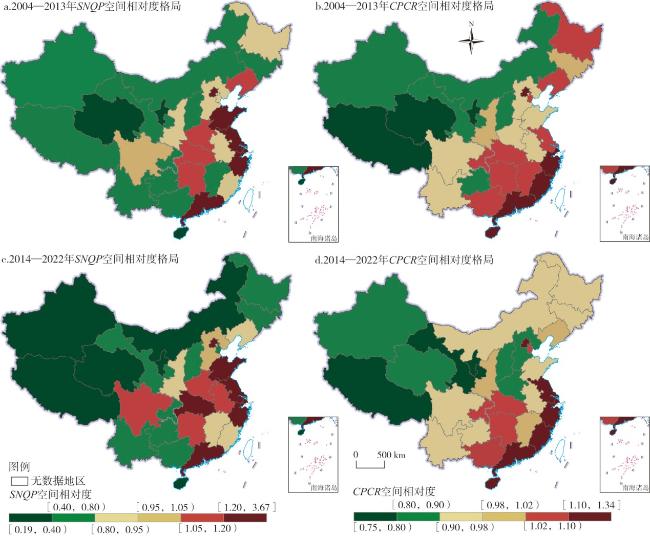
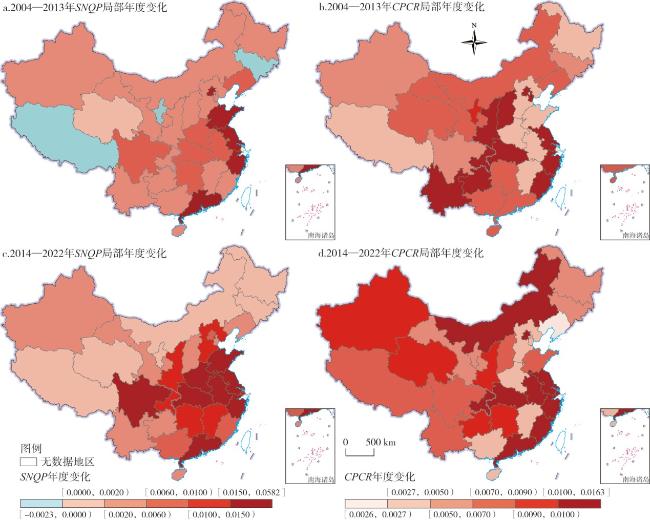
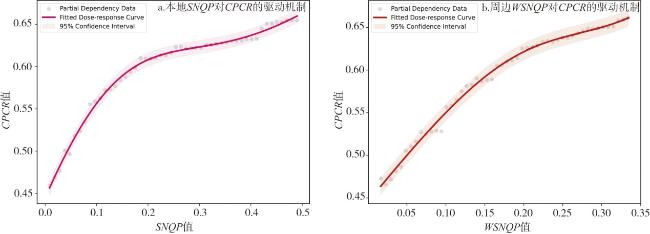
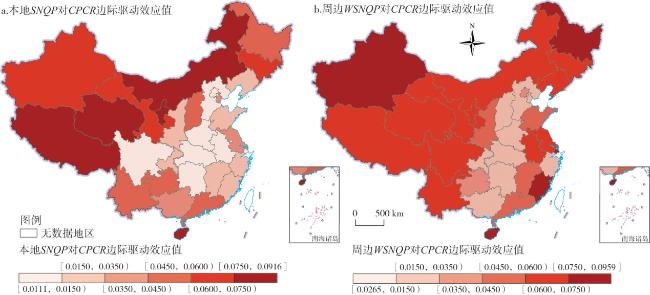
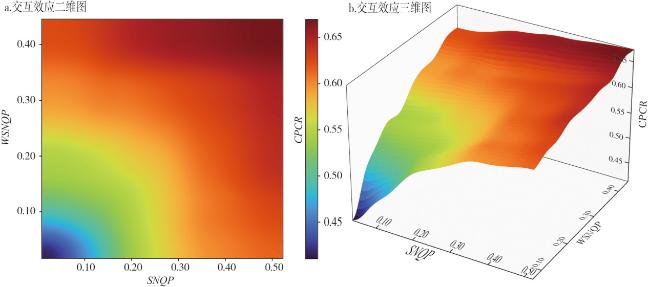
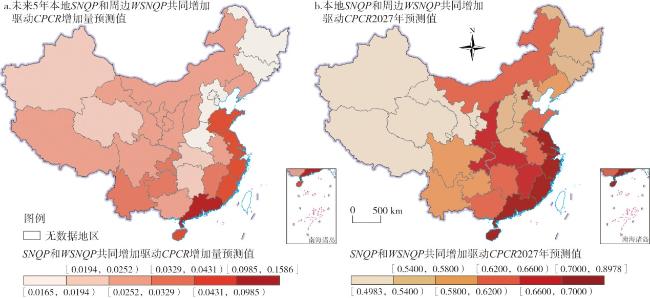
Science new-quality productivity (SNQP) is crucial for high-quality development and significantly impacts achieving coordinated pollution and carbon reduction (CPCR). This study measures SNQP and CPCR in provincial-level regions of China from 2004 to 2022 using a spatiotemporal dynamic entropy method and analyzes their spatiotemporal evolution in 2004-2013 and 2014-2022 with a Bayesian spatiotemporal evolution model. It identifies causal relationships between local SNQP and surrounding SNQP (WSNQP) on CPCR using three causal inference methods, and proposes a principal component-spatiotemporal random forest model (PCA-STRF). It examines the nonlinear driving effect, interaction and spatial differentiation of SNQP and WSNQP on CPCR by the means of the GeoDetector, and predicts the changing scenarios for the next five years. Results show that: 1) SNQP and CPCR both exhibit a growth trend and imbalance spatial distribution which is higher in the southeast of China and lower in the northwest of China. 2) Both SNQP and WSNQP have significant positive effects on CPCR, but their impact follows a nonlinear pattern which is the strongest at low value, the weakest at medium value, and slightly stronger at high value. 3) Additionally, SNQP and WSNQP also have a significant two-factor interactive enhancement effect on CPCR. Especially when both are at a relatively high level, the enhancement rate of CPCR increases significantly. 4)_Under the condition that other factors remain unchanged, after each of SNQP and WSNQP increases by 0.10, the marginal driving effect presents the spatial distribution which is higher in the east and west of China and lower in central China, but the spatial differentiation degree of WSNQP is stronger than that of SNQP. 5) In the next five years, the SNQP and WSNQP in the eastern coastal areas will increase significantly, and the CPCR will increase significantly. Finally, it puts forward some suggestions: formulating regional balanced development policies to narrow the regional gap of SNQP, promoting ecological civilization construction and high-quality development through strengthening regional coordination and giving full play to the positive promoting role of SNQP on CPCR.
LI Junming , HU Yaxuan , DU Wenjing , LI Jiaqi , LI Zhirui , PEI Naying . Nonlinear Effects and Spatial Differentiation of Synergy in Pollution Reduction and Carbon Emission Reduction Driven by Science and Technology under the Background of New Quality Productive Forces[J]. Economic geography, 2025 , 45(4) : 109 -122 . DOI: 10.15957/j.cnki.jjdl.2025.04.011
表1 CPCR评价指标体系及说明Tab.1 Evaluation index system of CPCR and its explanation |
| 一级指标 | 二级指标 | 指标含义 | 属性 |
|---|---|---|---|
| 减污降碳 协同效果 | 排放强度 | 对应单位GDP的排放量(t/万元) | - |
| 排放强度 | - | ||
| 排放强度 | - | ||
| 排放强度 | - | ||
| 排放强度 | - | ||
| 排放强度变化 | 对应单位GDP的排放量年度环比(%) | - | |
| 排放强度变化 | - | ||
| 排放强度变化 | - | ||
| 排放强度变化 | - | ||
| 排放强度变化 | - | ||
| 扩绿效果 | 森林覆盖率 | 森林面积占土地总面积的百分比(%) | + |
| 经济增长 | 人均 GDP | GDP/年末常住人口数(万元/人) | + |
| 产业清洁 | 规模以上工业单位增加值能耗 | 工业能源消费/工业增加值(t标准煤/万元) | - |
| 一般工业固体废物综合利用率 | 一般工业固体废物综合利用量/一般工业固体废物产生量(包括综合利用往年贮存量)(%) | + | |
| 能源效率 | 能源消费率 | 能源消费总量/地区生产总值(t标准煤/万元) | - |
| 绿色交通 | 非公路货运周转量占比 | 铁路、水路等绿色运输承担货运周转量/货运周转量总量(%) | + |
表2 SNQP的评价指标体系及说明Tab.2 Evaluation index system of SNQP and its explanation |
| 一级指标 | 二级指标 | 单位 | 属性 |
|---|---|---|---|
| 科技研发投入 | 规上工业R&D人员全时当量 | 人 | + |
| 普通高等学校毕(结)业生数 | 万人 | + | |
| 教育经费占GDP比重 | % | + | |
| 规上工业企业R&D经费 | 万元 | + | |
| 规上工业R&D项目(课题)数 | 项 | + | |
| 科技创新环境 | 研究与开发机构数 | 个 | + |
| 高新技术企业数 | 个 | + | |
| 互联网宽带接入端口 | 万个 | + | |
| 区域创新创业指数 | 无量纲 | + | |
| 科技成果产出 | 专利授权数量 | 件 | + |
| 论文发表数量 | 篇 | + | |
| 科技成果转化 | 高技术产业业务收入 | 万元 | + |
| 技术市场成交额 | 亿元 | + | |
| 规模以上工业企业新产品销售收入 | 亿元 | + | |
| 规模以上工业企业R&D经费支出与营业收入之比 | % | + | |
| 全要素生产率 | % | + |
表3 本文变量及说明Tab.3 Variable explanation |
| 变量 | 变量名称 | 英文缩写 | ||
|---|---|---|---|---|
| 被解释变量 | 减污降碳协同增效 | 减污降碳协同增效水平(无量纲) | CPCR | |
| 核心解释变量 | 科技生产力 | 本地科技生产力水平(无量纲) | SNQP | |
| 周边科技生产力水平(无量纲) | WSNQP | |||
| 影响协变量(本地和周边) | 经济社会因素 | 人口密度 | 人口密度(百人/km2 ) | PODE/WPODE |
| 老龄化率 | 65岁以上老年人口占比(%) | POAR/WPOAR | ||
| 环境污染治理投资强度 | 环境污染治理投资额与GDP的比值(万元/万亿元) | PIEP/WPIEP | ||
| 外资利用水平 | 实际利用外资占GDP比重(%) | PAFC/WPAFC | ||
| 民众环保意识强度 | 环境保护关键词百度搜索指数(无量纲) | BEPK/WBEPK | ||
| 政府环境规制强度 | 政府工作报告环境保护关键词词频(‰) | FEGR/WFEGR | ||
| 地理环境因素 | 城市道路建设水平 | 每万人城市道路里程数(km/万人) | URMP/WURMP | |
| 降水量 | 年度降水总量(mm) | TAPR/WTAPR | ||
| 植被覆盖水平 | 植被覆盖指数(无量纲) | NDVI/WNDVI | ||
| 地形条件 | 高程平均值(m) | AETE/WAETE | ||
表4 基于B-PSM方法的因果变量识别结果Tab.4 Identification results of causal variables based on B-PSM method |
| 变量名 | 实验组与对照组的CPCR均值差异 | 95%的 置信区间 | 实验组与对照组 CPCR均值差绝对值 大于0的后验概率 |
|---|---|---|---|
| SNQP | 0.0453 | 0.0234,0.0684 | 0.9999 |
| WSNQP | 0.0219 | 0.0029,0.0414 | 0.9846 |
| POAR | 0.0081 | -0.0109,0.0269 | 0.8091 |
| PIEP | -0.0118 | -0.0328,0.0105 | 0.8672 |
| PAFC | 0.0343 | 0.0135,0.0540 | 1.0000 |
| FEGR | 0.0127 | 0.0069,0.0328 | 0.9000 |
| URMP | 0.0300 | 0.0024,0.0579 | 0.9830 |
| TAPR | 0.0123 | -0.0248,0.0483 | 0.7443 |
| NDVI | 0.0532 | 0.0103,-0.0903 | 0.9923 |
| WPIEP | -0.0059 | -0.0335,0.0212 | 0.6777 |
| WPAFC | 0.0126 | 0.0088,0.0350 | 0.9011 |
表5 基于BSTCF和双重稳健估计法对因果关系的识别Tab.5 Identification of causal relationships based on BSTCF and double robust estimation method |
| 变量名 | BSTCF估计结果 | 双重稳健估计法估计结果 | |||
|---|---|---|---|---|---|
| 因果效应 | 因果效应为正 的后验概率 | 因果效应 | 假设检验P值 | ||
| SNPQ | 0.0584 | 1.0000 | 0.0303 | <0.0001 | |
| WSNPQ | 0.0532 | 1.0000 | 0.0524 | <0.0001 | |
| PAFC | 0.0592 | 1.0000 | 0.0164 | <0.0001 | |
| FEGR | 0.0491 | 0.8846 | 0.0870 | <0.0001 | |
| URMP | 0.0530 | 1.0000 | 0.0262 | <0.0001 | |
| NDVI | 0.0143 | 0.8659 | 0.0375 | <0.0001 | |
| WPAFC | 0.0561 | 0.9559 | 0.0120 | 0.0016 | |
| [1] |
卢江, 郭子昂, 王煜萍. 新质生产力发展水平、区域差异与提升路径[J]. 重庆大学学报(社会科学版), 2024, 30(3):1-17.
|
| [2] |
王珂, 郭晓曦. 中国新质生产力水平、区域差异与时空演进特征[J]. 统计与决策, 2024, 40(9):30-36.
|
| [3] |
王珏, 王荣基. 新质生产力:指标构建与时空演进[J]. 西安财经大学学报, 2024, 37(1):31-47.
|
| [4] |
龚日朝. 新质生产力统计内涵、指标体系与应用研究[J]. 湖南科技大学学报(社会科学版), 2024, 27(3):84-93.
|
| [5] |
孙丽伟, 郭俊华. 新质生产力评价指标体系构建与实证测度[J]. 统计与决策, 2024(9):5-11.
|
| [6] |
叶振宇, 徐鹏程. 中国新质生产力指数:理论依据与评价分析[J]. 兰州大学学报(社会科学版), 2024, 52(3):23-35.
|
| [7] |
李光勤, 李梦娇. 中国省域新质生产力水平评价、空间格局及其演化特征[J]. 经济地理, 2024, 44(8):116-125.
|
| [8] |
|
| [9] |
钟顺昌, 焦怡萌, 闫程莉, 等. 建设用地资源空间集聚对减污降碳协同的影响机制[J]. 地理学报, 2024, 79(3):688-711.
|
| [10] |
李俊明, 魏雯琪, 张鹏, 等. 中国市域数字经济发展对减污降碳协同的促进效应及其空间分异[J]. 经济地理, 2023, 43(12):169-180.
|
| [11] |
王雅楠, 李冰迅, 张艺芯, 等. 中国减污降碳协同效应时空特征与影响因素[J]. 环境科学, 2024, 45(9):4993-5002.
|
| [12] |
|
| [13] |
原伟鹏, 孙慧, 王晶, 等. 中国城市减污降碳协同的时空演化及驱动力探析[J]. 经济地理, 2022, 42(10):72-82
|
| [14] |
刘耀彬, 邓伟凤, 李硕硕, 等. 数字产业集聚对减污降碳协同的影响——以长江经济带为例[J]. 资源科学, 2024, 46(4):744-760.
|
| [15] |
邓荣荣, 张翱祥. 中国城市数字经济发展对环境污染的影响及机理研究[J]. 南方经济, 2022, 41(2):18-37.
|
| [16] |
韩冬日, 吕晓丽, 董会忠, 等. 数字技术对降碳减污协同增效的门槛效应[J]. 资源科学, 2023, 45(11):2130-2143.
|
| [17] |
程云洁, 段鑫. 数字经济能促进城市减霾降碳吗?——基于八大国家级大数据试验区的准自然实证分析[J]. 软科学, 2023, 38(1):8-15.
|
| [18] |
缪陆军, 陈静, 范天正, 等. 数字经济发展对碳排放的影响——基于 278 个地级市的面板数据分析[J]. 南方金融, 2022(2):45-57.
|
| [19] |
李云燕, 杜文鑫. 京津冀城市群减污降碳时空特征及影响因素异质性分析[J]. 环境工程技术学报, 2023, 13(6):2006-2015.
|
| [20] |
|
| [21] |
|
| [22] |
王敏, 杨儒浦, 李丽平. 城市减污降碳协同度评价指标体系构建及应用研究[J]. 气候变化研究进展, 2024, 20(2):242-252.
|
| [23] |
|
| [24] |
|
| [25] |
李俊明, 周佳卉, 李杰, 等. 基于贝叶斯统计的黄河流域生态文明与共同富裕的时空协同演进研究[J]. 地球信息科学学报, 2023, 25(4):766-782.
|
| [26] |
|
| [27] |
李俊明. 基于 Bayesian 层次时空模型的我国老龄化分析与预测[J]. 统计研究, 2016, 33(8):89-94.
|
| [28] |
|
| [29] |
|
| [30] |
|
| [31] |
|
| [32] |
|
| [33] |
|
| [34] |
|
| [35] |
王劲峰, 徐成东. 地理探测器:原理与展望[J]. 地理学报, 2017, 72(1):116-134.
|
/
| 〈 |
|
〉 |