
Temporal and Spatial Evolution Characteristics and Influencing Factors of Accommodation Industry in Changde City
Received date: 2019-11-20
Revised date: 2020-05-24
Online published: 2025-05-14
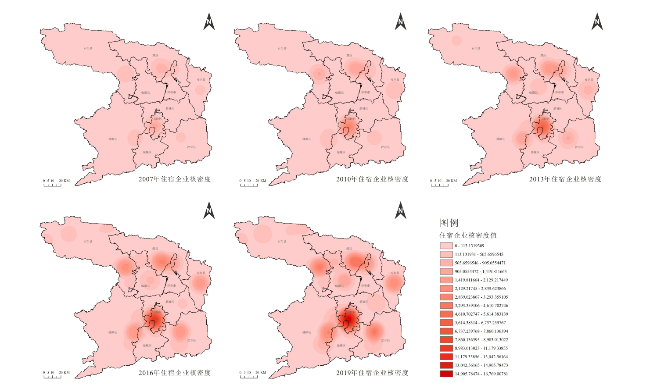
The study of the spatial structure of the accommodation industry is more common in large cities and provincial capitals,but it is very lacking in the local cities with the advanced level of economic development. Changde has a good representation in the above aspects. The thesis divides the development of accommodation enterprises in Changde into five stages. By using nearest neighbor index,kernel density estimation and standard deviation ellipse and correlation coefficient analysis in ArcGIS,the research shows that:Firstly,It shows the overall growth trend of the accommodation enterprises in Changde from 2008; Secondly, the focus of accommodation Enterprises expands to the southeast,mainly concentrated in Wuling District and Dingcheng District,and the degree of agglomeration of accommodation enterprises is constantly strengthening;Thirdly,The number and density of the accommodation enterprises in the existing or new agglomeration areas are increasing,and the overall distribution shows the characteristics of one "core",multiple "points" and "slice";Fourthly,as a whole,the accommodation enterprises are obviously affected by the transportation station,the administrative center (government resident),the commercial center and the regional GDP,but there are some differences between the A level scenic spots and the population density. In future,the layout and management of the accommodation enterprises should pay attention to the following aspects: In the first place,government needs to strengthen the layout planning of accommodation enterprises along the transportation route;Secondly,consider expanding to larger regions with abundant tourism resources; Thirdly,the government needs to increase the regional layout of the rich tourism resources in Shimen,Taoyuan and Lixian County; Lastly,upgrading the existing accommodation industry,appropriately increasing the number of high-star accommodation enterprises and improving the level of service.
XIA Hanjun , YUAN Mengqi , YANG Zhi , ZHANG Qi , TANG Yutu . Temporal and Spatial Evolution Characteristics and Influencing Factors of Accommodation Industry in Changde City[J]. Economic geography, 2020 , 40(6) : 156 -165 . DOI: 10.15957/j.cnki.jjdl.2020.06.017
表1 常德市各县(区、市)不同时段新增住宿企业数量Tab.1 The number of new accommodation enterprises of different districts and counties in Changde City at different time periods |
| 县(区、市)名 | 每个县(区、市)在不同阶段的住宿企业数量 | 每个县(区、市)在不同阶段所占的比例/% | |||||||||||
|---|---|---|---|---|---|---|---|---|---|---|---|---|---|
| 总数 | 2007 | 2008—2010 | 2011—2013 | 2014—2016 | 2017—2019 | 总数 | 2007 | 2008—2010 | 2011—2013 | 2014—2016 | 2017—2019 | ||
| 武陵区 | 265 | 14 | 28 | 40 | 67 | 116 | 100 | 5.28 | 10.57 | 15.09 | 25.28 | 43.77 | |
| 鼎城区 | 110 | 6 | 16 | 19 | 27 | 42 | 100 | 5.45 | 14.55 | 17.27 | 24.55 | 38.18 | |
| 安乡县 | 55 | 3 | 6 | 7 | 22 | 17 | 100 | 5.45 | 10.91 | 12.73 | 40.00 | 30.91 | |
| 汉寿县 | 76 | 3 | 2 | 14 | 27 | 30 | 100 | 3.95 | 2.63 | 18.42 | 35.53 | 39.47 | |
| 桃源县 | 89 | 6 | 4 | 19 | 26 | 34 | 100 | 6.74 | 4.49 | 21.35 | 29.21 | 38.20 | |
| 临澧县 | 40 | 1 | 0 | 7 | 8 | 24 | 100 | 2.50 | 0.00 | 17.50 | 20.00 | 60.00 | |
| 石门县 | 97 | 11 | 17 | 18 | 28 | 23 | 100 | 11.34 | 17.53 | 18.56 | 28.87 | 23.71 | |
| 澧县 | 84 | 15 | 9 | 10 | 25 | 25 | 100 | 17.86 | 10.71 | 11.90 | 29.76 | 29.76 | |
| 津市市 | 41 | 4 | 10 | 9 | 5 | 13 | 100 | 9.76 | 24.39 | 21.95 | 12.20 | 31.71 | |
| 总数 | 857 | 63 | 92 | 143 | 235 | 324 | 100 | 7.35 | 10.74 | 16.69 | 27.42 | 37.81 | |
| 县(区、市)名 | 每个县(区、市)在同一时段所占的比例/% | ||||||||||||
| 总数 | 2007 | 2008—2010 | 2011—2013 | 2014—2016 | 2017—2019 | ||||||||
| 武陵区 | 30.92 | 22.22 | 30.43 | 27.97 | 28.51 | 35.80 | |||||||
| 鼎城区 | 12.84 | 9.52 | 17.39 | 13.29 | 11.49 | 12.96 | |||||||
| 安乡县 | 6.42 | 4.76 | 6.52 | 4.90 | 9.36 | 5.25 | |||||||
| 汉寿县 | 8.87 | 4.76 | 2.17 | 9.79 | 11.49 | 9.26 | |||||||
| 桃源县 | 10.39 | 9.52 | 4.35 | 13.29 | 11.06 | 10.49 | |||||||
| 临澧县 | 4.67 | 1.59 | 0.00 | 4.90 | 3.40 | 7.41 | |||||||
| 石门县 | 11.32 | 17.46 | 18.48 | 12.59 | 11.91 | 7.10 | |||||||
| 澧县 | 9.80 | 23.81 | 9.78 | 6.99 | 10.64 | 7.72 | |||||||
| 津市市 | 4.78 | 6.35 | 10.87 | 6.29 | 2.13 | 4.01 | |||||||
| 武陵区 | 30.92 | 22.22 | 30.43 | 27.97 | 28.51 | 35.80 | |||||||
注:资料来源于实地普查,数据统计截止到2019年年末。 |
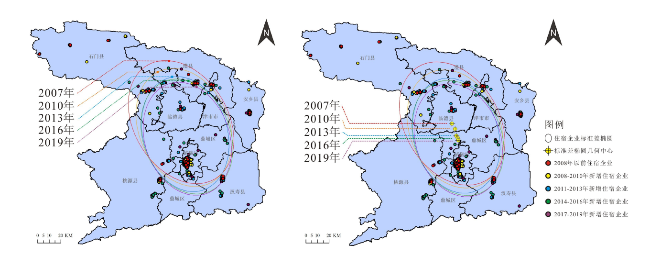
表2 常德市住宿业分布的最邻近指数及空间结构类型Tab.2 The NNI and space type of accommodation enterprises in Changde City |
| 时间 | P-value | Z-score | R | SST |
|---|---|---|---|---|
| 2007 | 0.000000 | -11.350000 | 0.252267 | 集聚 |
| 2010 | 0.000000 | -18.834461 | 0.209219 | 集聚 |
| 2013 | 0.000000 | -27.116679 | 0.178897 | 集聚 |
| 2016 | 0.000000 | -36.990743 | 0.162473 | 集聚 |
| 2019 | 0.000000 | -48.475982 | 0.134424 | 集聚 |
注:R为最邻近指数,SST为空间结构类型。 |
表3 标准差椭圆分析结果数据Tab.3 SDE analysis results date |
| 时间 | Shape-Area | XStdDist | YStdDist | Center(X,Y) | Rotation |
|---|---|---|---|---|---|
| 2007 | 0.579806 | 0.509702 | 0.362111 | (29.349411°N,111.649475°E) | 148.714336° |
| 2010 | 0.516648 | 0.473382 | 0.347438 | (29.308078°N,111.672134°E) | 156.045079° |
| 2013 | 0.461204 | 0.451984 | 0.324828 | (29.256257°N,111.681739°E) | 163.177791° |
| 2016 | 0.482216 | 0.458115 | 0.335080 | (29.238221°N,111.693555°E) | 157.9437° |
| 2019 | 0.457410 | 0.447153 | 0.325628 | (29.220592°N,111.697301°E) | 160.684503° |
注:Shape-Area为标准差椭圆面积,XStdDist、YStdDist为标准差椭圆的X轴长、Y轴长,Center(X,Y)为标准差椭圆的几何中心坐标,Rotation为标准差椭圆的方位角。由于数据单位为经纬度单位,因此结果只能做相对参考。 |
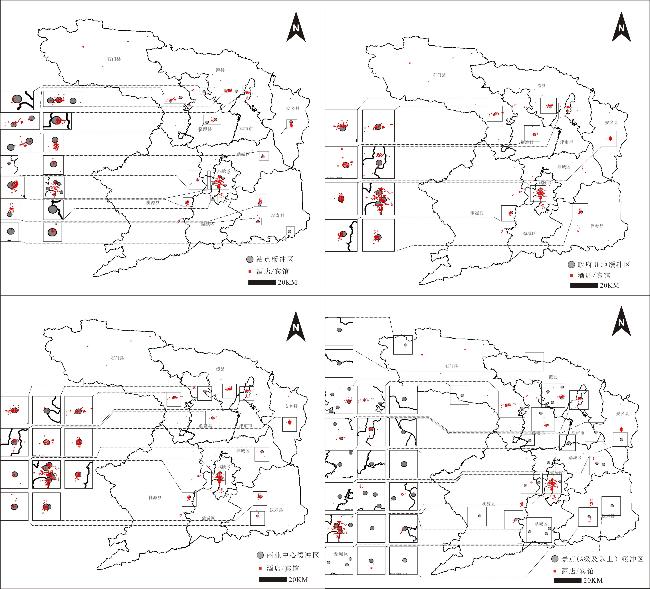
图4 各项指标与住宿企业的分布关系Fig.4 The distribution relationship of elements and accommodation enterprises |
表4 人口密度、GDP与住宿企业分布数量的关系Tab.4 The relationship of population density,GDP and the number of accommodation enterprises |
| 县(区、市) | 住宿企业数量(个) | 地区人口密度(人/km2) | GDP(亿元) |
|---|---|---|---|
| 武陵区 | 265 | 1 494.08 | 1416.8 |
| 鼎城区 | 110 | 322.8 | 336.8 |
| 安乡县 | 55 | 497.58 | 193 |
| 汉寿县 | 76 | 406.69 | 297.73 |
| 桃源县 | 89 | 218.12 | 368.7297 |
| 临澧县 | 40 | 370.99 | 178.2 |
| 石门县 | 97 | 168.18 | 278.22 |
| 澧县 | 84 | 441.3 | 358.03 |
| 津市市 | 41 | 418.3 | 158.2 |
注:数据更新时间到2019年。 |
表5 各地区住宿企业数量与人口密度、GDP的线性相关性系数计算结果Tab.5 Calculated results of linear correlation coefficient between the number of residential enterprises and regional population density and regional GDP |
| 地区人口密度 (人/km2) | GDP (亿元) | |
|---|---|---|
| 住宿企业数量(个) | 0.84 | 0.98 |
| 住宿企业数量(除去武陵区)(个) | -0.58 | 0.86 |
注:数据更新时间到2019年。 |
感谢湖南铁道富孝职业培训学校李大军老师指导湖南文理学院学生李亮牌、曾祥乐、叶美婷、陈圆圆、周绿丝、谭佳欣、丁爱瞳、周佳、邓玲秀、宋楠、屈韵洁、范玉莹、刘楚、江春美前期的数据调研工作与郭萍、王熙敏和吴悔的数据整理。
| [1] |
|
| [2] |
|
| [3] |
|
| [4] |
|
| [5] |
|
| [6] |
|
| [7] |
|
| [8] |
|
| [9] |
|
| [10] |
|
| [11] |
|
| [12] |
|
| [13] |
|
| [14] |
文吉. 中国星级酒店空间布局研究[J]. 商业研究, 2004(21):154-159.
|
| [15] |
黄静波. 中国省域星级饭店业的优势特征及其形成机理[J]. 旅游学刊, 2007, 22(5):61-65.
|
| [16] |
胡宇娜, 梅林, 魏建国. 中国酒店业效率的时空演变及驱动机制[J]. 世界地理研究, 2017(3):34-39.
|
| [17] |
李飞, 张玉华. 珠江三角洲城市星级饭店空间分布影响因素研究[J]. 商讯商业经济文荟, 2005(5):1-4,47.
|
| [18] |
姜海宁, 肖海平, 李广斌, 等. 长三角五星级酒店空间格局研究[J]. 商业研究, 2011(7):79-83.
|
| [19] |
唐健雄, 何倩. 长株潭城市群酒店业空间布局研究[J]. 经济地理, 2015, 45(11):45-50
|
| [20] |
刘炼鑫, 唐健雄, 李智文, 等. 我国“一带一路”沿线省市酒店业时空演化与联动研究[J]. 中南林业科技大学学报:社会科学版, 2018, 56(2):67-72.
|
| [21] |
闫丽英, 韩会然, 陈婉婧, 等. 北京市住宿业空间分布格局及影响因素研究[J]. 经济地理, 2014, 34(1):94-101.
|
| [22] |
胡波. 上海市星级饭店空间分布特征研究[D]. 上海: 同济大学, 2007.
|
| [23] |
李庄容. 基于竞争视角的广州高星级酒店集聚分析[J]. 经济地理, 2007, 27(4):697-700.
|
| [24] |
刘伟强. 北京旅馆业的时空结构解析[J]. 旅游学刊, 1998(6):46-50,59.
|
| [25] |
胡志毅, 张兆干. 城市饭店的空间布局分析——以南京市为例[J]. 经济地理, 2002, 22(1):106-110.
|
| [26] |
赵媛, 黄秋昊. 基于GIS技术的城市酒店空间分布研究[J]. 数量经济技术经济研究, 2003(8):155-158.
|
| [27] |
侯兵, 黄震方, 陈肖静. 主客体视角的城市经济型酒店空间分布研究——以扬州市为例[J]. 旅游学刊, 2009(5):72-79.
|
| [28] |
姜海宁, 肖海平, 李广斌, 等. 长三角五星级酒店空间格局研究[J]. 商业研究, 2011(7):79-83.
|
| [29] |
|
/
| 〈 |
|
〉 |